

Key Insights
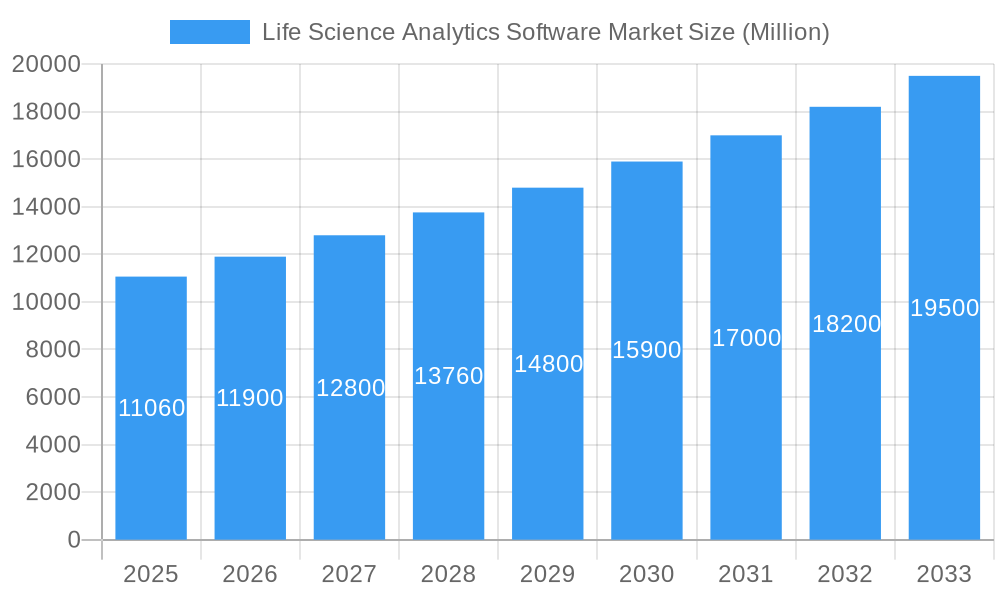
The Life Science Analytics Software market, valued at $11.06 billion in 2025, is projected to experience robust growth, driven by the increasing adoption of advanced analytics in drug discovery, clinical trials, and precision medicine. The market's Compound Annual Growth Rate (CAGR) of 7.71% from 2025 to 2033 indicates a significant expansion, fueled by several key factors. The rising volume of healthcare data, coupled with the need for efficient data management and insightful analysis, is a major driver. Furthermore, the growing demand for personalized medicine and the increasing use of AI and machine learning in life sciences research are accelerating market adoption. The market is segmented by product type (descriptive, predictive, and prescriptive analytics), application (R&D, supply chain, sales & marketing), component (software and services), and end-user (clinical research institutions, pharmaceutical and biotech companies, medical device companies). Prescriptive analytics, offering solutions for optimized decision-making, is expected to witness significant growth within the product type segment. Similarly, the pharmaceutical and biotechnology companies segment will likely dominate the end-user landscape due to their substantial investment in R&D and the need for data-driven insights to enhance drug development processes. Competition is fierce, with established players like SAS Institute, IBM, and Oracle competing alongside specialized firms such as SCIOInspire and emerging players. Geographic growth will be driven by regions like North America and Europe, although Asia-Pacific is poised for rapid expansion due to its burgeoning pharmaceutical industry and increasing government support for digital health initiatives.
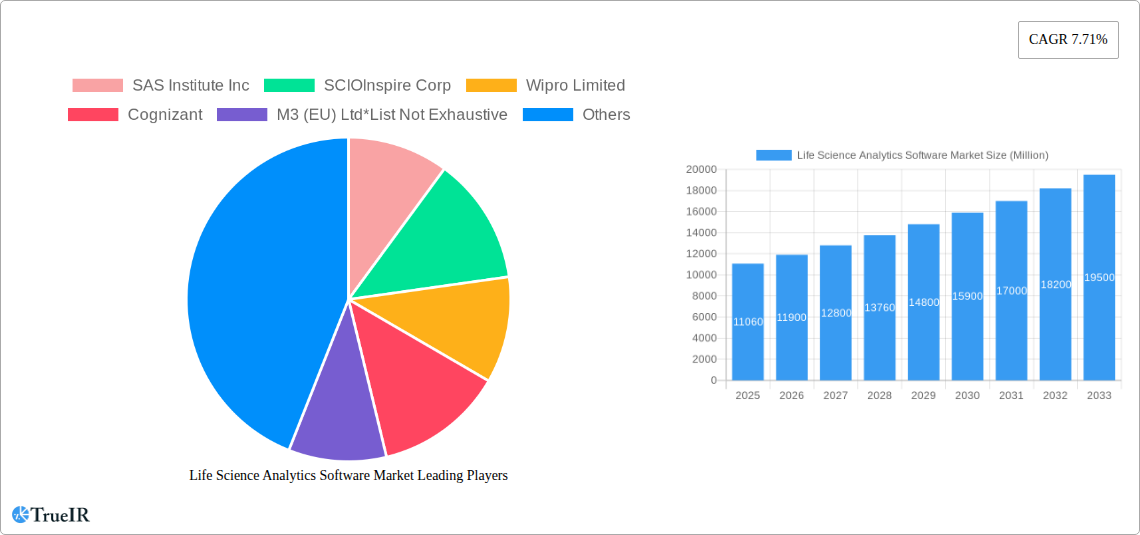
Life Science Analytics Software Market Market Size (In Billion)
The sustained growth in this market is further supported by several trends such as the growing integration of cloud-based analytics solutions, the increasing demand for real-time data analysis, and the development of sophisticated analytical tools specifically designed for the life sciences industry. While data security and privacy concerns, along with the high cost of implementing advanced analytics solutions, pose some restraints, the overall market outlook remains positive, with opportunities for growth across all segments. The market's future trajectory is expected to be shaped by ongoing technological advancements, the increasing focus on data interoperability, and the continuous evolution of regulatory frameworks within the life sciences industry. This suggests that companies that invest in innovation and strategic partnerships will be best positioned to capitalize on this expanding market.
Life Science Analytics Software Market Company Market Share
Life Science Analytics Software Market: A Comprehensive Report (2019-2033)
This dynamic report provides a detailed analysis of the Life Science Analytics Software Market, offering invaluable insights for stakeholders across the pharmaceutical, biotechnology, and medical device industries. Leveraging extensive market research conducted during the study period (2019-2024), with a base year of 2025 and forecast period spanning 2025-2033, this report delivers a 360° view of market trends, competitive dynamics, and future growth potential. The total market value is estimated at xx Million in 2025 and is projected to reach xx Million by 2033, exhibiting a robust CAGR of xx%.
Life Science Analytics Software Market Structure & Competitive Landscape
The Life Science Analytics Software Market exhibits a moderately consolidated structure, with several large players and a growing number of niche players. Market concentration, measured by the Herfindahl-Hirschman Index (HHI), is estimated at xx in 2025, indicating a moderately competitive landscape. Innovation is a key driver, with companies continuously developing advanced analytics solutions leveraging AI, machine learning, and big data technologies. Regulatory compliance (e.g., GDPR, HIPAA) significantly influences market dynamics, shaping software development and data handling practices. Product substitutes, such as traditional statistical methods and consulting services, present competitive pressure, though the demand for sophisticated analytics is growing rapidly.
End-User Segmentation: The market is largely driven by Pharmaceutical and Biotechnology Companies, followed by Clinical Research Institutions and Medical Device Companies. Other end-users constitute a smaller but growing segment.
M&A Trends: The past five years have witnessed xx M&A deals in the life science analytics software sector, with a significant increase in activity observed in 2023-2024 as larger players sought to expand their capabilities and market share. This trend is likely to continue, driven by the desire to access advanced technologies and broader market reach.
Life Science Analytics Software Market Trends & Opportunities
The Life Science Analytics Software Market is experiencing rapid expansion driven by several key factors. The increasing volume and complexity of life science data, coupled with the rising adoption of cloud-based solutions, are propelling market growth. Technological advancements, including the integration of AI and machine learning algorithms, enable more sophisticated data analysis, leading to improved drug discovery, personalized medicine, and enhanced operational efficiency. Consumer preferences are shifting towards data-driven decision-making, driving demand for advanced analytics tools. Intense competitive pressure is pushing innovation and price optimization, which ultimately benefits customers. Market penetration rates for advanced analytics solutions remain relatively low, representing significant untapped potential for future growth. The market is projected to experience substantial growth, driven by the rising adoption of cloud-based platforms, increasing demand for personalized medicine, and the emergence of new technologies such as AI and machine learning. The CAGR for the forecast period (2025-2033) is estimated at xx%.
Dominant Markets & Segments in Life Science Analytics Software Market
North America currently holds the largest market share, driven by high adoption rates and the presence of major pharmaceutical and biotechnology companies. Within the segment breakdown:
Product Type: Predictive analytics is the fastest-growing segment, driven by its ability to provide actionable insights for drug discovery and clinical trials.
Application: Research and Development is the dominant application area, owing to the significant potential of analytics to accelerate drug development processes. Supply Chain Analytics and Sales & Marketing are also rapidly expanding segments.
Component: Software constitutes the largest segment, reflecting the growing demand for advanced analytics platforms.
End User: Pharmaceutical and Biotechnology Companies are the largest end users of Life Science Analytics software, followed by Clinical Research Institutions.
Key Growth Drivers (varies by segment):
- Strong R&D Investments: Pharmaceutical companies invest heavily in research, creating a demand for analytical solutions to expedite drug discovery.
- Regulatory Compliance: Stringent regulatory requirements necessitate the use of advanced analytics for data management and compliance.
- Government Initiatives: Many governments promote the adoption of data-driven approaches to healthcare.
- Technological Advancements: Advances in AI, machine learning, and big data analytics are constantly improving the capabilities of these software solutions.
Detailed regional dominance analysis will be provided in the full report.
Life Science Analytics Software Market Product Analysis
The Life Science Analytics Software market showcases rapid innovation, integrating cutting-edge technologies like AI/ML, cloud computing, and advanced visualization tools to offer tailored solutions for various applications, from clinical trials optimization to supply chain management. These solutions focus on improving efficiency, reducing costs, and driving better decision-making across the lifecycle of drug development and commercialization. Competitive advantages stem from superior algorithms, ease of use, data integration capabilities, and robust security features.
Key Drivers, Barriers & Challenges in Life Science Analytics Software Market
Key Drivers:
- Increasing volumes of complex data generated from various sources.
- Growing demand for data-driven decision-making in drug development and commercialization.
- Rising adoption of cloud-based platforms and advanced analytics solutions.
- Stringent regulatory requirements driving the need for compliant and secure solutions.
Challenges and Restraints:
- High cost of implementation and maintenance of advanced analytics solutions.
- Data security and privacy concerns impacting data sharing and collaboration.
- Shortage of skilled professionals capable of implementing and interpreting complex analytics.
- Integration challenges with existing legacy systems in some organizations.
Quantifiable impacts of these challenges will be detailed in the full report.
Growth Drivers in the Life Science Analytics Software Market Market
The market's rapid growth is fueled by significant technological advancements, economic incentives for efficiency gains, and supportive regulatory frameworks. AI and machine learning integration are key drivers, alongside increased data generation from genomics and clinical trials. Economic pressures to reduce R&D costs and improve market timeliness further incentivize adoption. Government initiatives supporting data-driven healthcare also contribute significantly.
Challenges Impacting Life Science Analytics Software Market Growth
Challenges include the high cost of software and implementation, the need for specialized expertise, and data security concerns. Regulatory complexities and the integration of new solutions with existing legacy systems also pose barriers to entry and widespread adoption.
Key Players Shaping the Life Science Analytics Software Market Market
- SAS Institute Inc
- SCIOInspire Corp
- Wipro Limited
- Cognizant
- M3 (EU) Ltd
- IBM Corporation
- TAKE Solutions Limited
- Accenture
- IQVIA
- Oracle Corporation
- MaxisIT Inc
- Dynata
Significant Life Science Analytics Software Market Industry Milestones
July 2022: Charles River Associates launched the Healthcare Claims Analytics Platform (HCAP), leveraging machine learning and patient analytics to enhance market understanding and decision-making. This launch signaled a significant step towards more sophisticated data utilization within healthcare analytics.
March 2022: Databricks introduced the Databricks Lakehouse for Healthcare and Life Sciences, providing a unified platform for data management, analytics, and AI applications (disease prediction, image classification, biomarker discovery). This launch consolidated various data functionalities, streamlining operations for life science companies.
Future Outlook for Life Science Analytics Software Market Market
The Life Science Analytics Software Market is poised for continued strong growth, driven by ongoing technological innovation, increasing data volumes, and expanding regulatory requirements. Strategic opportunities lie in developing user-friendly, scalable, and secure solutions that integrate seamlessly with existing systems. The potential for personalized medicine and advanced AI applications offers substantial future growth potential.
Life Science Analytics Software Market Segmentation
-
1. Product Type
- 1.1. Descriptive Analytics
- 1.2. Predictive Analytics
- 1.3. Prescriptive Analytics
-
2. Application
- 2.1. Research and Development
- 2.2. Supply Chain Analytics
- 2.3. Sales and Marketing
- 2.4. Other Applications
-
3. Component
- 3.1. Services
- 3.2. Software
-
4. End User
- 4.1. Clinical Research Institutions
- 4.2. Pharmaceutical and Biotechnology Companies
- 4.3. Medical Device Companies
- 4.4. Other End Users
Life Science Analytics Software Market Segmentation By Geography
-
1. North America
- 1.1. United States
- 1.2. Canada
- 1.3. Mexico
-
2. Europe
- 2.1. Germany
- 2.2. United Kingdom
- 2.3. France
- 2.4. Italy
- 2.5. Spain
- 2.6. Rest of Europe
-
3. Asia Pacific
- 3.1. China
- 3.2. Japan
- 3.3. India
- 3.4. Australia
- 3.5. South Korea
- 3.6. Rest of Asia Pacific
-
4. Middle East and Africa
- 4.1. GCC
- 4.2. South Africa
- 4.3. Rest of Middle East and Africa
-
5. South America
- 5.1. Brazil
- 5.2. Argentina
- 5.3. Rest of South America
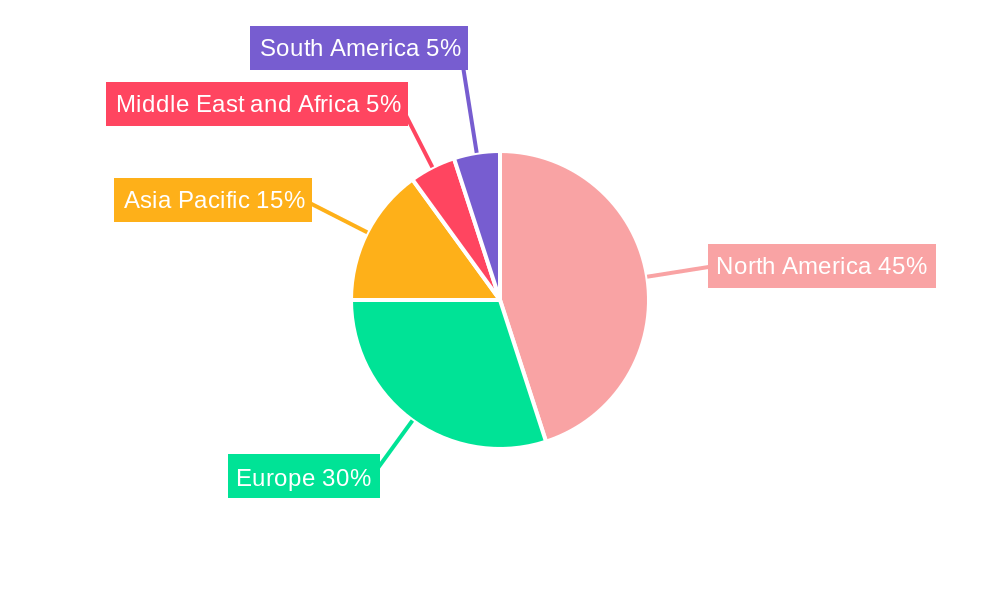
Life Science Analytics Software Market Regional Market Share
Geographic Coverage of Life Science Analytics Software Market
Life Science Analytics Software Market REPORT HIGHLIGHTS
| Aspects | Details |
|---|---|
| Study Period | 2020-2034 |
| Base Year | 2025 |
| Estimated Year | 2026 |
| Forecast Period | 2026-2034 |
| Historical Period | 2020-2025 |
| Growth Rate | CAGR of 7.71% from 2020-2034 |
| Segmentation |
|
Table of Contents
- 1. Introduction
- 1.1. Research Scope
- 1.2. Market Segmentation
- 1.3. Research Objective
- 1.4. Definitions and Assumptions
- 2. Executive Summary
- 2.1. Market Snapshot
- 3. Market Dynamics
- 3.1. Market Drivers
- 3.2. Market Restrains
- 3.3. Market Trends
- 3.4. Market Opportunities
- 4. Market Factor Analysis
- 4.1. Porters Five Forces
- 4.1.1. Bargaining Power of Suppliers
- 4.1.2. Bargaining Power of Buyers
- 4.1.3. Threat of New Entrants
- 4.1.4. Threat of Substitutes
- 4.1.5. Competitive Rivalry
- 4.2. PESTEL analysis
- 4.3. BCG Analysis
- 4.3.1. Stars (High Growth, High Market Share)
- 4.3.2. Cash Cows (Low Growth, High Market Share)
- 4.3.3. Question Mark (High Growth, Low Market Share)
- 4.3.4. Dogs (Low Growth, Low Market Share)
- 4.4. Ansoff Matrix Analysis
- 4.5. Supply Chain Analysis
- 4.6. Regulatory Landscape
- 4.7. Current Market Potential and Opportunity Assessment (TAM–SAM–SOM Framework)
- 4.8. TIR Analyst Note
- 4.1. Porters Five Forces
- 5. Market Analysis, Insights and Forecast 2021-2033
- 5.1. Market Analysis, Insights and Forecast - by Product Type
- 5.1.1. Descriptive Analytics
- 5.1.2. Predictive Analytics
- 5.1.3. Prescriptive Analytics
- 5.2. Market Analysis, Insights and Forecast - by Application
- 5.2.1. Research and Development
- 5.2.2. Supply Chain Analytics
- 5.2.3. Sales and Marketing
- 5.2.4. Other Applications
- 5.3. Market Analysis, Insights and Forecast - by Component
- 5.3.1. Services
- 5.3.2. Software
- 5.4. Market Analysis, Insights and Forecast - by End User
- 5.4.1. Clinical Research Institutions
- 5.4.2. Pharmaceutical and Biotechnology Companies
- 5.4.3. Medical Device Companies
- 5.4.4. Other End Users
- 5.5. Market Analysis, Insights and Forecast - by Region
- 5.5.1. North America
- 5.5.2. Europe
- 5.5.3. Asia Pacific
- 5.5.4. Middle East and Africa
- 5.5.5. South America
- 5.1. Market Analysis, Insights and Forecast - by Product Type
- 6. Global Life Science Analytics Software Market Analysis, Insights and Forecast, 2021-2033
- 6.1. Market Analysis, Insights and Forecast - by Product Type
- 6.1.1. Descriptive Analytics
- 6.1.2. Predictive Analytics
- 6.1.3. Prescriptive Analytics
- 6.2. Market Analysis, Insights and Forecast - by Application
- 6.2.1. Research and Development
- 6.2.2. Supply Chain Analytics
- 6.2.3. Sales and Marketing
- 6.2.4. Other Applications
- 6.3. Market Analysis, Insights and Forecast - by Component
- 6.3.1. Services
- 6.3.2. Software
- 6.4. Market Analysis, Insights and Forecast - by End User
- 6.4.1. Clinical Research Institutions
- 6.4.2. Pharmaceutical and Biotechnology Companies
- 6.4.3. Medical Device Companies
- 6.4.4. Other End Users
- 6.1. Market Analysis, Insights and Forecast - by Product Type
- 7. North America Life Science Analytics Software Market Analysis, Insights and Forecast, 2020-2032
- 7.1. Market Analysis, Insights and Forecast - by Product Type
- 7.1.1. Descriptive Analytics
- 7.1.2. Predictive Analytics
- 7.1.3. Prescriptive Analytics
- 7.2. Market Analysis, Insights and Forecast - by Application
- 7.2.1. Research and Development
- 7.2.2. Supply Chain Analytics
- 7.2.3. Sales and Marketing
- 7.2.4. Other Applications
- 7.3. Market Analysis, Insights and Forecast - by Component
- 7.3.1. Services
- 7.3.2. Software
- 7.4. Market Analysis, Insights and Forecast - by End User
- 7.4.1. Clinical Research Institutions
- 7.4.2. Pharmaceutical and Biotechnology Companies
- 7.4.3. Medical Device Companies
- 7.4.4. Other End Users
- 7.1. Market Analysis, Insights and Forecast - by Product Type
- 8. Europe Life Science Analytics Software Market Analysis, Insights and Forecast, 2020-2032
- 8.1. Market Analysis, Insights and Forecast - by Product Type
- 8.1.1. Descriptive Analytics
- 8.1.2. Predictive Analytics
- 8.1.3. Prescriptive Analytics
- 8.2. Market Analysis, Insights and Forecast - by Application
- 8.2.1. Research and Development
- 8.2.2. Supply Chain Analytics
- 8.2.3. Sales and Marketing
- 8.2.4. Other Applications
- 8.3. Market Analysis, Insights and Forecast - by Component
- 8.3.1. Services
- 8.3.2. Software
- 8.4. Market Analysis, Insights and Forecast - by End User
- 8.4.1. Clinical Research Institutions
- 8.4.2. Pharmaceutical and Biotechnology Companies
- 8.4.3. Medical Device Companies
- 8.4.4. Other End Users
- 8.1. Market Analysis, Insights and Forecast - by Product Type
- 9. Asia Pacific Life Science Analytics Software Market Analysis, Insights and Forecast, 2020-2032
- 9.1. Market Analysis, Insights and Forecast - by Product Type
- 9.1.1. Descriptive Analytics
- 9.1.2. Predictive Analytics
- 9.1.3. Prescriptive Analytics
- 9.2. Market Analysis, Insights and Forecast - by Application
- 9.2.1. Research and Development
- 9.2.2. Supply Chain Analytics
- 9.2.3. Sales and Marketing
- 9.2.4. Other Applications
- 9.3. Market Analysis, Insights and Forecast - by Component
- 9.3.1. Services
- 9.3.2. Software
- 9.4. Market Analysis, Insights and Forecast - by End User
- 9.4.1. Clinical Research Institutions
- 9.4.2. Pharmaceutical and Biotechnology Companies
- 9.4.3. Medical Device Companies
- 9.4.4. Other End Users
- 9.1. Market Analysis, Insights and Forecast - by Product Type
- 10. Middle East and Africa Life Science Analytics Software Market Analysis, Insights and Forecast, 2020-2032
- 10.1. Market Analysis, Insights and Forecast - by Product Type
- 10.1.1. Descriptive Analytics
- 10.1.2. Predictive Analytics
- 10.1.3. Prescriptive Analytics
- 10.2. Market Analysis, Insights and Forecast - by Application
- 10.2.1. Research and Development
- 10.2.2. Supply Chain Analytics
- 10.2.3. Sales and Marketing
- 10.2.4. Other Applications
- 10.3. Market Analysis, Insights and Forecast - by Component
- 10.3.1. Services
- 10.3.2. Software
- 10.4. Market Analysis, Insights and Forecast - by End User
- 10.4.1. Clinical Research Institutions
- 10.4.2. Pharmaceutical and Biotechnology Companies
- 10.4.3. Medical Device Companies
- 10.4.4. Other End Users
- 10.1. Market Analysis, Insights and Forecast - by Product Type
- 11. South America Life Science Analytics Software Market Analysis, Insights and Forecast, 2020-2032
- 11.1. Market Analysis, Insights and Forecast - by Product Type
- 11.1.1. Descriptive Analytics
- 11.1.2. Predictive Analytics
- 11.1.3. Prescriptive Analytics
- 11.2. Market Analysis, Insights and Forecast - by Application
- 11.2.1. Research and Development
- 11.2.2. Supply Chain Analytics
- 11.2.3. Sales and Marketing
- 11.2.4. Other Applications
- 11.3. Market Analysis, Insights and Forecast - by Component
- 11.3.1. Services
- 11.3.2. Software
- 11.4. Market Analysis, Insights and Forecast - by End User
- 11.4.1. Clinical Research Institutions
- 11.4.2. Pharmaceutical and Biotechnology Companies
- 11.4.3. Medical Device Companies
- 11.4.4. Other End Users
- 11.1. Market Analysis, Insights and Forecast - by Product Type
- 12. Competitive Analysis
- 12.1. Company Profiles
- 12.1.1 SAS Institute Inc
- 12.1.1.1. Company Overview
- 12.1.1.2. Products
- 12.1.1.3. Company Financials
- 12.1.1.4. SWOT Analysis
- 12.1.2 SCIOInspire Corp
- 12.1.2.1. Company Overview
- 12.1.2.2. Products
- 12.1.2.3. Company Financials
- 12.1.2.4. SWOT Analysis
- 12.1.3 Wipro Limited
- 12.1.3.1. Company Overview
- 12.1.3.2. Products
- 12.1.3.3. Company Financials
- 12.1.3.4. SWOT Analysis
- 12.1.4 Cognizant
- 12.1.4.1. Company Overview
- 12.1.4.2. Products
- 12.1.4.3. Company Financials
- 12.1.4.4. SWOT Analysis
- 12.1.5 M3 (EU) Ltd*List Not Exhaustive
- 12.1.5.1. Company Overview
- 12.1.5.2. Products
- 12.1.5.3. Company Financials
- 12.1.5.4. SWOT Analysis
- 12.1.6 IBM Corporation
- 12.1.6.1. Company Overview
- 12.1.6.2. Products
- 12.1.6.3. Company Financials
- 12.1.6.4. SWOT Analysis
- 12.1.7 TAKE Solutions Limited
- 12.1.7.1. Company Overview
- 12.1.7.2. Products
- 12.1.7.3. Company Financials
- 12.1.7.4. SWOT Analysis
- 12.1.8 Accenture
- 12.1.8.1. Company Overview
- 12.1.8.2. Products
- 12.1.8.3. Company Financials
- 12.1.8.4. SWOT Analysis
- 12.1.9 IQVIA
- 12.1.9.1. Company Overview
- 12.1.9.2. Products
- 12.1.9.3. Company Financials
- 12.1.9.4. SWOT Analysis
- 12.1.10 Oracle Corporation
- 12.1.10.1. Company Overview
- 12.1.10.2. Products
- 12.1.10.3. Company Financials
- 12.1.10.4. SWOT Analysis
- 12.1.11 MaxisIT Inc
- 12.1.11.1. Company Overview
- 12.1.11.2. Products
- 12.1.11.3. Company Financials
- 12.1.11.4. SWOT Analysis
- 12.1.12 Dynata
- 12.1.12.1. Company Overview
- 12.1.12.2. Products
- 12.1.12.3. Company Financials
- 12.1.12.4. SWOT Analysis
- 12.1.1 SAS Institute Inc
- 12.2. Market Entropy
- 12.2.1 Company's Key Areas Served
- 12.2.2 Recent Developments
- 12.3. Company Market Share Analysis 2025
- 12.3.1 Top 5 Companies Market Share Analysis
- 12.3.2 Top 3 Companies Market Share Analysis
- 12.4. List of Potential Customers
- 13. Research Methodology
List of Figures
- Figure 1: Global Life Science Analytics Software Market Revenue Breakdown (Million, %) by Region 2025 & 2033
- Figure 2: North America Life Science Analytics Software Market Revenue (Million), by Product Type 2025 & 2033
- Figure 3: North America Life Science Analytics Software Market Revenue Share (%), by Product Type 2025 & 2033
- Figure 4: North America Life Science Analytics Software Market Revenue (Million), by Application 2025 & 2033
- Figure 5: North America Life Science Analytics Software Market Revenue Share (%), by Application 2025 & 2033
- Figure 6: North America Life Science Analytics Software Market Revenue (Million), by Component 2025 & 2033
- Figure 7: North America Life Science Analytics Software Market Revenue Share (%), by Component 2025 & 2033
- Figure 8: North America Life Science Analytics Software Market Revenue (Million), by End User 2025 & 2033
- Figure 9: North America Life Science Analytics Software Market Revenue Share (%), by End User 2025 & 2033
- Figure 10: North America Life Science Analytics Software Market Revenue (Million), by Country 2025 & 2033
- Figure 11: North America Life Science Analytics Software Market Revenue Share (%), by Country 2025 & 2033
- Figure 12: Europe Life Science Analytics Software Market Revenue (Million), by Product Type 2025 & 2033
- Figure 13: Europe Life Science Analytics Software Market Revenue Share (%), by Product Type 2025 & 2033
- Figure 14: Europe Life Science Analytics Software Market Revenue (Million), by Application 2025 & 2033
- Figure 15: Europe Life Science Analytics Software Market Revenue Share (%), by Application 2025 & 2033
- Figure 16: Europe Life Science Analytics Software Market Revenue (Million), by Component 2025 & 2033
- Figure 17: Europe Life Science Analytics Software Market Revenue Share (%), by Component 2025 & 2033
- Figure 18: Europe Life Science Analytics Software Market Revenue (Million), by End User 2025 & 2033
- Figure 19: Europe Life Science Analytics Software Market Revenue Share (%), by End User 2025 & 2033
- Figure 20: Europe Life Science Analytics Software Market Revenue (Million), by Country 2025 & 2033
- Figure 21: Europe Life Science Analytics Software Market Revenue Share (%), by Country 2025 & 2033
- Figure 22: Asia Pacific Life Science Analytics Software Market Revenue (Million), by Product Type 2025 & 2033
- Figure 23: Asia Pacific Life Science Analytics Software Market Revenue Share (%), by Product Type 2025 & 2033
- Figure 24: Asia Pacific Life Science Analytics Software Market Revenue (Million), by Application 2025 & 2033
- Figure 25: Asia Pacific Life Science Analytics Software Market Revenue Share (%), by Application 2025 & 2033
- Figure 26: Asia Pacific Life Science Analytics Software Market Revenue (Million), by Component 2025 & 2033
- Figure 27: Asia Pacific Life Science Analytics Software Market Revenue Share (%), by Component 2025 & 2033
- Figure 28: Asia Pacific Life Science Analytics Software Market Revenue (Million), by End User 2025 & 2033
- Figure 29: Asia Pacific Life Science Analytics Software Market Revenue Share (%), by End User 2025 & 2033
- Figure 30: Asia Pacific Life Science Analytics Software Market Revenue (Million), by Country 2025 & 2033
- Figure 31: Asia Pacific Life Science Analytics Software Market Revenue Share (%), by Country 2025 & 2033
- Figure 32: Middle East and Africa Life Science Analytics Software Market Revenue (Million), by Product Type 2025 & 2033
- Figure 33: Middle East and Africa Life Science Analytics Software Market Revenue Share (%), by Product Type 2025 & 2033
- Figure 34: Middle East and Africa Life Science Analytics Software Market Revenue (Million), by Application 2025 & 2033
- Figure 35: Middle East and Africa Life Science Analytics Software Market Revenue Share (%), by Application 2025 & 2033
- Figure 36: Middle East and Africa Life Science Analytics Software Market Revenue (Million), by Component 2025 & 2033
- Figure 37: Middle East and Africa Life Science Analytics Software Market Revenue Share (%), by Component 2025 & 2033
- Figure 38: Middle East and Africa Life Science Analytics Software Market Revenue (Million), by End User 2025 & 2033
- Figure 39: Middle East and Africa Life Science Analytics Software Market Revenue Share (%), by End User 2025 & 2033
- Figure 40: Middle East and Africa Life Science Analytics Software Market Revenue (Million), by Country 2025 & 2033
- Figure 41: Middle East and Africa Life Science Analytics Software Market Revenue Share (%), by Country 2025 & 2033
- Figure 42: South America Life Science Analytics Software Market Revenue (Million), by Product Type 2025 & 2033
- Figure 43: South America Life Science Analytics Software Market Revenue Share (%), by Product Type 2025 & 2033
- Figure 44: South America Life Science Analytics Software Market Revenue (Million), by Application 2025 & 2033
- Figure 45: South America Life Science Analytics Software Market Revenue Share (%), by Application 2025 & 2033
- Figure 46: South America Life Science Analytics Software Market Revenue (Million), by Component 2025 & 2033
- Figure 47: South America Life Science Analytics Software Market Revenue Share (%), by Component 2025 & 2033
- Figure 48: South America Life Science Analytics Software Market Revenue (Million), by End User 2025 & 2033
- Figure 49: South America Life Science Analytics Software Market Revenue Share (%), by End User 2025 & 2033
- Figure 50: South America Life Science Analytics Software Market Revenue (Million), by Country 2025 & 2033
- Figure 51: South America Life Science Analytics Software Market Revenue Share (%), by Country 2025 & 2033
List of Tables
- Table 1: Global Life Science Analytics Software Market Revenue Million Forecast, by Product Type 2020 & 2033
- Table 2: Global Life Science Analytics Software Market Revenue Million Forecast, by Application 2020 & 2033
- Table 3: Global Life Science Analytics Software Market Revenue Million Forecast, by Component 2020 & 2033
- Table 4: Global Life Science Analytics Software Market Revenue Million Forecast, by End User 2020 & 2033
- Table 5: Global Life Science Analytics Software Market Revenue Million Forecast, by Region 2020 & 2033
- Table 6: Global Life Science Analytics Software Market Revenue Million Forecast, by Product Type 2020 & 2033
- Table 7: Global Life Science Analytics Software Market Revenue Million Forecast, by Application 2020 & 2033
- Table 8: Global Life Science Analytics Software Market Revenue Million Forecast, by Component 2020 & 2033
- Table 9: Global Life Science Analytics Software Market Revenue Million Forecast, by End User 2020 & 2033
- Table 10: Global Life Science Analytics Software Market Revenue Million Forecast, by Country 2020 & 2033
- Table 11: United States Life Science Analytics Software Market Revenue (Million) Forecast, by Application 2020 & 2033
- Table 12: Canada Life Science Analytics Software Market Revenue (Million) Forecast, by Application 2020 & 2033
- Table 13: Mexico Life Science Analytics Software Market Revenue (Million) Forecast, by Application 2020 & 2033
- Table 14: Global Life Science Analytics Software Market Revenue Million Forecast, by Product Type 2020 & 2033
- Table 15: Global Life Science Analytics Software Market Revenue Million Forecast, by Application 2020 & 2033
- Table 16: Global Life Science Analytics Software Market Revenue Million Forecast, by Component 2020 & 2033
- Table 17: Global Life Science Analytics Software Market Revenue Million Forecast, by End User 2020 & 2033
- Table 18: Global Life Science Analytics Software Market Revenue Million Forecast, by Country 2020 & 2033
- Table 19: Germany Life Science Analytics Software Market Revenue (Million) Forecast, by Application 2020 & 2033
- Table 20: United Kingdom Life Science Analytics Software Market Revenue (Million) Forecast, by Application 2020 & 2033
- Table 21: France Life Science Analytics Software Market Revenue (Million) Forecast, by Application 2020 & 2033
- Table 22: Italy Life Science Analytics Software Market Revenue (Million) Forecast, by Application 2020 & 2033
- Table 23: Spain Life Science Analytics Software Market Revenue (Million) Forecast, by Application 2020 & 2033
- Table 24: Rest of Europe Life Science Analytics Software Market Revenue (Million) Forecast, by Application 2020 & 2033
- Table 25: Global Life Science Analytics Software Market Revenue Million Forecast, by Product Type 2020 & 2033
- Table 26: Global Life Science Analytics Software Market Revenue Million Forecast, by Application 2020 & 2033
- Table 27: Global Life Science Analytics Software Market Revenue Million Forecast, by Component 2020 & 2033
- Table 28: Global Life Science Analytics Software Market Revenue Million Forecast, by End User 2020 & 2033
- Table 29: Global Life Science Analytics Software Market Revenue Million Forecast, by Country 2020 & 2033
- Table 30: China Life Science Analytics Software Market Revenue (Million) Forecast, by Application 2020 & 2033
- Table 31: Japan Life Science Analytics Software Market Revenue (Million) Forecast, by Application 2020 & 2033
- Table 32: India Life Science Analytics Software Market Revenue (Million) Forecast, by Application 2020 & 2033
- Table 33: Australia Life Science Analytics Software Market Revenue (Million) Forecast, by Application 2020 & 2033
- Table 34: South Korea Life Science Analytics Software Market Revenue (Million) Forecast, by Application 2020 & 2033
- Table 35: Rest of Asia Pacific Life Science Analytics Software Market Revenue (Million) Forecast, by Application 2020 & 2033
- Table 36: Global Life Science Analytics Software Market Revenue Million Forecast, by Product Type 2020 & 2033
- Table 37: Global Life Science Analytics Software Market Revenue Million Forecast, by Application 2020 & 2033
- Table 38: Global Life Science Analytics Software Market Revenue Million Forecast, by Component 2020 & 2033
- Table 39: Global Life Science Analytics Software Market Revenue Million Forecast, by End User 2020 & 2033
- Table 40: Global Life Science Analytics Software Market Revenue Million Forecast, by Country 2020 & 2033
- Table 41: GCC Life Science Analytics Software Market Revenue (Million) Forecast, by Application 2020 & 2033
- Table 42: South Africa Life Science Analytics Software Market Revenue (Million) Forecast, by Application 2020 & 2033
- Table 43: Rest of Middle East and Africa Life Science Analytics Software Market Revenue (Million) Forecast, by Application 2020 & 2033
- Table 44: Global Life Science Analytics Software Market Revenue Million Forecast, by Product Type 2020 & 2033
- Table 45: Global Life Science Analytics Software Market Revenue Million Forecast, by Application 2020 & 2033
- Table 46: Global Life Science Analytics Software Market Revenue Million Forecast, by Component 2020 & 2033
- Table 47: Global Life Science Analytics Software Market Revenue Million Forecast, by End User 2020 & 2033
- Table 48: Global Life Science Analytics Software Market Revenue Million Forecast, by Country 2020 & 2033
- Table 49: Brazil Life Science Analytics Software Market Revenue (Million) Forecast, by Application 2020 & 2033
- Table 50: Argentina Life Science Analytics Software Market Revenue (Million) Forecast, by Application 2020 & 2033
- Table 51: Rest of South America Life Science Analytics Software Market Revenue (Million) Forecast, by Application 2020 & 2033
Frequently Asked Questions
1. What is the projected Compound Annual Growth Rate (CAGR) of the Life Science Analytics Software Market?
The projected CAGR is approximately 7.71%.
2. Which companies are prominent players in the Life Science Analytics Software Market?
Key companies in the market include SAS Institute Inc, SCIOInspire Corp, Wipro Limited, Cognizant, M3 (EU) Ltd*List Not Exhaustive, IBM Corporation, TAKE Solutions Limited, Accenture, IQVIA, Oracle Corporation, MaxisIT Inc, Dynata.
3. What are the main segments of the Life Science Analytics Software Market?
The market segments include Product Type, Application, Component, End User.
4. Can you provide details about the market size?
The market size is estimated to be USD 11.06 Million as of 2022.
5. What are some drivers contributing to market growth?
Rising Adoption of Analytics Solutions in Pharmaceuticals and Clinical Trials; Growing Pressure to Reduce Healthcare Spending and the Need for Improved Patient Outcomes; Emergence of Advanced Analytics Method in Life Science Companies.
6. What are the notable trends driving market growth?
Pharmaceutical and Biotechnology Companies are Expected to Witness the Rapid Growth in Coming Years.
7. Are there any restraints impacting market growth?
Lack of Skilled Personnel; High Implementation Costs.
8. Can you provide examples of recent developments in the market?
July 2022: Charles River Associates launched the company's new data analytics suite, the Healthcare Claims Analytics Platform (HCAP), at the World Orphan Drug Congress USA 2022 in Boston. HCAP delivers the power of machine learning and patient analytics to inform about market understanding and support intelligent decision-making.
9. What pricing options are available for accessing the report?
Pricing options include single-user, multi-user, and enterprise licenses priced at USD 4750, USD 5250, and USD 8750 respectively.
10. Is the market size provided in terms of value or volume?
The market size is provided in terms of value, measured in Million.
11. Are there any specific market keywords associated with the report?
Yes, the market keyword associated with the report is "Life Science Analytics Software Market," which aids in identifying and referencing the specific market segment covered.
12. How do I determine which pricing option suits my needs best?
The pricing options vary based on user requirements and access needs. Individual users may opt for single-user licenses, while businesses requiring broader access may choose multi-user or enterprise licenses for cost-effective access to the report.
13. Are there any additional resources or data provided in the Life Science Analytics Software Market report?
While the report offers comprehensive insights, it's advisable to review the specific contents or supplementary materials provided to ascertain if additional resources or data are available.
14. How can I stay updated on further developments or reports in the Life Science Analytics Software Market?
To stay informed about further developments, trends, and reports in the Life Science Analytics Software Market, consider subscribing to industry newsletters, following relevant companies and organizations, or regularly checking reputable industry news sources and publications.
Methodology
Step 1 - Identification of Relevant Samples Size from Population Database


Step 2 - Approaches for Defining Global Market Size (Value, Volume* & Price*)

Note*: In applicable scenarios
Step 3 - Data Sources
Primary Research
- Web Analytics
- Survey Reports
- Research Institute
- Latest Research Reports
- Opinion Leaders
Secondary Research
- Annual Reports
- White Paper
- Latest Press Release
- Industry Association
- Paid Database
- Investor Presentations

Step 4 - Data Triangulation
Involves using different sources of information in order to increase the validity of a study
These sources are likely to be stakeholders in a program - participants, other researchers, program staff, other community members, and so on.
Then we put all data in single framework & apply various statistical tools to find out the dynamic on the market.
During the analysis stage, feedback from the stakeholder groups would be compared to determine areas of agreement as well as areas of divergence