

Key Insights
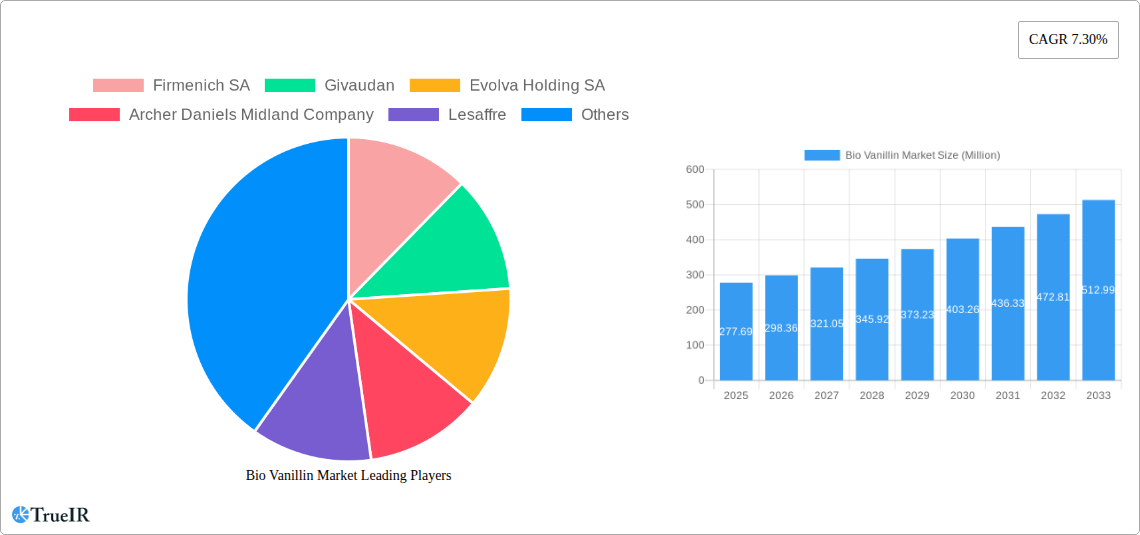
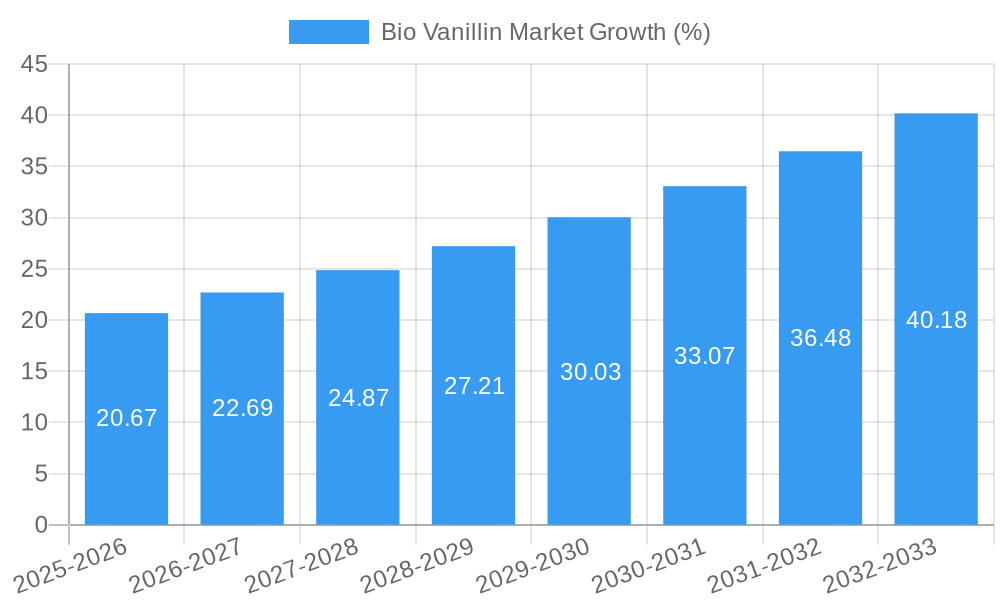
The global bio vanillin market, valued at $277.69 million in 2025, is projected to experience robust growth, driven by increasing demand from the food and beverage, pharmaceutical, and fragrance industries. A compound annual growth rate (CAGR) of 7.30% from 2025 to 2033 indicates a significant expansion of this market. The rising consumer preference for natural and clean-label products fuels the adoption of bio-based vanillin as a sustainable alternative to synthetic vanillin. Furthermore, the growing awareness of the potential health benefits associated with natural ingredients is contributing to market expansion. Specific application segments like food and beverage, benefiting from the clean-label trend, are expected to witness the highest growth rates. The pharmaceutical industry's increasing use of vanillin in drug formulations is also a significant driver. However, the market faces certain challenges, including the relatively high cost of production compared to synthetic vanillin and the need for further technological advancements to enhance efficiency and reduce production costs. Despite these constraints, the long-term outlook remains positive, with continuous innovation and the ongoing demand for natural ingredients propelling market growth in the coming years. Major players, including Firmenich SA, Givaudan, and Evolva Holding SA, are actively investing in research and development to improve bio-based vanillin production processes and expand their market share. Geographic expansion, especially in emerging economies like those in Asia-Pacific, with growing consumer spending and a rising middle class, presents promising growth opportunities. This combination of market drivers and increasing investments suggests a significant and sustainable expansion of the bio vanillin market during the forecast period.
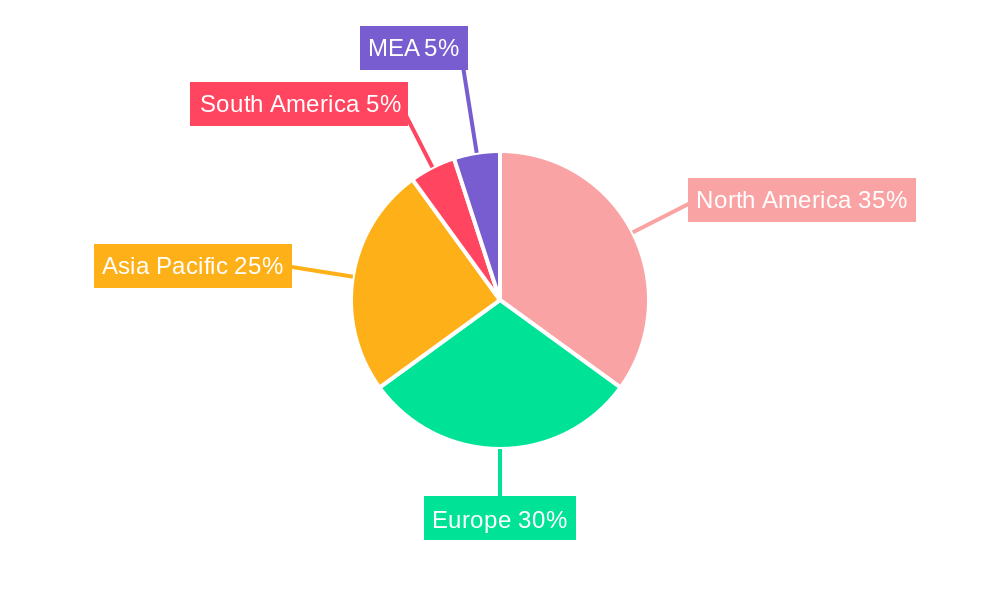
The regional distribution shows a strong presence in North America and Europe, driven by established industries and stringent regulatory frameworks favoring natural ingredients. However, the Asia-Pacific region is poised for significant growth, fueled by expanding food and beverage sectors, and increasing consumer spending on premium products. This represents a substantial opportunity for bio vanillin manufacturers seeking to tap into these developing markets. The market's growth trajectory will be shaped by the continued development of cost-effective and scalable bio-production techniques, coupled with regulatory support for sustainable and environmentally friendly ingredients.
Bio Vanillin Market: A Comprehensive Report (2019-2033)
This dynamic report provides a comprehensive analysis of the Bio Vanillin Market, offering invaluable insights for stakeholders seeking to navigate this rapidly evolving landscape. Leveraging extensive market research and data analysis covering the period 2019-2033 (base year 2025, forecast period 2025-2033), this report delivers crucial information on market size, growth trajectories, key players, and future trends. The report is meticulously structured to provide clear, actionable insights, ensuring ease of understanding and application for both industry veterans and newcomers.
Bio Vanillin Market Market Structure & Competitive Landscape
The Bio Vanillin market exhibits a moderately concentrated structure, with several key players holding significant market share. Firmenich SA, Givaudan, and Evolva Holding SA are prominent examples. The market's competitive landscape is dynamic, driven by continuous innovation in extraction techniques, fermentation processes, and product formulation. Regulatory frameworks concerning food safety and labeling significantly influence market operations. The presence of synthetic vanillin as a substitute poses a challenge, yet the growing demand for natural and clean-label ingredients fuels market growth.
Key Aspects Analyzed:
- Market Concentration: The Herfindahl-Hirschman Index (HHI) for the Bio Vanillin market in 2025 is estimated at xx, indicating a moderately concentrated market.
- Innovation Drivers: R&D investments in bio-based extraction and fermentation technologies drive innovation.
- Regulatory Impacts: Stringent food safety regulations and labeling requirements influence market dynamics.
- Product Substitutes: Synthetic vanillin remains a competitive substitute, influencing pricing and demand.
- End-User Segmentation: The market is segmented by application (Food & Beverage, Pharmaceutical, Fragrance), with distinct growth trends in each segment.
- M&A Trends: Over the period 2019-2024, xx M&A deals were recorded in the Bio Vanillin market, signaling consolidation and expansion strategies amongst major players. This trend is expected to continue.
Bio Vanillin Market Market Trends & Opportunities
The global Bio Vanillin market is experiencing robust growth, driven by the increasing preference for natural ingredients in food and beverage products, as well as the expansion of the pharmaceutical and fragrance industries. The market size is projected to reach xx Million by 2033, exhibiting a CAGR of xx% during the forecast period. Technological advancements in fermentation and bioprocessing are further enhancing the production efficiency and cost-effectiveness of bio-vanillin. Consumer demand for sustainable and ethically sourced ingredients is also bolstering market growth. However, price competitiveness with synthetic vanillin remains a significant challenge for market expansion. The market penetration rate for bio-vanillin in the food and beverage sector is expected to reach xx% by 2033.
Dominant Markets & Segments in Bio Vanillin Market
The Food & Beverage segment is currently the dominant application for bio-vanillin, capturing the largest market share (xx%). The strong growth in this segment is attributable to rising consumer demand for natural flavors and clean-label products. North America and Europe are leading regional markets, driven by high consumer spending and established food and beverage industries.
Key Growth Drivers:
- Rising consumer preference for natural and clean-label products: This is a major driving force across all application segments.
- Stringent regulations favoring natural ingredients: Several countries have implemented regulations promoting the use of natural flavorings.
- Growing health consciousness: Consumers are increasingly aware of the potential health benefits of natural ingredients over synthetic ones.
Regional Dominance:
North America and Europe hold dominant positions due to factors like strong consumer spending, established food processing industries, and stringent regulations related to food safety and labeling. However, Asia Pacific is showing strong growth potential.
Bio Vanillin Market Product Analysis
The Bio Vanillin market offers a diverse range of products varying in purity, extraction method, and application. Technological advancements in fermentation processes have led to the development of high-quality bio-vanillin with improved flavor profiles and cost-effectiveness. These innovations are improving the market fit by offering competitive alternatives to synthetic vanillin in multiple applications, particularly in the growing clean label segment.
Key Drivers, Barriers & Challenges in Bio Vanillin Market
Key Drivers:
- Growing demand for natural food and beverage ingredients: This trend strongly favors bio-vanillin over synthetic alternatives.
- Advancements in fermentation technology: Improved efficiency and cost reduction in bio-vanillin production.
- Stringent regulations promoting natural flavorings: Governments worldwide are increasingly promoting natural ingredients.
Key Challenges and Restraints:
- High production cost compared to synthetic vanillin: This hinders broader market adoption.
- Supply chain vulnerabilities: Limited production capacity and reliance on specific raw materials.
- Competition from synthetic vanillin: The price advantage of synthetic vanillin remains a significant challenge. This impact is estimated to reduce the market size by xx Million annually.
Growth Drivers in the Bio Vanillin Market Market
The primary growth drivers are the increasing demand for natural flavors and the continuous technological advancements that lower production costs and enhance the quality of bio-vanillin. Favorable regulatory environments further contribute to the market's growth trajectory.
Challenges Impacting Bio Vanillin Market Growth
The key challenges are primarily centered around the comparatively high production cost compared to synthetic vanillin, creating a pricing barrier. Furthermore, fluctuations in raw material prices and the complexities of scaling up production significantly impact market growth.
Key Players Shaping the Bio Vanillin Market Market
- Firmenich SA
- Givaudan
- Evolva Holding SA
- Archer Daniels Midland Company
- Lesaffre
- Advanced Biotech
- AUROCHEMICAL
- Apple Flavor & Fragrance Group Co Ltd
Significant Bio Vanillin Market Industry Milestones
- 2021, Q3: Evolva announced a significant expansion of its bio-vanillin production capacity.
- 2022, Q1: Firmenich launched a new line of bio-vanillin products with enhanced flavor profiles.
- 2023, Q2: A major partnership between Givaudan and a biotech firm was announced for the development of novel bio-vanillin production methods. (Further details are withheld pending full release.)
Future Outlook for Bio Vanillin Market Market
The Bio Vanillin market is poised for continued growth, driven by increasing demand for natural ingredients and ongoing technological advancements that enhance production efficiency and reduce costs. Strategic partnerships and investments in R&D will further shape market dynamics. Opportunities exist in expanding applications beyond food and beverages into niche markets like pharmaceuticals and personal care. The market is expected to experience significant expansion, particularly in developing economies with rising disposable incomes.
Bio Vanillin Market Segmentation
-
1. Application
-
1.1. Food
- 1.1.1. Ice Cream
- 1.1.2. Baked Goods
- 1.1.3. Chocolate
- 1.1.4. Other Foods
- 1.2. Beverage
- 1.3. Pharmaceutical
- 1.4. Fragrance
-
1.1. Food
Bio Vanillin Market Segmentation By Geography
-
1. North America
- 1.1. United States
- 1.2. Canada
- 1.3. Mexico
- 1.4. Rest of North America
-
2. Europe
- 2.1. United Kingdom
- 2.2. Germany
- 2.3. France
- 2.4. Russia
- 2.5. Italy
- 2.6. Rest of Europe
-
3. Asia Pacific
- 3.1. India
- 3.2. China
- 3.3. Japan
- 3.4. Australia
- 3.5. Rest of Asia Pacific
-
4. Rest of the World
- 4.1. South America
- 4.2. Middle East
Bio Vanillin Market REPORT HIGHLIGHTS
| Aspects | Details |
|---|---|
| Study Period | 2019-2033 |
| Base Year | 2024 |
| Estimated Year | 2025 |
| Forecast Period | 2025-2033 |
| Historical Period | 2019-2024 |
| Growth Rate | CAGR of 7.30% from 2019-2033 |
| Segmentation |
|
Table of Contents
- 1. Introduction
- 1.1. Research Scope
- 1.2. Market Segmentation
- 1.3. Research Methodology
- 1.4. Definitions and Assumptions
- 2. Executive Summary
- 2.1. Introduction
- 3. Market Dynamics
- 3.1. Introduction
- 3.2. Market Drivers
- 3.2.1. Surge in Demand for 'Free-from' Food Products; Demand For Convenient And Healthy On-the-go Snacking Options
- 3.3. Market Restrains
- 3.3.1. Health Risk Associated with Certain Ingredients
- 3.4. Market Trends
- 3.4.1. Growing Demand for Bio Vanillin in the Food and Beverage Industry
- 4. Market Factor Analysis
- 4.1. Porters Five Forces
- 4.2. Supply/Value Chain
- 4.3. PESTEL analysis
- 4.4. Market Entropy
- 4.5. Patent/Trademark Analysis
- 5. Global Bio Vanillin Market Analysis, Insights and Forecast, 2019-2031
- 5.1. Market Analysis, Insights and Forecast - by Application
- 5.1.1. Food
- 5.1.1.1. Ice Cream
- 5.1.1.2. Baked Goods
- 5.1.1.3. Chocolate
- 5.1.1.4. Other Foods
- 5.1.2. Beverage
- 5.1.3. Pharmaceutical
- 5.1.4. Fragrance
- 5.1.1. Food
- 5.2. Market Analysis, Insights and Forecast - by Region
- 5.2.1. North America
- 5.2.2. Europe
- 5.2.3. Asia Pacific
- 5.2.4. Rest of the World
- 5.1. Market Analysis, Insights and Forecast - by Application
- 6. North America Bio Vanillin Market Analysis, Insights and Forecast, 2019-2031
- 6.1. Market Analysis, Insights and Forecast - by Application
- 6.1.1. Food
- 6.1.1.1. Ice Cream
- 6.1.1.2. Baked Goods
- 6.1.1.3. Chocolate
- 6.1.1.4. Other Foods
- 6.1.2. Beverage
- 6.1.3. Pharmaceutical
- 6.1.4. Fragrance
- 6.1.1. Food
- 6.1. Market Analysis, Insights and Forecast - by Application
- 7. Europe Bio Vanillin Market Analysis, Insights and Forecast, 2019-2031
- 7.1. Market Analysis, Insights and Forecast - by Application
- 7.1.1. Food
- 7.1.1.1. Ice Cream
- 7.1.1.2. Baked Goods
- 7.1.1.3. Chocolate
- 7.1.1.4. Other Foods
- 7.1.2. Beverage
- 7.1.3. Pharmaceutical
- 7.1.4. Fragrance
- 7.1.1. Food
- 7.1. Market Analysis, Insights and Forecast - by Application
- 8. Asia Pacific Bio Vanillin Market Analysis, Insights and Forecast, 2019-2031
- 8.1. Market Analysis, Insights and Forecast - by Application
- 8.1.1. Food
- 8.1.1.1. Ice Cream
- 8.1.1.2. Baked Goods
- 8.1.1.3. Chocolate
- 8.1.1.4. Other Foods
- 8.1.2. Beverage
- 8.1.3. Pharmaceutical
- 8.1.4. Fragrance
- 8.1.1. Food
- 8.1. Market Analysis, Insights and Forecast - by Application
- 9. Rest of the World Bio Vanillin Market Analysis, Insights and Forecast, 2019-2031
- 9.1. Market Analysis, Insights and Forecast - by Application
- 9.1.1. Food
- 9.1.1.1. Ice Cream
- 9.1.1.2. Baked Goods
- 9.1.1.3. Chocolate
- 9.1.1.4. Other Foods
- 9.1.2. Beverage
- 9.1.3. Pharmaceutical
- 9.1.4. Fragrance
- 9.1.1. Food
- 9.1. Market Analysis, Insights and Forecast - by Application
- 10. North America Bio Vanillin Market Analysis, Insights and Forecast, 2019-2031
- 10.1. Market Analysis, Insights and Forecast - By Country/Sub-region
- 10.1.1 United States
- 10.1.2 Canada
- 10.1.3 Mexico
- 11. Europe Bio Vanillin Market Analysis, Insights and Forecast, 2019-2031
- 11.1. Market Analysis, Insights and Forecast - By Country/Sub-region
- 11.1.1 Germany
- 11.1.2 United Kingdom
- 11.1.3 France
- 11.1.4 Spain
- 11.1.5 Italy
- 11.1.6 Spain
- 11.1.7 Belgium
- 11.1.8 Netherland
- 11.1.9 Nordics
- 11.1.10 Rest of Europe
- 12. Asia Pacific Bio Vanillin Market Analysis, Insights and Forecast, 2019-2031
- 12.1. Market Analysis, Insights and Forecast - By Country/Sub-region
- 12.1.1 China
- 12.1.2 Japan
- 12.1.3 India
- 12.1.4 South Korea
- 12.1.5 Southeast Asia
- 12.1.6 Australia
- 12.1.7 Indonesia
- 12.1.8 Phillipes
- 12.1.9 Singapore
- 12.1.10 Thailandc
- 12.1.11 Rest of Asia Pacific
- 13. South America Bio Vanillin Market Analysis, Insights and Forecast, 2019-2031
- 13.1. Market Analysis, Insights and Forecast - By Country/Sub-region
- 13.1.1 Brazil
- 13.1.2 Argentina
- 13.1.3 Peru
- 13.1.4 Chile
- 13.1.5 Colombia
- 13.1.6 Ecuador
- 13.1.7 Venezuela
- 13.1.8 Rest of South America
- 14. MEA Bio Vanillin Market Analysis, Insights and Forecast, 2019-2031
- 14.1. Market Analysis, Insights and Forecast - By Country/Sub-region
- 14.1.1 United Arab Emirates
- 14.1.2 Saudi Arabia
- 14.1.3 South Africa
- 14.1.4 Rest of Middle East and Africa
- 15. Competitive Analysis
- 15.1. Global Market Share Analysis 2024
- 15.2. Company Profiles
- 15.2.1 Firmenich SA
- 15.2.1.1. Overview
- 15.2.1.2. Products
- 15.2.1.3. SWOT Analysis
- 15.2.1.4. Recent Developments
- 15.2.1.5. Financials (Based on Availability)
- 15.2.2 Givaudan
- 15.2.2.1. Overview
- 15.2.2.2. Products
- 15.2.2.3. SWOT Analysis
- 15.2.2.4. Recent Developments
- 15.2.2.5. Financials (Based on Availability)
- 15.2.3 Evolva Holding SA
- 15.2.3.1. Overview
- 15.2.3.2. Products
- 15.2.3.3. SWOT Analysis
- 15.2.3.4. Recent Developments
- 15.2.3.5. Financials (Based on Availability)
- 15.2.4 Archer Daniels Midland Company
- 15.2.4.1. Overview
- 15.2.4.2. Products
- 15.2.4.3. SWOT Analysis
- 15.2.4.4. Recent Developments
- 15.2.4.5. Financials (Based on Availability)
- 15.2.5 Lesaffre
- 15.2.5.1. Overview
- 15.2.5.2. Products
- 15.2.5.3. SWOT Analysis
- 15.2.5.4. Recent Developments
- 15.2.5.5. Financials (Based on Availability)
- 15.2.6 Advanced Biotech
- 15.2.6.1. Overview
- 15.2.6.2. Products
- 15.2.6.3. SWOT Analysis
- 15.2.6.4. Recent Developments
- 15.2.6.5. Financials (Based on Availability)
- 15.2.7 AUROCHEMICAL
- 15.2.7.1. Overview
- 15.2.7.2. Products
- 15.2.7.3. SWOT Analysis
- 15.2.7.4. Recent Developments
- 15.2.7.5. Financials (Based on Availability)
- 15.2.8 Apple Flavor & Fragrance Group Co Ltd
- 15.2.8.1. Overview
- 15.2.8.2. Products
- 15.2.8.3. SWOT Analysis
- 15.2.8.4. Recent Developments
- 15.2.8.5. Financials (Based on Availability)
- 15.2.1 Firmenich SA
List of Figures
- Figure 1: Global Bio Vanillin Market Revenue Breakdown (Million, %) by Region 2024 & 2032
- Figure 2: Global Bio Vanillin Market Volume Breakdown (K Units, %) by Region 2024 & 2032
- Figure 3: North America Bio Vanillin Market Revenue (Million), by Country 2024 & 2032
- Figure 4: North America Bio Vanillin Market Volume (K Units), by Country 2024 & 2032
- Figure 5: North America Bio Vanillin Market Revenue Share (%), by Country 2024 & 2032
- Figure 6: North America Bio Vanillin Market Volume Share (%), by Country 2024 & 2032
- Figure 7: Europe Bio Vanillin Market Revenue (Million), by Country 2024 & 2032
- Figure 8: Europe Bio Vanillin Market Volume (K Units), by Country 2024 & 2032
- Figure 9: Europe Bio Vanillin Market Revenue Share (%), by Country 2024 & 2032
- Figure 10: Europe Bio Vanillin Market Volume Share (%), by Country 2024 & 2032
- Figure 11: Asia Pacific Bio Vanillin Market Revenue (Million), by Country 2024 & 2032
- Figure 12: Asia Pacific Bio Vanillin Market Volume (K Units), by Country 2024 & 2032
- Figure 13: Asia Pacific Bio Vanillin Market Revenue Share (%), by Country 2024 & 2032
- Figure 14: Asia Pacific Bio Vanillin Market Volume Share (%), by Country 2024 & 2032
- Figure 15: South America Bio Vanillin Market Revenue (Million), by Country 2024 & 2032
- Figure 16: South America Bio Vanillin Market Volume (K Units), by Country 2024 & 2032
- Figure 17: South America Bio Vanillin Market Revenue Share (%), by Country 2024 & 2032
- Figure 18: South America Bio Vanillin Market Volume Share (%), by Country 2024 & 2032
- Figure 19: MEA Bio Vanillin Market Revenue (Million), by Country 2024 & 2032
- Figure 20: MEA Bio Vanillin Market Volume (K Units), by Country 2024 & 2032
- Figure 21: MEA Bio Vanillin Market Revenue Share (%), by Country 2024 & 2032
- Figure 22: MEA Bio Vanillin Market Volume Share (%), by Country 2024 & 2032
- Figure 23: North America Bio Vanillin Market Revenue (Million), by Application 2024 & 2032
- Figure 24: North America Bio Vanillin Market Volume (K Units), by Application 2024 & 2032
- Figure 25: North America Bio Vanillin Market Revenue Share (%), by Application 2024 & 2032
- Figure 26: North America Bio Vanillin Market Volume Share (%), by Application 2024 & 2032
- Figure 27: North America Bio Vanillin Market Revenue (Million), by Country 2024 & 2032
- Figure 28: North America Bio Vanillin Market Volume (K Units), by Country 2024 & 2032
- Figure 29: North America Bio Vanillin Market Revenue Share (%), by Country 2024 & 2032
- Figure 30: North America Bio Vanillin Market Volume Share (%), by Country 2024 & 2032
- Figure 31: Europe Bio Vanillin Market Revenue (Million), by Application 2024 & 2032
- Figure 32: Europe Bio Vanillin Market Volume (K Units), by Application 2024 & 2032
- Figure 33: Europe Bio Vanillin Market Revenue Share (%), by Application 2024 & 2032
- Figure 34: Europe Bio Vanillin Market Volume Share (%), by Application 2024 & 2032
- Figure 35: Europe Bio Vanillin Market Revenue (Million), by Country 2024 & 2032
- Figure 36: Europe Bio Vanillin Market Volume (K Units), by Country 2024 & 2032
- Figure 37: Europe Bio Vanillin Market Revenue Share (%), by Country 2024 & 2032
- Figure 38: Europe Bio Vanillin Market Volume Share (%), by Country 2024 & 2032
- Figure 39: Asia Pacific Bio Vanillin Market Revenue (Million), by Application 2024 & 2032
- Figure 40: Asia Pacific Bio Vanillin Market Volume (K Units), by Application 2024 & 2032
- Figure 41: Asia Pacific Bio Vanillin Market Revenue Share (%), by Application 2024 & 2032
- Figure 42: Asia Pacific Bio Vanillin Market Volume Share (%), by Application 2024 & 2032
- Figure 43: Asia Pacific Bio Vanillin Market Revenue (Million), by Country 2024 & 2032
- Figure 44: Asia Pacific Bio Vanillin Market Volume (K Units), by Country 2024 & 2032
- Figure 45: Asia Pacific Bio Vanillin Market Revenue Share (%), by Country 2024 & 2032
- Figure 46: Asia Pacific Bio Vanillin Market Volume Share (%), by Country 2024 & 2032
- Figure 47: Rest of the World Bio Vanillin Market Revenue (Million), by Application 2024 & 2032
- Figure 48: Rest of the World Bio Vanillin Market Volume (K Units), by Application 2024 & 2032
- Figure 49: Rest of the World Bio Vanillin Market Revenue Share (%), by Application 2024 & 2032
- Figure 50: Rest of the World Bio Vanillin Market Volume Share (%), by Application 2024 & 2032
- Figure 51: Rest of the World Bio Vanillin Market Revenue (Million), by Country 2024 & 2032
- Figure 52: Rest of the World Bio Vanillin Market Volume (K Units), by Country 2024 & 2032
- Figure 53: Rest of the World Bio Vanillin Market Revenue Share (%), by Country 2024 & 2032
- Figure 54: Rest of the World Bio Vanillin Market Volume Share (%), by Country 2024 & 2032
List of Tables
- Table 1: Global Bio Vanillin Market Revenue Million Forecast, by Region 2019 & 2032
- Table 2: Global Bio Vanillin Market Volume K Units Forecast, by Region 2019 & 2032
- Table 3: Global Bio Vanillin Market Revenue Million Forecast, by Application 2019 & 2032
- Table 4: Global Bio Vanillin Market Volume K Units Forecast, by Application 2019 & 2032
- Table 5: Global Bio Vanillin Market Revenue Million Forecast, by Region 2019 & 2032
- Table 6: Global Bio Vanillin Market Volume K Units Forecast, by Region 2019 & 2032
- Table 7: Global Bio Vanillin Market Revenue Million Forecast, by Country 2019 & 2032
- Table 8: Global Bio Vanillin Market Volume K Units Forecast, by Country 2019 & 2032
- Table 9: United States Bio Vanillin Market Revenue (Million) Forecast, by Application 2019 & 2032
- Table 10: United States Bio Vanillin Market Volume (K Units) Forecast, by Application 2019 & 2032
- Table 11: Canada Bio Vanillin Market Revenue (Million) Forecast, by Application 2019 & 2032
- Table 12: Canada Bio Vanillin Market Volume (K Units) Forecast, by Application 2019 & 2032
- Table 13: Mexico Bio Vanillin Market Revenue (Million) Forecast, by Application 2019 & 2032
- Table 14: Mexico Bio Vanillin Market Volume (K Units) Forecast, by Application 2019 & 2032
- Table 15: Global Bio Vanillin Market Revenue Million Forecast, by Country 2019 & 2032
- Table 16: Global Bio Vanillin Market Volume K Units Forecast, by Country 2019 & 2032
- Table 17: Germany Bio Vanillin Market Revenue (Million) Forecast, by Application 2019 & 2032
- Table 18: Germany Bio Vanillin Market Volume (K Units) Forecast, by Application 2019 & 2032
- Table 19: United Kingdom Bio Vanillin Market Revenue (Million) Forecast, by Application 2019 & 2032
- Table 20: United Kingdom Bio Vanillin Market Volume (K Units) Forecast, by Application 2019 & 2032
- Table 21: France Bio Vanillin Market Revenue (Million) Forecast, by Application 2019 & 2032
- Table 22: France Bio Vanillin Market Volume (K Units) Forecast, by Application 2019 & 2032
- Table 23: Spain Bio Vanillin Market Revenue (Million) Forecast, by Application 2019 & 2032
- Table 24: Spain Bio Vanillin Market Volume (K Units) Forecast, by Application 2019 & 2032
- Table 25: Italy Bio Vanillin Market Revenue (Million) Forecast, by Application 2019 & 2032
- Table 26: Italy Bio Vanillin Market Volume (K Units) Forecast, by Application 2019 & 2032
- Table 27: Spain Bio Vanillin Market Revenue (Million) Forecast, by Application 2019 & 2032
- Table 28: Spain Bio Vanillin Market Volume (K Units) Forecast, by Application 2019 & 2032
- Table 29: Belgium Bio Vanillin Market Revenue (Million) Forecast, by Application 2019 & 2032
- Table 30: Belgium Bio Vanillin Market Volume (K Units) Forecast, by Application 2019 & 2032
- Table 31: Netherland Bio Vanillin Market Revenue (Million) Forecast, by Application 2019 & 2032
- Table 32: Netherland Bio Vanillin Market Volume (K Units) Forecast, by Application 2019 & 2032
- Table 33: Nordics Bio Vanillin Market Revenue (Million) Forecast, by Application 2019 & 2032
- Table 34: Nordics Bio Vanillin Market Volume (K Units) Forecast, by Application 2019 & 2032
- Table 35: Rest of Europe Bio Vanillin Market Revenue (Million) Forecast, by Application 2019 & 2032
- Table 36: Rest of Europe Bio Vanillin Market Volume (K Units) Forecast, by Application 2019 & 2032
- Table 37: Global Bio Vanillin Market Revenue Million Forecast, by Country 2019 & 2032
- Table 38: Global Bio Vanillin Market Volume K Units Forecast, by Country 2019 & 2032
- Table 39: China Bio Vanillin Market Revenue (Million) Forecast, by Application 2019 & 2032
- Table 40: China Bio Vanillin Market Volume (K Units) Forecast, by Application 2019 & 2032
- Table 41: Japan Bio Vanillin Market Revenue (Million) Forecast, by Application 2019 & 2032
- Table 42: Japan Bio Vanillin Market Volume (K Units) Forecast, by Application 2019 & 2032
- Table 43: India Bio Vanillin Market Revenue (Million) Forecast, by Application 2019 & 2032
- Table 44: India Bio Vanillin Market Volume (K Units) Forecast, by Application 2019 & 2032
- Table 45: South Korea Bio Vanillin Market Revenue (Million) Forecast, by Application 2019 & 2032
- Table 46: South Korea Bio Vanillin Market Volume (K Units) Forecast, by Application 2019 & 2032
- Table 47: Southeast Asia Bio Vanillin Market Revenue (Million) Forecast, by Application 2019 & 2032
- Table 48: Southeast Asia Bio Vanillin Market Volume (K Units) Forecast, by Application 2019 & 2032
- Table 49: Australia Bio Vanillin Market Revenue (Million) Forecast, by Application 2019 & 2032
- Table 50: Australia Bio Vanillin Market Volume (K Units) Forecast, by Application 2019 & 2032
- Table 51: Indonesia Bio Vanillin Market Revenue (Million) Forecast, by Application 2019 & 2032
- Table 52: Indonesia Bio Vanillin Market Volume (K Units) Forecast, by Application 2019 & 2032
- Table 53: Phillipes Bio Vanillin Market Revenue (Million) Forecast, by Application 2019 & 2032
- Table 54: Phillipes Bio Vanillin Market Volume (K Units) Forecast, by Application 2019 & 2032
- Table 55: Singapore Bio Vanillin Market Revenue (Million) Forecast, by Application 2019 & 2032
- Table 56: Singapore Bio Vanillin Market Volume (K Units) Forecast, by Application 2019 & 2032
- Table 57: Thailandc Bio Vanillin Market Revenue (Million) Forecast, by Application 2019 & 2032
- Table 58: Thailandc Bio Vanillin Market Volume (K Units) Forecast, by Application 2019 & 2032
- Table 59: Rest of Asia Pacific Bio Vanillin Market Revenue (Million) Forecast, by Application 2019 & 2032
- Table 60: Rest of Asia Pacific Bio Vanillin Market Volume (K Units) Forecast, by Application 2019 & 2032
- Table 61: Global Bio Vanillin Market Revenue Million Forecast, by Country 2019 & 2032
- Table 62: Global Bio Vanillin Market Volume K Units Forecast, by Country 2019 & 2032
- Table 63: Brazil Bio Vanillin Market Revenue (Million) Forecast, by Application 2019 & 2032
- Table 64: Brazil Bio Vanillin Market Volume (K Units) Forecast, by Application 2019 & 2032
- Table 65: Argentina Bio Vanillin Market Revenue (Million) Forecast, by Application 2019 & 2032
- Table 66: Argentina Bio Vanillin Market Volume (K Units) Forecast, by Application 2019 & 2032
- Table 67: Peru Bio Vanillin Market Revenue (Million) Forecast, by Application 2019 & 2032
- Table 68: Peru Bio Vanillin Market Volume (K Units) Forecast, by Application 2019 & 2032
- Table 69: Chile Bio Vanillin Market Revenue (Million) Forecast, by Application 2019 & 2032
- Table 70: Chile Bio Vanillin Market Volume (K Units) Forecast, by Application 2019 & 2032
- Table 71: Colombia Bio Vanillin Market Revenue (Million) Forecast, by Application 2019 & 2032
- Table 72: Colombia Bio Vanillin Market Volume (K Units) Forecast, by Application 2019 & 2032
- Table 73: Ecuador Bio Vanillin Market Revenue (Million) Forecast, by Application 2019 & 2032
- Table 74: Ecuador Bio Vanillin Market Volume (K Units) Forecast, by Application 2019 & 2032
- Table 75: Venezuela Bio Vanillin Market Revenue (Million) Forecast, by Application 2019 & 2032
- Table 76: Venezuela Bio Vanillin Market Volume (K Units) Forecast, by Application 2019 & 2032
- Table 77: Rest of South America Bio Vanillin Market Revenue (Million) Forecast, by Application 2019 & 2032
- Table 78: Rest of South America Bio Vanillin Market Volume (K Units) Forecast, by Application 2019 & 2032
- Table 79: Global Bio Vanillin Market Revenue Million Forecast, by Country 2019 & 2032
- Table 80: Global Bio Vanillin Market Volume K Units Forecast, by Country 2019 & 2032
- Table 81: United Arab Emirates Bio Vanillin Market Revenue (Million) Forecast, by Application 2019 & 2032
- Table 82: United Arab Emirates Bio Vanillin Market Volume (K Units) Forecast, by Application 2019 & 2032
- Table 83: Saudi Arabia Bio Vanillin Market Revenue (Million) Forecast, by Application 2019 & 2032
- Table 84: Saudi Arabia Bio Vanillin Market Volume (K Units) Forecast, by Application 2019 & 2032
- Table 85: South Africa Bio Vanillin Market Revenue (Million) Forecast, by Application 2019 & 2032
- Table 86: South Africa Bio Vanillin Market Volume (K Units) Forecast, by Application 2019 & 2032
- Table 87: Rest of Middle East and Africa Bio Vanillin Market Revenue (Million) Forecast, by Application 2019 & 2032
- Table 88: Rest of Middle East and Africa Bio Vanillin Market Volume (K Units) Forecast, by Application 2019 & 2032
- Table 89: Global Bio Vanillin Market Revenue Million Forecast, by Application 2019 & 2032
- Table 90: Global Bio Vanillin Market Volume K Units Forecast, by Application 2019 & 2032
- Table 91: Global Bio Vanillin Market Revenue Million Forecast, by Country 2019 & 2032
- Table 92: Global Bio Vanillin Market Volume K Units Forecast, by Country 2019 & 2032
- Table 93: United States Bio Vanillin Market Revenue (Million) Forecast, by Application 2019 & 2032
- Table 94: United States Bio Vanillin Market Volume (K Units) Forecast, by Application 2019 & 2032
- Table 95: Canada Bio Vanillin Market Revenue (Million) Forecast, by Application 2019 & 2032
- Table 96: Canada Bio Vanillin Market Volume (K Units) Forecast, by Application 2019 & 2032
- Table 97: Mexico Bio Vanillin Market Revenue (Million) Forecast, by Application 2019 & 2032
- Table 98: Mexico Bio Vanillin Market Volume (K Units) Forecast, by Application 2019 & 2032
- Table 99: Rest of North America Bio Vanillin Market Revenue (Million) Forecast, by Application 2019 & 2032
- Table 100: Rest of North America Bio Vanillin Market Volume (K Units) Forecast, by Application 2019 & 2032
- Table 101: Global Bio Vanillin Market Revenue Million Forecast, by Application 2019 & 2032
- Table 102: Global Bio Vanillin Market Volume K Units Forecast, by Application 2019 & 2032
- Table 103: Global Bio Vanillin Market Revenue Million Forecast, by Country 2019 & 2032
- Table 104: Global Bio Vanillin Market Volume K Units Forecast, by Country 2019 & 2032
- Table 105: United Kingdom Bio Vanillin Market Revenue (Million) Forecast, by Application 2019 & 2032
- Table 106: United Kingdom Bio Vanillin Market Volume (K Units) Forecast, by Application 2019 & 2032
- Table 107: Germany Bio Vanillin Market Revenue (Million) Forecast, by Application 2019 & 2032
- Table 108: Germany Bio Vanillin Market Volume (K Units) Forecast, by Application 2019 & 2032
- Table 109: France Bio Vanillin Market Revenue (Million) Forecast, by Application 2019 & 2032
- Table 110: France Bio Vanillin Market Volume (K Units) Forecast, by Application 2019 & 2032
- Table 111: Russia Bio Vanillin Market Revenue (Million) Forecast, by Application 2019 & 2032
- Table 112: Russia Bio Vanillin Market Volume (K Units) Forecast, by Application 2019 & 2032
- Table 113: Italy Bio Vanillin Market Revenue (Million) Forecast, by Application 2019 & 2032
- Table 114: Italy Bio Vanillin Market Volume (K Units) Forecast, by Application 2019 & 2032
- Table 115: Rest of Europe Bio Vanillin Market Revenue (Million) Forecast, by Application 2019 & 2032
- Table 116: Rest of Europe Bio Vanillin Market Volume (K Units) Forecast, by Application 2019 & 2032
- Table 117: Global Bio Vanillin Market Revenue Million Forecast, by Application 2019 & 2032
- Table 118: Global Bio Vanillin Market Volume K Units Forecast, by Application 2019 & 2032
- Table 119: Global Bio Vanillin Market Revenue Million Forecast, by Country 2019 & 2032
- Table 120: Global Bio Vanillin Market Volume K Units Forecast, by Country 2019 & 2032
- Table 121: India Bio Vanillin Market Revenue (Million) Forecast, by Application 2019 & 2032
- Table 122: India Bio Vanillin Market Volume (K Units) Forecast, by Application 2019 & 2032
- Table 123: China Bio Vanillin Market Revenue (Million) Forecast, by Application 2019 & 2032
- Table 124: China Bio Vanillin Market Volume (K Units) Forecast, by Application 2019 & 2032
- Table 125: Japan Bio Vanillin Market Revenue (Million) Forecast, by Application 2019 & 2032
- Table 126: Japan Bio Vanillin Market Volume (K Units) Forecast, by Application 2019 & 2032
- Table 127: Australia Bio Vanillin Market Revenue (Million) Forecast, by Application 2019 & 2032
- Table 128: Australia Bio Vanillin Market Volume (K Units) Forecast, by Application 2019 & 2032
- Table 129: Rest of Asia Pacific Bio Vanillin Market Revenue (Million) Forecast, by Application 2019 & 2032
- Table 130: Rest of Asia Pacific Bio Vanillin Market Volume (K Units) Forecast, by Application 2019 & 2032
- Table 131: Global Bio Vanillin Market Revenue Million Forecast, by Application 2019 & 2032
- Table 132: Global Bio Vanillin Market Volume K Units Forecast, by Application 2019 & 2032
- Table 133: Global Bio Vanillin Market Revenue Million Forecast, by Country 2019 & 2032
- Table 134: Global Bio Vanillin Market Volume K Units Forecast, by Country 2019 & 2032
- Table 135: South America Bio Vanillin Market Revenue (Million) Forecast, by Application 2019 & 2032
- Table 136: South America Bio Vanillin Market Volume (K Units) Forecast, by Application 2019 & 2032
- Table 137: Middle East Bio Vanillin Market Revenue (Million) Forecast, by Application 2019 & 2032
- Table 138: Middle East Bio Vanillin Market Volume (K Units) Forecast, by Application 2019 & 2032
Frequently Asked Questions
1. What is the projected Compound Annual Growth Rate (CAGR) of the Bio Vanillin Market?
The projected CAGR is approximately 7.30%.
2. Which companies are prominent players in the Bio Vanillin Market?
Key companies in the market include Firmenich SA, Givaudan, Evolva Holding SA, Archer Daniels Midland Company, Lesaffre, Advanced Biotech, AUROCHEMICAL, Apple Flavor & Fragrance Group Co Ltd.
3. What are the main segments of the Bio Vanillin Market?
The market segments include Application.
4. Can you provide details about the market size?
The market size is estimated to be USD 277.69 Million as of 2022.
5. What are some drivers contributing to market growth?
Surge in Demand for 'Free-from' Food Products; Demand For Convenient And Healthy On-the-go Snacking Options.
6. What are the notable trends driving market growth?
Growing Demand for Bio Vanillin in the Food and Beverage Industry.
7. Are there any restraints impacting market growth?
Health Risk Associated with Certain Ingredients.
8. Can you provide examples of recent developments in the market?
N/A
9. What pricing options are available for accessing the report?
Pricing options include single-user, multi-user, and enterprise licenses priced at USD 4750, USD 5250, and USD 8750 respectively.
10. Is the market size provided in terms of value or volume?
The market size is provided in terms of value, measured in Million and volume, measured in K Units.
11. Are there any specific market keywords associated with the report?
Yes, the market keyword associated with the report is "Bio Vanillin Market," which aids in identifying and referencing the specific market segment covered.
12. How do I determine which pricing option suits my needs best?
The pricing options vary based on user requirements and access needs. Individual users may opt for single-user licenses, while businesses requiring broader access may choose multi-user or enterprise licenses for cost-effective access to the report.
13. Are there any additional resources or data provided in the Bio Vanillin Market report?
While the report offers comprehensive insights, it's advisable to review the specific contents or supplementary materials provided to ascertain if additional resources or data are available.
14. How can I stay updated on further developments or reports in the Bio Vanillin Market?
To stay informed about further developments, trends, and reports in the Bio Vanillin Market, consider subscribing to industry newsletters, following relevant companies and organizations, or regularly checking reputable industry news sources and publications.
Methodology
Step 1 - Identification of Relevant Samples Size from Population Database


Step 2 - Approaches for Defining Global Market Size (Value, Volume* & Price*)

Note*: In applicable scenarios
Step 3 - Data Sources
Primary Research
- Web Analytics
- Survey Reports
- Research Institute
- Latest Research Reports
- Opinion Leaders
Secondary Research
- Annual Reports
- White Paper
- Latest Press Release
- Industry Association
- Paid Database
- Investor Presentations

Step 4 - Data Triangulation
Involves using different sources of information in order to increase the validity of a study
These sources are likely to be stakeholders in a program - participants, other researchers, program staff, other community members, and so on.
Then we put all data in single framework & apply various statistical tools to find out the dynamic on the market.
During the analysis stage, feedback from the stakeholder groups would be compared to determine areas of agreement as well as areas of divergence
