

Key Insights
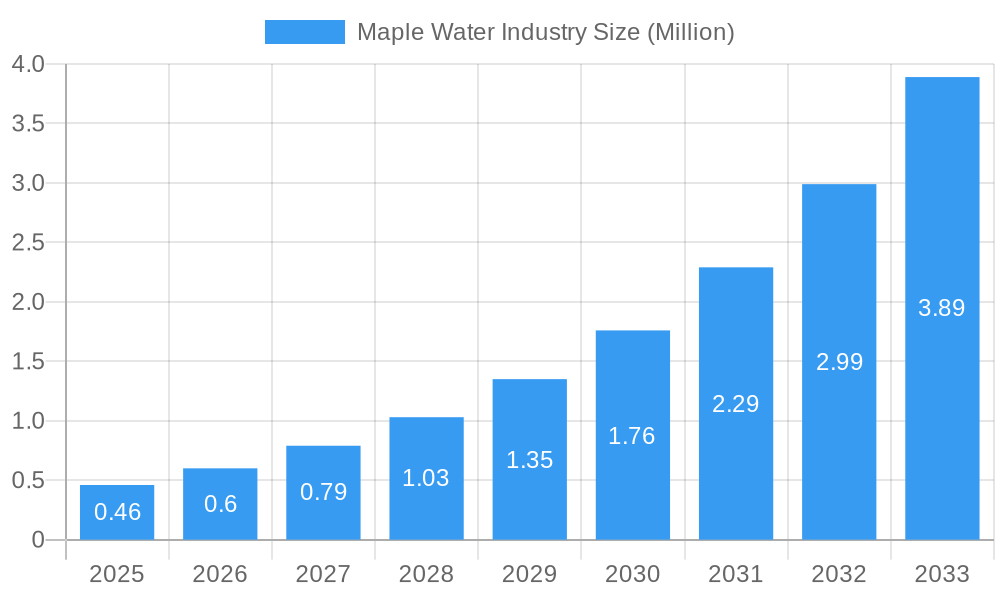
The global Maple Water market is poised for exceptional growth, projected to reach $0.46 million in 2025 and expand at a remarkable Compound Annual Growth Rate (CAGR) of 30.75% through 2033. This rapid expansion is fueled by a confluence of powerful market drivers, including the increasing consumer demand for natural, low-calorie, and functional beverages, as well as a growing awareness of maple water's inherent health benefits such as its rich antioxidant content and electrolyte profile. The trend towards healthier lifestyle choices and the rising popularity of plant-based alternatives to dairy and conventional juices are significantly boosting demand. Furthermore, innovative product developments, particularly in flavored variants and convenient packaging solutions like cartons and tetra paks, are making maple water more accessible and appealing to a broader consumer base. The strategic presence of key players like Smith & Salmon Inc. (Sap! Beverages), Loblaws Companies Limited (President's Choice), and Drink Simple is also instrumental in driving market penetration and consumer adoption through enhanced distribution and marketing efforts.
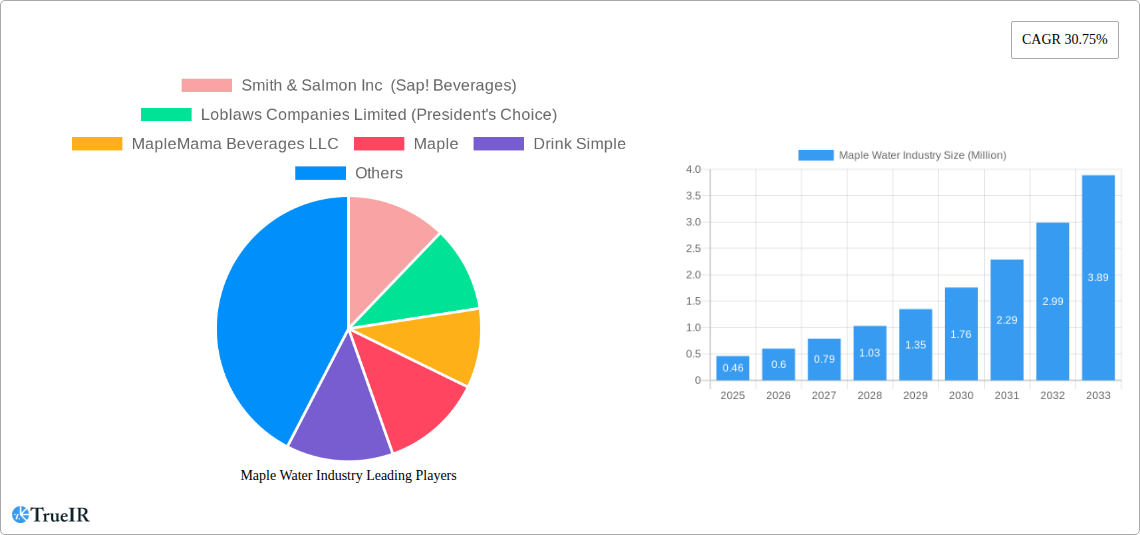
Maple Water Industry Market Size (In Million)
The market's impressive trajectory, however, faces certain restraints that require strategic navigation. High production costs and seasonal availability of maple sap can impact consistent supply and price stability, presenting challenges for market expansion. Additionally, intense competition from established beverage categories and the need for consumer education regarding the unique benefits of maple water require concerted marketing and promotional strategies. Despite these hurdles, the diversified growth across various segments – from flavored and unflavored products to different packaging types and extensive distribution channels including online retail – indicates a robust and dynamic market. North America, with its established maple syrup industry and high consumer acceptance of natural products, is expected to lead the market. However, significant growth opportunities also lie in Europe and the Asia Pacific region as awareness and demand for health-conscious beverages continue to surge globally, indicating a promising outlook for the maple water industry over the forecast period.
Maple Water Industry Company Market Share
Maple Water Industry Market Analysis Report: Growth, Trends, and Competitive Landscape (2019-2033)
This comprehensive report provides an in-depth analysis of the global Maple Water Industry, covering its market structure, competitive landscape, key trends, dominant segments, product innovations, growth drivers, challenges, and future outlook. With a study period from 2019 to 2033, a base year of 2025, and an estimated year of 2025, this report offers critical insights for stakeholders. The forecast period spans 2025–2033, building upon the historical data from 2019–2024. We utilize high-volume keywords such as "maple water market," "natural beverages," "healthy drinks," "sustainable sourcing," and "functional beverages" to ensure maximum SEO visibility and engagement with industry professionals.
Maple Water Industry Market Structure & Competitive Landscape
The Maple Water Industry exhibits a moderately concentrated market structure, with a growing number of established beverage companies and niche players vying for market share. Innovation remains a key driver, particularly in product development, including flavored varieties and enhanced functional benefits. Regulatory impacts, primarily related to food safety standards and labeling, are being navigated by industry participants. Product substitutes, such as coconut water, birch water, and other natural spring waters, pose a competitive challenge, necessitating clear differentiation and value proposition. End-user segmentation reveals a strong appeal to health-conscious consumers, millennials, and those seeking sustainable and natural beverage options. Mergers and acquisitions (M&A) are anticipated to play a role in market consolidation as larger entities seek to expand their portfolio in the growing functional beverage segment. The global maple water market size is projected to witness substantial growth driven by these structural dynamics and evolving consumer preferences.
Maple Water Industry Market Trends & Opportunities
The Maple Water Industry is experiencing robust growth, projected to achieve a Compound Annual Growth Rate (CAGR) of approximately 12.5% from 2025 to 2033, propelling the maple water market value to an estimated $1.5 billion by 2033. This expansion is fueled by a confluence of evolving consumer preferences and significant technological shifts within the beverage sector. Consumers are increasingly seeking natural, healthy, and low-calorie alternatives to traditional sugary drinks, positioning maple water as an attractive option due to its natural sweetness, hydrating properties, and mineral content. The market penetration rate for maple water, while still relatively low compared to established beverages, is steadily increasing as awareness grows. Technological advancements in collection and processing techniques are improving product quality, shelf-life, and cost-effectiveness, making maple water more accessible. Furthermore, innovative packaging solutions, including sustainable and eco-friendly options, are enhancing consumer appeal. The competitive dynamics are intensifying, with both established beverage giants and agile startups investing in the sector, leading to increased marketing efforts and product diversification. Opportunities abound for brands that can effectively communicate their unique selling propositions, emphasizing sustainable maple water sourcing, health benefits, and distinct flavor profiles. The rise of functional maple water incorporating added nutrients or probiotics presents another significant avenue for growth. The organic maple water market is also a key area of development, appealing to a segment of consumers prioritizing certified organic products.
Dominant Markets & Segments in Maple Water Industry
The Maple Water Industry demonstrates strong dominance in North America, particularly in Canada and the United States, owing to the readily available maple sap resources and established consumer appreciation for maple-derived products. Within the product type segment, Unflavored Maple Water currently holds the largest market share, appealing to purists and those seeking the inherent health benefits without added ingredients. However, Flavored Maple Water is exhibiting the fastest growth rate, driven by consumer demand for variety and the introduction of innovative flavor combinations such as berry, ginger, and mint.
In terms of packaging, Bottles remain the dominant format, offering convenience and portability for on-the-go consumption. Nevertheless, Cartons/Tetra Pak are gaining traction due to their sustainability advantages and suitability for larger-format offerings.
The Supermarkets/Hypermarkets distribution channel commands the highest sales volume, benefiting from broad consumer reach and established retail partnerships. Online Retail Stores are emerging as a significant growth channel, particularly for niche brands and direct-to-consumer sales, catering to the convenience-seeking demographic. Specialty stores also play a crucial role in reaching health-conscious consumers.
Key growth drivers within dominant markets include:
- Infrastructure: Established maple syrup production infrastructure readily adapts to maple water collection.
- Policies: Supportive agricultural policies and food safety regulations in key producing regions facilitate market entry.
- Consumer Awareness: Growing awareness of the health benefits and unique properties of maple water is a primary catalyst.
Maple Water Industry Product Analysis
Product innovations in the Maple Water Industry are primarily focused on enhancing consumer appeal and market fit. This includes the development of low-calorie flavored maple water options, the infusion of functional ingredients like electrolytes and vitamins for enhanced hydration and wellness, and the exploration of unique botanical pairings for distinct flavor profiles. Competitive advantages are being built through superior taste, proven health benefits (e.g., antioxidants, minerals), and a strong commitment to sustainable and ethical maple water harvesting. The market is witnessing a surge in organic certified maple water, catering to the growing demand for natural and pure products.
Key Drivers, Barriers & Challenges in Maple Water Industry
The Maple Water Industry is propelled by several key drivers, including the escalating consumer demand for natural and healthy beverages, driven by a growing awareness of the health benefits associated with maple water's mineral content and low-calorie profile. Technological advancements in sap collection and processing are enhancing efficiency and product quality. Furthermore, the increasing emphasis on sustainable and eco-friendly products aligns perfectly with maple water's natural origins.
However, the industry faces significant barriers and challenges. Supply chain complexities, particularly the seasonality of sap collection and the geographical limitations of maple-producing regions, can impact consistent availability and pricing. Regulatory hurdles related to food safety standards and labeling across different markets can also pose challenges. Intense competitive pressure from established and emerging beverage categories, including coconut water and other plant-based alternatives, necessitates continuous innovation and effective marketing strategies. The high initial investment required for establishing sustainable collection and processing infrastructure can also be a deterrent for new entrants.
Growth Drivers in the Maple Water Industry Market
The Maple Water Industry Market is experiencing significant growth driven by several key factors. The increasing global trend towards health and wellness is a primary catalyst, with consumers actively seeking beverages that offer natural hydration and nutritional benefits without artificial additives. Technological advancements in sap collection, such as improved tapping techniques and real-time monitoring, are leading to higher yields and improved quality of maple sap, directly impacting the availability of premium maple water. Furthermore, supportive government initiatives and a growing focus on sustainable agriculture and eco-friendly products are creating a favorable market environment for maple water, which is often perceived as a naturally sustainable beverage. The rising popularity of functional beverages also presents a significant opportunity for maple water to be fortified with vitamins, minerals, or other health-enhancing ingredients.
Challenges Impacting Maple Water Industry Growth
Despite the promising growth trajectory, the Maple Water Industry confronts several challenges that can impact its expansion. The inherent seasonality of maple sap harvesting poses a significant logistical and supply chain challenge, requiring efficient cold-chain management and storage solutions to ensure year-round availability. Geographical limitations to maple-producing regions can also restrict scalability and increase transportation costs, particularly for global distribution. Intense competition from well-established and diverse beverage markets, including coconut water, almond milk, and other plant-based alternatives, demands continuous product differentiation and strong marketing efforts to capture consumer attention. Regulatory complexities and varying food safety standards across different countries can create hurdles for market entry and expansion. Finally, consumer education and awareness remain crucial, as maple water is still a relatively nascent beverage category for many consumers globally, requiring ongoing efforts to highlight its unique benefits and differentiate it from maple syrup.
Key Players Shaping the Maple Water Industry Market
The Maple Water Industry is shaped by a diverse range of companies, from established beverage producers to innovative startups. Prominent players include:
- Smith & Salmon Inc (Sap! Beverages)
- Loblaws Companies Limited (President's Choice)
- MapleMama Beverages LLC
- Maple
- Drink Simple
- Lower Valley Beverage Co (sapsucker)
- Kiki Maple Water
- Feronia Forests LLC (Vertical Water)
- Pure Maple Water Company Ltd
- Asarasi
Significant Maple Water Industry Industry Milestones
- 2019: Increased global awareness of maple water's health benefits and sustainable sourcing begins to gain traction.
- 2020: Launch of several new flavored maple water varieties, expanding product appeal.
- 2021: Growing investment in sustainable harvesting and processing technologies within the industry.
- 2022: Expansion of online retail presence and direct-to-consumer sales channels for maple water brands.
- 2023: Increased emphasis on functional maple water offerings, incorporating added vitamins and electrolytes.
- 2024: Notable expansion of maple water distribution into mainstream supermarket chains.
Future Outlook for Maple Water Industry Market
The Maple Water Industry is poised for significant expansion in the coming years, driven by continued consumer preference for natural, healthy, and sustainable beverages. The market will likely witness further product diversification, with an increased focus on functional benefits, exotic flavor fusions, and ready-to-drink (RTD) formats. Strategic opportunities lie in expanding into emerging international markets, developing innovative and eco-friendly packaging solutions, and forging stronger partnerships across the value chain. Investment in advanced sap collection and processing technologies will be crucial for optimizing production and meeting growing demand. The future of the maple water market appears bright, underpinned by its inherent appeal as a pure, hydrating, and environmentally conscious beverage choice.
Maple Water Industry Segmentation
-
1. Product Type
- 1.1. Flavored
- 1.2. Unflavored
-
2. Packaging Type
- 2.1. Bottles
- 2.2. Cartons/Tetra Pak
- 2.3. Other Packaging Types
-
3. Distribution Channel
- 3.1. Supermarkets/Hypermarkets
- 3.2. Convenience Stores
- 3.3. Specialty Stores
- 3.4. Online Retail Stores
- 3.5. Other Distribution Channels
Maple Water Industry Segmentation By Geography
-
1. North America
- 1.1. United States
- 1.2. Canada
- 1.3. Mexico
- 1.4. Rest of North America
-
2. Europe
- 2.1. Germany
- 2.2. United Kingdom
- 2.3. France
- 2.4. Italy
- 2.5. Spain
- 2.6. Rest of Europe
-
3. Asia Pacific
- 3.1. China
- 3.2. India
- 3.3. Australia
- 3.4. Japan
-
4. Rest of the World
- 4.1. South America
- 4.2. Middle East and Africa
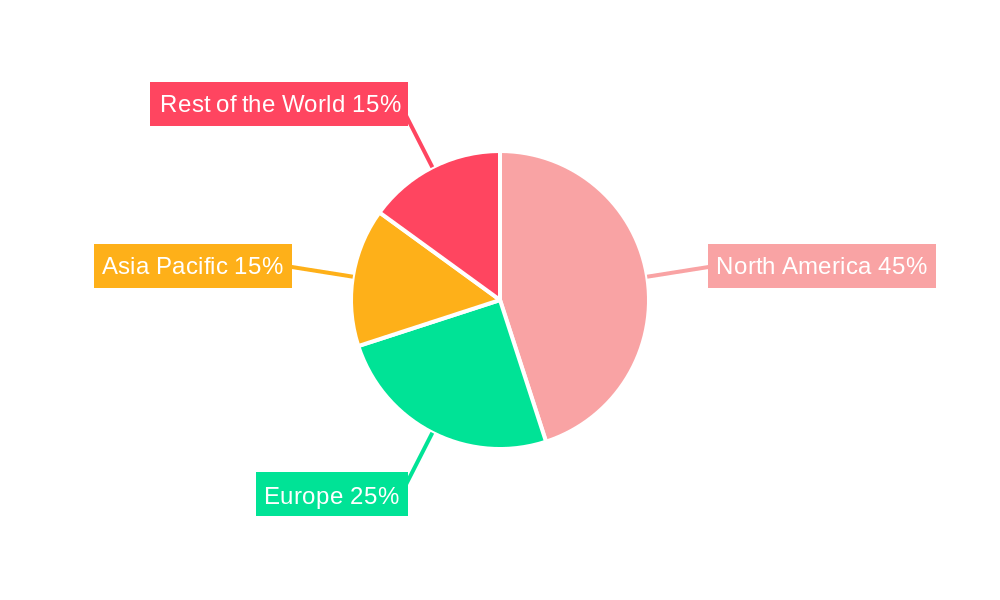
Maple Water Industry Regional Market Share
Geographic Coverage of Maple Water Industry
Maple Water Industry REPORT HIGHLIGHTS
| Aspects | Details |
|---|---|
| Study Period | 2020-2034 |
| Base Year | 2025 |
| Estimated Year | 2026 |
| Forecast Period | 2026-2034 |
| Historical Period | 2020-2025 |
| Growth Rate | CAGR of 30.75% from 2020-2034 |
| Segmentation |
|
Table of Contents
- 1. Introduction
- 1.1. Research Scope
- 1.2. Market Segmentation
- 1.3. Research Objective
- 1.4. Definitions and Assumptions
- 2. Executive Summary
- 2.1. Market Snapshot
- 3. Market Dynamics
- 3.1. Market Drivers
- 3.2. Market Restrains
- 3.3. Market Trends
- 3.4. Market Opportunities
- 4. Market Factor Analysis
- 4.1. Porters Five Forces
- 4.1.1. Bargaining Power of Suppliers
- 4.1.2. Bargaining Power of Buyers
- 4.1.3. Threat of New Entrants
- 4.1.4. Threat of Substitutes
- 4.1.5. Competitive Rivalry
- 4.2. PESTEL analysis
- 4.3. BCG Analysis
- 4.3.1. Stars (High Growth, High Market Share)
- 4.3.2. Cash Cows (Low Growth, High Market Share)
- 4.3.3. Question Mark (High Growth, Low Market Share)
- 4.3.4. Dogs (Low Growth, Low Market Share)
- 4.4. Ansoff Matrix Analysis
- 4.5. Supply Chain Analysis
- 4.6. Regulatory Landscape
- 4.7. Current Market Potential and Opportunity Assessment (TAM–SAM–SOM Framework)
- 4.8. TIR Analyst Note
- 4.1. Porters Five Forces
- 5. Market Analysis, Insights and Forecast 2021-2033
- 5.1. Market Analysis, Insights and Forecast - by Product Type
- 5.1.1. Flavored
- 5.1.2. Unflavored
- 5.2. Market Analysis, Insights and Forecast - by Packaging Type
- 5.2.1. Bottles
- 5.2.2. Cartons/Tetra Pak
- 5.2.3. Other Packaging Types
- 5.3. Market Analysis, Insights and Forecast - by Distribution Channel
- 5.3.1. Supermarkets/Hypermarkets
- 5.3.2. Convenience Stores
- 5.3.3. Specialty Stores
- 5.3.4. Online Retail Stores
- 5.3.5. Other Distribution Channels
- 5.4. Market Analysis, Insights and Forecast - by Region
- 5.4.1. North America
- 5.4.2. Europe
- 5.4.3. Asia Pacific
- 5.4.4. Rest of the World
- 5.1. Market Analysis, Insights and Forecast - by Product Type
- 6. Global Maple Water Industry Analysis, Insights and Forecast, 2021-2033
- 6.1. Market Analysis, Insights and Forecast - by Product Type
- 6.1.1. Flavored
- 6.1.2. Unflavored
- 6.2. Market Analysis, Insights and Forecast - by Packaging Type
- 6.2.1. Bottles
- 6.2.2. Cartons/Tetra Pak
- 6.2.3. Other Packaging Types
- 6.3. Market Analysis, Insights and Forecast - by Distribution Channel
- 6.3.1. Supermarkets/Hypermarkets
- 6.3.2. Convenience Stores
- 6.3.3. Specialty Stores
- 6.3.4. Online Retail Stores
- 6.3.5. Other Distribution Channels
- 6.1. Market Analysis, Insights and Forecast - by Product Type
- 7. North America Maple Water Industry Analysis, Insights and Forecast, 2020-2032
- 7.1. Market Analysis, Insights and Forecast - by Product Type
- 7.1.1. Flavored
- 7.1.2. Unflavored
- 7.2. Market Analysis, Insights and Forecast - by Packaging Type
- 7.2.1. Bottles
- 7.2.2. Cartons/Tetra Pak
- 7.2.3. Other Packaging Types
- 7.3. Market Analysis, Insights and Forecast - by Distribution Channel
- 7.3.1. Supermarkets/Hypermarkets
- 7.3.2. Convenience Stores
- 7.3.3. Specialty Stores
- 7.3.4. Online Retail Stores
- 7.3.5. Other Distribution Channels
- 7.1. Market Analysis, Insights and Forecast - by Product Type
- 8. Europe Maple Water Industry Analysis, Insights and Forecast, 2020-2032
- 8.1. Market Analysis, Insights and Forecast - by Product Type
- 8.1.1. Flavored
- 8.1.2. Unflavored
- 8.2. Market Analysis, Insights and Forecast - by Packaging Type
- 8.2.1. Bottles
- 8.2.2. Cartons/Tetra Pak
- 8.2.3. Other Packaging Types
- 8.3. Market Analysis, Insights and Forecast - by Distribution Channel
- 8.3.1. Supermarkets/Hypermarkets
- 8.3.2. Convenience Stores
- 8.3.3. Specialty Stores
- 8.3.4. Online Retail Stores
- 8.3.5. Other Distribution Channels
- 8.1. Market Analysis, Insights and Forecast - by Product Type
- 9. Asia Pacific Maple Water Industry Analysis, Insights and Forecast, 2020-2032
- 9.1. Market Analysis, Insights and Forecast - by Product Type
- 9.1.1. Flavored
- 9.1.2. Unflavored
- 9.2. Market Analysis, Insights and Forecast - by Packaging Type
- 9.2.1. Bottles
- 9.2.2. Cartons/Tetra Pak
- 9.2.3. Other Packaging Types
- 9.3. Market Analysis, Insights and Forecast - by Distribution Channel
- 9.3.1. Supermarkets/Hypermarkets
- 9.3.2. Convenience Stores
- 9.3.3. Specialty Stores
- 9.3.4. Online Retail Stores
- 9.3.5. Other Distribution Channels
- 9.1. Market Analysis, Insights and Forecast - by Product Type
- 10. Rest of the World Maple Water Industry Analysis, Insights and Forecast, 2020-2032
- 10.1. Market Analysis, Insights and Forecast - by Product Type
- 10.1.1. Flavored
- 10.1.2. Unflavored
- 10.2. Market Analysis, Insights and Forecast - by Packaging Type
- 10.2.1. Bottles
- 10.2.2. Cartons/Tetra Pak
- 10.2.3. Other Packaging Types
- 10.3. Market Analysis, Insights and Forecast - by Distribution Channel
- 10.3.1. Supermarkets/Hypermarkets
- 10.3.2. Convenience Stores
- 10.3.3. Specialty Stores
- 10.3.4. Online Retail Stores
- 10.3.5. Other Distribution Channels
- 10.1. Market Analysis, Insights and Forecast - by Product Type
- 11. Competitive Analysis
- 11.1. Company Profiles
- 11.1.1 Smith & Salmon Inc (Sap! Beverages)
- 11.1.1.1. Company Overview
- 11.1.1.2. Products
- 11.1.1.3. Company Financials
- 11.1.1.4. SWOT Analysis
- 11.1.2 Loblaws Companies Limited (President's Choice)
- 11.1.2.1. Company Overview
- 11.1.2.2. Products
- 11.1.2.3. Company Financials
- 11.1.2.4. SWOT Analysis
- 11.1.3 MapleMama Beverages LLC
- 11.1.3.1. Company Overview
- 11.1.3.2. Products
- 11.1.3.3. Company Financials
- 11.1.3.4. SWOT Analysis
- 11.1.4 Maple
- 11.1.4.1. Company Overview
- 11.1.4.2. Products
- 11.1.4.3. Company Financials
- 11.1.4.4. SWOT Analysis
- 11.1.5 Drink Simple
- 11.1.5.1. Company Overview
- 11.1.5.2. Products
- 11.1.5.3. Company Financials
- 11.1.5.4. SWOT Analysis
- 11.1.6 Lower Valley Beverage Co(sapsucker)*List Not Exhaustive
- 11.1.6.1. Company Overview
- 11.1.6.2. Products
- 11.1.6.3. Company Financials
- 11.1.6.4. SWOT Analysis
- 11.1.7 Kiki Maple Water
- 11.1.7.1. Company Overview
- 11.1.7.2. Products
- 11.1.7.3. Company Financials
- 11.1.7.4. SWOT Analysis
- 11.1.8 Feronia Forests LLC (Vertical Water)
- 11.1.8.1. Company Overview
- 11.1.8.2. Products
- 11.1.8.3. Company Financials
- 11.1.8.4. SWOT Analysis
- 11.1.9 Pure Maple Water Company Ltd
- 11.1.9.1. Company Overview
- 11.1.9.2. Products
- 11.1.9.3. Company Financials
- 11.1.9.4. SWOT Analysis
- 11.1.10 Asarasi
- 11.1.10.1. Company Overview
- 11.1.10.2. Products
- 11.1.10.3. Company Financials
- 11.1.10.4. SWOT Analysis
- 11.1.1 Smith & Salmon Inc (Sap! Beverages)
- 11.2. Market Entropy
- 11.2.1 Company's Key Areas Served
- 11.2.2 Recent Developments
- 11.3. Company Market Share Analysis 2025
- 11.3.1 Top 5 Companies Market Share Analysis
- 11.3.2 Top 3 Companies Market Share Analysis
- 11.4. List of Potential Customers
- 12. Research Methodology
List of Figures
- Figure 1: Global Maple Water Industry Revenue Breakdown (Million, %) by Region 2025 & 2033
- Figure 2: North America Maple Water Industry Revenue (Million), by Product Type 2025 & 2033
- Figure 3: North America Maple Water Industry Revenue Share (%), by Product Type 2025 & 2033
- Figure 4: North America Maple Water Industry Revenue (Million), by Packaging Type 2025 & 2033
- Figure 5: North America Maple Water Industry Revenue Share (%), by Packaging Type 2025 & 2033
- Figure 6: North America Maple Water Industry Revenue (Million), by Distribution Channel 2025 & 2033
- Figure 7: North America Maple Water Industry Revenue Share (%), by Distribution Channel 2025 & 2033
- Figure 8: North America Maple Water Industry Revenue (Million), by Country 2025 & 2033
- Figure 9: North America Maple Water Industry Revenue Share (%), by Country 2025 & 2033
- Figure 10: Europe Maple Water Industry Revenue (Million), by Product Type 2025 & 2033
- Figure 11: Europe Maple Water Industry Revenue Share (%), by Product Type 2025 & 2033
- Figure 12: Europe Maple Water Industry Revenue (Million), by Packaging Type 2025 & 2033
- Figure 13: Europe Maple Water Industry Revenue Share (%), by Packaging Type 2025 & 2033
- Figure 14: Europe Maple Water Industry Revenue (Million), by Distribution Channel 2025 & 2033
- Figure 15: Europe Maple Water Industry Revenue Share (%), by Distribution Channel 2025 & 2033
- Figure 16: Europe Maple Water Industry Revenue (Million), by Country 2025 & 2033
- Figure 17: Europe Maple Water Industry Revenue Share (%), by Country 2025 & 2033
- Figure 18: Asia Pacific Maple Water Industry Revenue (Million), by Product Type 2025 & 2033
- Figure 19: Asia Pacific Maple Water Industry Revenue Share (%), by Product Type 2025 & 2033
- Figure 20: Asia Pacific Maple Water Industry Revenue (Million), by Packaging Type 2025 & 2033
- Figure 21: Asia Pacific Maple Water Industry Revenue Share (%), by Packaging Type 2025 & 2033
- Figure 22: Asia Pacific Maple Water Industry Revenue (Million), by Distribution Channel 2025 & 2033
- Figure 23: Asia Pacific Maple Water Industry Revenue Share (%), by Distribution Channel 2025 & 2033
- Figure 24: Asia Pacific Maple Water Industry Revenue (Million), by Country 2025 & 2033
- Figure 25: Asia Pacific Maple Water Industry Revenue Share (%), by Country 2025 & 2033
- Figure 26: Rest of the World Maple Water Industry Revenue (Million), by Product Type 2025 & 2033
- Figure 27: Rest of the World Maple Water Industry Revenue Share (%), by Product Type 2025 & 2033
- Figure 28: Rest of the World Maple Water Industry Revenue (Million), by Packaging Type 2025 & 2033
- Figure 29: Rest of the World Maple Water Industry Revenue Share (%), by Packaging Type 2025 & 2033
- Figure 30: Rest of the World Maple Water Industry Revenue (Million), by Distribution Channel 2025 & 2033
- Figure 31: Rest of the World Maple Water Industry Revenue Share (%), by Distribution Channel 2025 & 2033
- Figure 32: Rest of the World Maple Water Industry Revenue (Million), by Country 2025 & 2033
- Figure 33: Rest of the World Maple Water Industry Revenue Share (%), by Country 2025 & 2033
List of Tables
- Table 1: Global Maple Water Industry Revenue Million Forecast, by Product Type 2020 & 2033
- Table 2: Global Maple Water Industry Revenue Million Forecast, by Packaging Type 2020 & 2033
- Table 3: Global Maple Water Industry Revenue Million Forecast, by Distribution Channel 2020 & 2033
- Table 4: Global Maple Water Industry Revenue Million Forecast, by Region 2020 & 2033
- Table 5: Global Maple Water Industry Revenue Million Forecast, by Product Type 2020 & 2033
- Table 6: Global Maple Water Industry Revenue Million Forecast, by Packaging Type 2020 & 2033
- Table 7: Global Maple Water Industry Revenue Million Forecast, by Distribution Channel 2020 & 2033
- Table 8: Global Maple Water Industry Revenue Million Forecast, by Country 2020 & 2033
- Table 9: United States Maple Water Industry Revenue (Million) Forecast, by Application 2020 & 2033
- Table 10: Canada Maple Water Industry Revenue (Million) Forecast, by Application 2020 & 2033
- Table 11: Mexico Maple Water Industry Revenue (Million) Forecast, by Application 2020 & 2033
- Table 12: Rest of North America Maple Water Industry Revenue (Million) Forecast, by Application 2020 & 2033
- Table 13: Global Maple Water Industry Revenue Million Forecast, by Product Type 2020 & 2033
- Table 14: Global Maple Water Industry Revenue Million Forecast, by Packaging Type 2020 & 2033
- Table 15: Global Maple Water Industry Revenue Million Forecast, by Distribution Channel 2020 & 2033
- Table 16: Global Maple Water Industry Revenue Million Forecast, by Country 2020 & 2033
- Table 17: Germany Maple Water Industry Revenue (Million) Forecast, by Application 2020 & 2033
- Table 18: United Kingdom Maple Water Industry Revenue (Million) Forecast, by Application 2020 & 2033
- Table 19: France Maple Water Industry Revenue (Million) Forecast, by Application 2020 & 2033
- Table 20: Italy Maple Water Industry Revenue (Million) Forecast, by Application 2020 & 2033
- Table 21: Spain Maple Water Industry Revenue (Million) Forecast, by Application 2020 & 2033
- Table 22: Rest of Europe Maple Water Industry Revenue (Million) Forecast, by Application 2020 & 2033
- Table 23: Global Maple Water Industry Revenue Million Forecast, by Product Type 2020 & 2033
- Table 24: Global Maple Water Industry Revenue Million Forecast, by Packaging Type 2020 & 2033
- Table 25: Global Maple Water Industry Revenue Million Forecast, by Distribution Channel 2020 & 2033
- Table 26: Global Maple Water Industry Revenue Million Forecast, by Country 2020 & 2033
- Table 27: China Maple Water Industry Revenue (Million) Forecast, by Application 2020 & 2033
- Table 28: India Maple Water Industry Revenue (Million) Forecast, by Application 2020 & 2033
- Table 29: Australia Maple Water Industry Revenue (Million) Forecast, by Application 2020 & 2033
- Table 30: Japan Maple Water Industry Revenue (Million) Forecast, by Application 2020 & 2033
- Table 31: Global Maple Water Industry Revenue Million Forecast, by Product Type 2020 & 2033
- Table 32: Global Maple Water Industry Revenue Million Forecast, by Packaging Type 2020 & 2033
- Table 33: Global Maple Water Industry Revenue Million Forecast, by Distribution Channel 2020 & 2033
- Table 34: Global Maple Water Industry Revenue Million Forecast, by Country 2020 & 2033
- Table 35: South America Maple Water Industry Revenue (Million) Forecast, by Application 2020 & 2033
- Table 36: Middle East and Africa Maple Water Industry Revenue (Million) Forecast, by Application 2020 & 2033
Frequently Asked Questions
1. What is the projected Compound Annual Growth Rate (CAGR) of the Maple Water Industry?
The projected CAGR is approximately 30.75%.
2. Which companies are prominent players in the Maple Water Industry?
Key companies in the market include Smith & Salmon Inc (Sap! Beverages), Loblaws Companies Limited (President's Choice), MapleMama Beverages LLC, Maple, Drink Simple, Lower Valley Beverage Co(sapsucker)*List Not Exhaustive, Kiki Maple Water, Feronia Forests LLC (Vertical Water), Pure Maple Water Company Ltd, Asarasi.
3. What are the main segments of the Maple Water Industry?
The market segments include Product Type, Packaging Type, Distribution Channel.
4. Can you provide details about the market size?
The market size is estimated to be USD 0.46 Million as of 2022.
5. What are some drivers contributing to market growth?
Popularization of Adventure Sports and Expedition; Suitability of the Freeze-Dried Technique for Heat Sensitive Food Products.
6. What are the notable trends driving market growth?
Value-added Hydration is Evolving Consumer Preferences in the Maple Water Market.
7. Are there any restraints impacting market growth?
High Cost Associated with the Freeze-Drying Technology.
8. Can you provide examples of recent developments in the market?
N/A
9. What pricing options are available for accessing the report?
Pricing options include single-user, multi-user, and enterprise licenses priced at USD 4750, USD 5250, and USD 8750 respectively.
10. Is the market size provided in terms of value or volume?
The market size is provided in terms of value, measured in Million.
11. Are there any specific market keywords associated with the report?
Yes, the market keyword associated with the report is "Maple Water Industry," which aids in identifying and referencing the specific market segment covered.
12. How do I determine which pricing option suits my needs best?
The pricing options vary based on user requirements and access needs. Individual users may opt for single-user licenses, while businesses requiring broader access may choose multi-user or enterprise licenses for cost-effective access to the report.
13. Are there any additional resources or data provided in the Maple Water Industry report?
While the report offers comprehensive insights, it's advisable to review the specific contents or supplementary materials provided to ascertain if additional resources or data are available.
14. How can I stay updated on further developments or reports in the Maple Water Industry?
To stay informed about further developments, trends, and reports in the Maple Water Industry, consider subscribing to industry newsletters, following relevant companies and organizations, or regularly checking reputable industry news sources and publications.
Methodology
Step 1 - Identification of Relevant Samples Size from Population Database


Step 2 - Approaches for Defining Global Market Size (Value, Volume* & Price*)

Note*: In applicable scenarios
Step 3 - Data Sources
Primary Research
- Web Analytics
- Survey Reports
- Research Institute
- Latest Research Reports
- Opinion Leaders
Secondary Research
- Annual Reports
- White Paper
- Latest Press Release
- Industry Association
- Paid Database
- Investor Presentations

Step 4 - Data Triangulation
Involves using different sources of information in order to increase the validity of a study
These sources are likely to be stakeholders in a program - participants, other researchers, program staff, other community members, and so on.
Then we put all data in single framework & apply various statistical tools to find out the dynamic on the market.
During the analysis stage, feedback from the stakeholder groups would be compared to determine areas of agreement as well as areas of divergence