
Key Insights
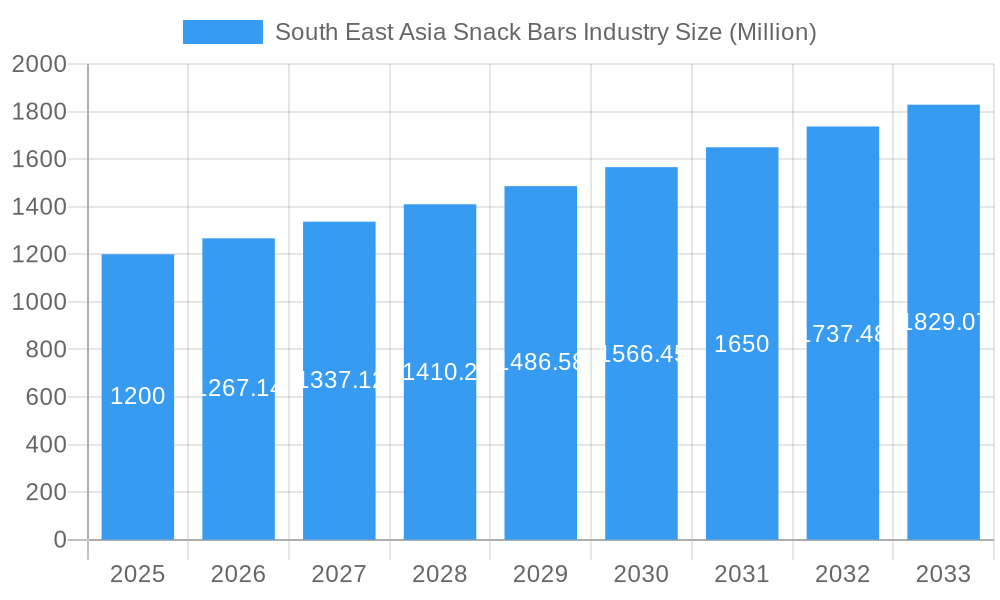
The South East Asia snack bar market, currently valued at approximately $1200 million in 2025, is projected to experience robust growth, driven by several key factors. The rising health-conscious consumer base, coupled with increasing disposable incomes and urbanization across the region, fuels demand for convenient and nutritious snack options. This trend is particularly prominent in countries like China, India, and Japan, where burgeoning middle classes are adopting Westernized lifestyles and dietary habits. The market is segmented by distribution channels (hypermarkets/supermarkets, online stores, convenience stores, and others) and product types (cereal bars, energy bars, and other snack bars). The dominance of hypermarkets and supermarkets is expected to continue, although the online channel shows significant growth potential, fueled by increasing e-commerce penetration. The cereal and energy bar segments are currently leading, driven by their perceived health benefits and portability, but the "other snack bars" category, encompassing innovative flavors and ingredients, presents a significant opportunity for future expansion. Major players like Nestlé, General Mills, and KIND LLC are vying for market share, often focusing on product innovation and strategic partnerships to expand their reach. While the market faces challenges such as fluctuating raw material prices and intense competition, the overall outlook remains optimistic, with a projected CAGR of 5.19% from 2025 to 2033. The Asia-Pacific region, especially South East Asia, is a key growth driver, given its large and rapidly evolving consumer market.
South East Asia Snack Bars Industry Market Size (In Billion)
The snack bar market in South East Asia is further characterized by a growing preference for healthier and functional snacking options, leading to the rise of bars fortified with vitamins, protein, and other nutritional components. This trend is also reflected in the increasing popularity of organic and natural snack bars. Moreover, the rise of health and wellness trends is driving demand for bars targeting specific dietary needs and preferences, like gluten-free or vegan options. Competitive intensity is high, with both established multinational companies and smaller, regional players competing for market share. Companies are focusing on branding, marketing, and product differentiation to stand out in this increasingly crowded marketplace. Expansion into untapped markets within the region, along with strategic product development and diversification, represent crucial factors determining success in this dynamic market segment.
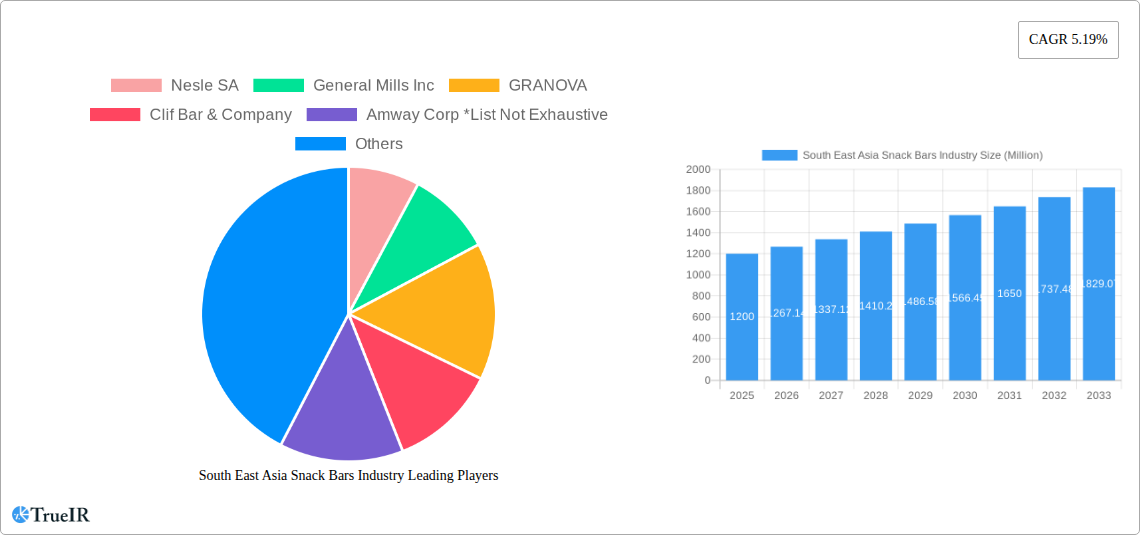
South East Asia Snack Bars Industry Company Market Share
South East Asia Snack Bars Industry: A Comprehensive Market Report (2019-2033)
This dynamic report provides an in-depth analysis of the South East Asia snack bars industry, offering invaluable insights for businesses, investors, and stakeholders. Leveraging extensive market research and data analysis conducted over the study period (2019-2024) with a focus on the base year 2025 and a forecast period extending to 2033, this report delivers a comprehensive understanding of current market dynamics and future growth potential. The report features a detailed competitive landscape, examines key market segments, and identifies critical growth drivers and challenges. With a market valued at xx Million in 2025, this report is an essential resource for navigating the complexities of this rapidly evolving market.
South East Asia Snack Bars Industry Market Structure & Competitive Landscape
The South East Asia snack bar market is characterized by a moderately concentrated landscape, with a few large multinational players and a significant number of smaller, regional brands. The Herfindahl-Hirschman Index (HHI) for the industry in 2025 is estimated at xx, indicating a moderately competitive market. Innovation is a key driver, with companies constantly launching new products with functional ingredients and innovative flavors to cater to evolving consumer preferences. Government regulations, particularly those related to sugar and fat content, are also playing a significant role in shaping the market structure. Product substitutes, such as fresh fruit and other convenient snacks, represent a competitive threat. The end-user segmentation is diverse, encompassing various age groups and lifestyles. Mergers and acquisitions (M&A) activity is moderate, with approximately xx M&A deals recorded in the historical period (2019-2024), primarily driven by strategies to expand market share and access new technologies.
- Market Concentration: HHI of xx in 2025.
- Innovation Drivers: New product launches, functional ingredients, innovative flavors.
- Regulatory Impacts: Sugar and fat content regulations.
- Product Substitutes: Fresh fruit, other convenient snacks.
- End-User Segmentation: Diverse age groups and lifestyles.
- M&A Trends: Approx. xx M&A deals (2019-2024).
South East Asia Snack Bars Industry Market Trends & Opportunities
The South East Asia snack bars market is experiencing robust growth, driven by several key factors. The market size is projected to reach xx Million by 2033, exhibiting a Compound Annual Growth Rate (CAGR) of xx% during the forecast period (2025-2033). This growth is fueled by increasing health consciousness among consumers, rising disposable incomes, and the increasing popularity of convenient and on-the-go snacking options. Technological advancements, such as improved packaging and manufacturing processes, are also contributing to market expansion. Consumer preferences are shifting towards healthier and more functional snack bars, creating opportunities for brands offering products with added vitamins, minerals, and protein. The market is also witnessing increased competition, with both established players and new entrants vying for market share. Market penetration rates vary significantly across different segments and countries within South East Asia, with higher penetration in urban areas compared to rural regions.
Dominant Markets & Segments in South East Asia Snack Bars Industry
The dominant market segments within the South East Asia snack bars industry are currently the Hypermarket/Supermarket distribution channel and the Cereal Bar product type.
By Distribution Channel:
- Hypermarket/Supermarket: This channel accounts for the largest share of the market due to widespread accessibility and established supply chains. Growth is driven by the increasing number of hypermarkets and supermarkets across the region.
- Online Stores: Experiencing rapid growth fueled by rising e-commerce penetration and consumer preference for convenience.
- Convenience Stores: A significant channel, particularly in urban areas, benefiting from high foot traffic and impulse purchases.
- Other Distribution Channels: Include smaller retailers, direct-to-consumer sales, and food service channels, representing a niche but growing market segment.
By Product Type:
- Cereal Bar: This is currently the leading product type due to its wide appeal and affordability. Growth is driven by innovation in flavors and the inclusion of functional ingredients.
- Energy Bar: A significant segment catering to health-conscious consumers and fitness enthusiasts. Growth is driven by increasing demand for convenient energy sources.
- Other Snack Bars: This includes a diverse range of products, including fruit and nut bars, protein bars, and specialty bars. Growth is driven by the diversification of consumer preferences.
Key Growth Drivers:
- Expanding retail infrastructure in major cities
- Increasing disposable incomes, particularly in emerging economies
- Favorable government policies supporting the food processing industry.
South East Asia Snack Bars Industry Product Analysis
Snack bar innovation is heavily focused on incorporating functional ingredients like protein, fiber, and vitamins to cater to health-conscious consumers. Product differentiation is achieved through unique flavor combinations and the use of organic or sustainably sourced ingredients. The market sees a strong emphasis on convenient packaging, such as single-serve options and resealable pouches. The key competitive advantages lie in brand recognition, product quality, and effective marketing strategies. Technological advancements in manufacturing processes allow for improved efficiency and reduced production costs.
Key Drivers, Barriers & Challenges in South East Asia Snack Bars Industry
Key Drivers:
- Rising disposable incomes and changing lifestyles are driving increased demand for convenient snack options.
- Growing health awareness is pushing demand for healthier snack bars with functional ingredients.
- Technological advancements improve production efficiency and product innovation.
Key Challenges:
- Intense competition from established and new entrants is pressuring profit margins. This is resulting in a xx% reduction in average profit margins across the sector in the past five years.
- Stringent government regulations on sugar and fat content increase production costs and limit product development options.
- Supply chain disruptions due to geopolitical instability and the COVID-19 pandemic are impacting production and distribution.
Growth Drivers in the South East Asia Snack Bars Industry Market
The growth of the South East Asia snack bars market is propelled by factors like rising disposable incomes, changing lifestyles favoring convenient food, and a growing preference for health-conscious snacks. Technological advancements in manufacturing and packaging enhance efficiency and innovation, furthering market expansion. Government initiatives to promote the food processing sector also contribute to the industry's growth.
Challenges Impacting South East Asia Snack Bars Industry Growth
Challenges impacting growth include intense competition, stringent food safety regulations, fluctuating raw material prices affecting production costs, and the need for innovative marketing strategies to reach a diverse consumer base. Supply chain vulnerabilities and evolving consumer preferences also pose significant challenges for market players.
Key Players Shaping the South East Asia Snack Bars Industry Market
- Nesle SA
- General Mills Inc
- GRANOVA
- Clif Bar & Company
- Amway Corp
- KIND LLC
- The Hut com Limited (Myprotein)
- Kellogg Company
- General Nutrition Centers Inc
- PRISTINE (Yogood)
Significant South East Asia Snack Bars Industry Industry Milestones
- 2020: Several major players launched new snack bars with increased protein content and added functional ingredients.
- 2021: Government regulations on sugar content came into effect in several key markets, impacting product formulations.
- 2022: Increased focus on sustainable packaging and ethical sourcing initiatives among leading brands.
- 2023: Strategic partnership between two key players led to expansion into new regional markets.
- 2024: A significant acquisition broadened the product portfolio of a leading snack bar manufacturer.
Future Outlook for South East Asia Snack Bars Industry Market
The South East Asia snack bars market is poised for continued growth, driven by sustained economic development, evolving consumer preferences, and ongoing innovation in product development and marketing. Strategic partnerships and acquisitions will likely shape the competitive landscape, while a focus on sustainability and ethical sourcing will gain increasing importance. Companies that effectively adapt to changing consumer demands and regulatory environments will be well-positioned to capitalize on future opportunities within this dynamic market.
South East Asia Snack Bars Industry Segmentation
-
1. Product Type
-
1.1. Cereal Bar
- 1.1.1. Granola/Muesli Bars
- 1.1.2. Other Cereal Bars
- 1.2. Energy Bar
- 1.3. Other Snack Bars
-
1.1. Cereal Bar
-
2. Distribution Channel
- 2.1. Hypermarket/Supermarket
- 2.2. Online Stores
- 2.3. Convenience Stores
- 2.4. Other Distribution Channels
-
3. Countires
- 3.1. Indonesia
- 3.2. Malaysia
- 3.3. Myanmar
- 3.4. Philippines
- 3.5. Singapore
- 3.6. Thailand
- 3.7. Vietnam
- 3.8. Rest of South East Asia
South East Asia Snack Bars Industry Segmentation By Geography
-
1. South East Asia
- 1.1. Indonesia
- 1.2. Malaysia
- 1.3. Singapore
- 1.4. Thailand
- 1.5. Vietnam
- 1.6. Philippines
- 1.7. Myanmar
- 1.8. Cambodia
- 1.9. Laos
South East Asia Snack Bars Industry Regional Market Share
Geographic Coverage of South East Asia Snack Bars Industry
South East Asia Snack Bars Industry REPORT HIGHLIGHTS
| Aspects | Details |
|---|---|
| Study Period | 2020-2034 |
| Base Year | 2025 |
| Estimated Year | 2026 |
| Forecast Period | 2026-2034 |
| Historical Period | 2020-2025 |
| Growth Rate | CAGR of 5.19% from 2020-2034 |
| Segmentation |
|
Table of Contents
- 1. Introduction
- 1.1. Research Scope
- 1.2. Market Segmentation
- 1.3. Research Methodology
- 1.4. Definitions and Assumptions
- 2. Executive Summary
- 2.1. Introduction
- 3. Market Dynamics
- 3.1. Introduction
- 3.2. Market Drivers
- 3.2.1. Increasing application of Gelatin in healthcare and pharmaceutical sector
- 3.3. Market Restrains
- 3.3.1. Rising demand for clean label products
- 3.4. Market Trends
- 3.4.1. Propensity to Consume Convenient and Healthy On-the-go Meal and Snack Options
- 4. Market Factor Analysis
- 4.1. Porters Five Forces
- 4.2. Supply/Value Chain
- 4.3. PESTEL analysis
- 4.4. Market Entropy
- 4.5. Patent/Trademark Analysis
- 5. South East Asia Snack Bars Industry Analysis, Insights and Forecast, 2020-2032
- 5.1. Market Analysis, Insights and Forecast - by Product Type
- 5.1.1. Cereal Bar
- 5.1.1.1. Granola/Muesli Bars
- 5.1.1.2. Other Cereal Bars
- 5.1.2. Energy Bar
- 5.1.3. Other Snack Bars
- 5.1.1. Cereal Bar
- 5.2. Market Analysis, Insights and Forecast - by Distribution Channel
- 5.2.1. Hypermarket/Supermarket
- 5.2.2. Online Stores
- 5.2.3. Convenience Stores
- 5.2.4. Other Distribution Channels
- 5.3. Market Analysis, Insights and Forecast - by Countires
- 5.3.1. Indonesia
- 5.3.2. Malaysia
- 5.3.3. Myanmar
- 5.3.4. Philippines
- 5.3.5. Singapore
- 5.3.6. Thailand
- 5.3.7. Vietnam
- 5.3.8. Rest of South East Asia
- 5.4. Market Analysis, Insights and Forecast - by Region
- 5.4.1. South East Asia
- 5.1. Market Analysis, Insights and Forecast - by Product Type
- 6. China South East Asia Snack Bars Industry Analysis, Insights and Forecast, 2020-2032
- 7. Japan South East Asia Snack Bars Industry Analysis, Insights and Forecast, 2020-2032
- 8. India South East Asia Snack Bars Industry Analysis, Insights and Forecast, 2020-2032
- 9. South Korea South East Asia Snack Bars Industry Analysis, Insights and Forecast, 2020-2032
- 10. Taiwan South East Asia Snack Bars Industry Analysis, Insights and Forecast, 2020-2032
- 11. Australia South East Asia Snack Bars Industry Analysis, Insights and Forecast, 2020-2032
- 12. Rest of Asia-Pacific South East Asia Snack Bars Industry Analysis, Insights and Forecast, 2020-2032
- 13. Competitive Analysis
- 13.1. Market Share Analysis 2025
- 13.2. Company Profiles
- 13.2.1 Nesle SA
- 13.2.1.1. Overview
- 13.2.1.2. Products
- 13.2.1.3. SWOT Analysis
- 13.2.1.4. Recent Developments
- 13.2.1.5. Financials (Based on Availability)
- 13.2.2 General Mills Inc
- 13.2.2.1. Overview
- 13.2.2.2. Products
- 13.2.2.3. SWOT Analysis
- 13.2.2.4. Recent Developments
- 13.2.2.5. Financials (Based on Availability)
- 13.2.3 GRANOVA
- 13.2.3.1. Overview
- 13.2.3.2. Products
- 13.2.3.3. SWOT Analysis
- 13.2.3.4. Recent Developments
- 13.2.3.5. Financials (Based on Availability)
- 13.2.4 Clif Bar & Company
- 13.2.4.1. Overview
- 13.2.4.2. Products
- 13.2.4.3. SWOT Analysis
- 13.2.4.4. Recent Developments
- 13.2.4.5. Financials (Based on Availability)
- 13.2.5 Amway Corp *List Not Exhaustive
- 13.2.5.1. Overview
- 13.2.5.2. Products
- 13.2.5.3. SWOT Analysis
- 13.2.5.4. Recent Developments
- 13.2.5.5. Financials (Based on Availability)
- 13.2.6 KIND LLC
- 13.2.6.1. Overview
- 13.2.6.2. Products
- 13.2.6.3. SWOT Analysis
- 13.2.6.4. Recent Developments
- 13.2.6.5. Financials (Based on Availability)
- 13.2.7 The Hut com Limited (Myprotein)
- 13.2.7.1. Overview
- 13.2.7.2. Products
- 13.2.7.3. SWOT Analysis
- 13.2.7.4. Recent Developments
- 13.2.7.5. Financials (Based on Availability)
- 13.2.8 Kellogg Company
- 13.2.8.1. Overview
- 13.2.8.2. Products
- 13.2.8.3. SWOT Analysis
- 13.2.8.4. Recent Developments
- 13.2.8.5. Financials (Based on Availability)
- 13.2.9 General Nutrition Centers Inc
- 13.2.9.1. Overview
- 13.2.9.2. Products
- 13.2.9.3. SWOT Analysis
- 13.2.9.4. Recent Developments
- 13.2.9.5. Financials (Based on Availability)
- 13.2.10 PRISTINE (Yogood)
- 13.2.10.1. Overview
- 13.2.10.2. Products
- 13.2.10.3. SWOT Analysis
- 13.2.10.4. Recent Developments
- 13.2.10.5. Financials (Based on Availability)
- 13.2.1 Nesle SA
List of Figures
- Figure 1: South East Asia Snack Bars Industry Revenue Breakdown (Million, %) by Product 2025 & 2033
- Figure 2: South East Asia Snack Bars Industry Share (%) by Company 2025
List of Tables
- Table 1: South East Asia Snack Bars Industry Revenue Million Forecast, by Region 2020 & 2033
- Table 2: South East Asia Snack Bars Industry Volume K Tons Forecast, by Region 2020 & 2033
- Table 3: South East Asia Snack Bars Industry Revenue Million Forecast, by Product Type 2020 & 2033
- Table 4: South East Asia Snack Bars Industry Volume K Tons Forecast, by Product Type 2020 & 2033
- Table 5: South East Asia Snack Bars Industry Revenue Million Forecast, by Distribution Channel 2020 & 2033
- Table 6: South East Asia Snack Bars Industry Volume K Tons Forecast, by Distribution Channel 2020 & 2033
- Table 7: South East Asia Snack Bars Industry Revenue Million Forecast, by Countires 2020 & 2033
- Table 8: South East Asia Snack Bars Industry Volume K Tons Forecast, by Countires 2020 & 2033
- Table 9: South East Asia Snack Bars Industry Revenue Million Forecast, by Region 2020 & 2033
- Table 10: South East Asia Snack Bars Industry Volume K Tons Forecast, by Region 2020 & 2033
- Table 11: South East Asia Snack Bars Industry Revenue Million Forecast, by Country 2020 & 2033
- Table 12: South East Asia Snack Bars Industry Volume K Tons Forecast, by Country 2020 & 2033
- Table 13: China South East Asia Snack Bars Industry Revenue (Million) Forecast, by Application 2020 & 2033
- Table 14: China South East Asia Snack Bars Industry Volume (K Tons) Forecast, by Application 2020 & 2033
- Table 15: Japan South East Asia Snack Bars Industry Revenue (Million) Forecast, by Application 2020 & 2033
- Table 16: Japan South East Asia Snack Bars Industry Volume (K Tons) Forecast, by Application 2020 & 2033
- Table 17: India South East Asia Snack Bars Industry Revenue (Million) Forecast, by Application 2020 & 2033
- Table 18: India South East Asia Snack Bars Industry Volume (K Tons) Forecast, by Application 2020 & 2033
- Table 19: South Korea South East Asia Snack Bars Industry Revenue (Million) Forecast, by Application 2020 & 2033
- Table 20: South Korea South East Asia Snack Bars Industry Volume (K Tons) Forecast, by Application 2020 & 2033
- Table 21: Taiwan South East Asia Snack Bars Industry Revenue (Million) Forecast, by Application 2020 & 2033
- Table 22: Taiwan South East Asia Snack Bars Industry Volume (K Tons) Forecast, by Application 2020 & 2033
- Table 23: Australia South East Asia Snack Bars Industry Revenue (Million) Forecast, by Application 2020 & 2033
- Table 24: Australia South East Asia Snack Bars Industry Volume (K Tons) Forecast, by Application 2020 & 2033
- Table 25: Rest of Asia-Pacific South East Asia Snack Bars Industry Revenue (Million) Forecast, by Application 2020 & 2033
- Table 26: Rest of Asia-Pacific South East Asia Snack Bars Industry Volume (K Tons) Forecast, by Application 2020 & 2033
- Table 27: South East Asia Snack Bars Industry Revenue Million Forecast, by Product Type 2020 & 2033
- Table 28: South East Asia Snack Bars Industry Volume K Tons Forecast, by Product Type 2020 & 2033
- Table 29: South East Asia Snack Bars Industry Revenue Million Forecast, by Distribution Channel 2020 & 2033
- Table 30: South East Asia Snack Bars Industry Volume K Tons Forecast, by Distribution Channel 2020 & 2033
- Table 31: South East Asia Snack Bars Industry Revenue Million Forecast, by Countires 2020 & 2033
- Table 32: South East Asia Snack Bars Industry Volume K Tons Forecast, by Countires 2020 & 2033
- Table 33: South East Asia Snack Bars Industry Revenue Million Forecast, by Country 2020 & 2033
- Table 34: South East Asia Snack Bars Industry Volume K Tons Forecast, by Country 2020 & 2033
- Table 35: Indonesia South East Asia Snack Bars Industry Revenue (Million) Forecast, by Application 2020 & 2033
- Table 36: Indonesia South East Asia Snack Bars Industry Volume (K Tons) Forecast, by Application 2020 & 2033
- Table 37: Malaysia South East Asia Snack Bars Industry Revenue (Million) Forecast, by Application 2020 & 2033
- Table 38: Malaysia South East Asia Snack Bars Industry Volume (K Tons) Forecast, by Application 2020 & 2033
- Table 39: Singapore South East Asia Snack Bars Industry Revenue (Million) Forecast, by Application 2020 & 2033
- Table 40: Singapore South East Asia Snack Bars Industry Volume (K Tons) Forecast, by Application 2020 & 2033
- Table 41: Thailand South East Asia Snack Bars Industry Revenue (Million) Forecast, by Application 2020 & 2033
- Table 42: Thailand South East Asia Snack Bars Industry Volume (K Tons) Forecast, by Application 2020 & 2033
- Table 43: Vietnam South East Asia Snack Bars Industry Revenue (Million) Forecast, by Application 2020 & 2033
- Table 44: Vietnam South East Asia Snack Bars Industry Volume (K Tons) Forecast, by Application 2020 & 2033
- Table 45: Philippines South East Asia Snack Bars Industry Revenue (Million) Forecast, by Application 2020 & 2033
- Table 46: Philippines South East Asia Snack Bars Industry Volume (K Tons) Forecast, by Application 2020 & 2033
- Table 47: Myanmar South East Asia Snack Bars Industry Revenue (Million) Forecast, by Application 2020 & 2033
- Table 48: Myanmar South East Asia Snack Bars Industry Volume (K Tons) Forecast, by Application 2020 & 2033
- Table 49: Cambodia South East Asia Snack Bars Industry Revenue (Million) Forecast, by Application 2020 & 2033
- Table 50: Cambodia South East Asia Snack Bars Industry Volume (K Tons) Forecast, by Application 2020 & 2033
- Table 51: Laos South East Asia Snack Bars Industry Revenue (Million) Forecast, by Application 2020 & 2033
- Table 52: Laos South East Asia Snack Bars Industry Volume (K Tons) Forecast, by Application 2020 & 2033
Frequently Asked Questions
1. What is the projected Compound Annual Growth Rate (CAGR) of the South East Asia Snack Bars Industry?
The projected CAGR is approximately 5.19%.
2. Which companies are prominent players in the South East Asia Snack Bars Industry?
Key companies in the market include Nesle SA, General Mills Inc, GRANOVA, Clif Bar & Company, Amway Corp *List Not Exhaustive, KIND LLC, The Hut com Limited (Myprotein), Kellogg Company, General Nutrition Centers Inc, PRISTINE (Yogood).
3. What are the main segments of the South East Asia Snack Bars Industry?
The market segments include Product Type, Distribution Channel, Countires.
4. Can you provide details about the market size?
The market size is estimated to be USD 1200 Million as of 2022.
5. What are some drivers contributing to market growth?
Increasing application of Gelatin in healthcare and pharmaceutical sector.
6. What are the notable trends driving market growth?
Propensity to Consume Convenient and Healthy On-the-go Meal and Snack Options.
7. Are there any restraints impacting market growth?
Rising demand for clean label products.
8. Can you provide examples of recent developments in the market?
New product launches with functional ingredients and innovative flavors
9. What pricing options are available for accessing the report?
Pricing options include single-user, multi-user, and enterprise licenses priced at USD 4750, USD 4950, and USD 6800 respectively.
10. Is the market size provided in terms of value or volume?
The market size is provided in terms of value, measured in Million and volume, measured in K Tons.
11. Are there any specific market keywords associated with the report?
Yes, the market keyword associated with the report is "South East Asia Snack Bars Industry," which aids in identifying and referencing the specific market segment covered.
12. How do I determine which pricing option suits my needs best?
The pricing options vary based on user requirements and access needs. Individual users may opt for single-user licenses, while businesses requiring broader access may choose multi-user or enterprise licenses for cost-effective access to the report.
13. Are there any additional resources or data provided in the South East Asia Snack Bars Industry report?
While the report offers comprehensive insights, it's advisable to review the specific contents or supplementary materials provided to ascertain if additional resources or data are available.
14. How can I stay updated on further developments or reports in the South East Asia Snack Bars Industry?
To stay informed about further developments, trends, and reports in the South East Asia Snack Bars Industry, consider subscribing to industry newsletters, following relevant companies and organizations, or regularly checking reputable industry news sources and publications.
Methodology
Step 1 - Identification of Relevant Samples Size from Population Database


Step 2 - Approaches for Defining Global Market Size (Value, Volume* & Price*)

Note*: In applicable scenarios
Step 3 - Data Sources
Primary Research
- Web Analytics
- Survey Reports
- Research Institute
- Latest Research Reports
- Opinion Leaders
Secondary Research
- Annual Reports
- White Paper
- Latest Press Release
- Industry Association
- Paid Database
- Investor Presentations

Step 4 - Data Triangulation
Involves using different sources of information in order to increase the validity of a study
These sources are likely to be stakeholders in a program - participants, other researchers, program staff, other community members, and so on.
Then we put all data in single framework & apply various statistical tools to find out the dynamic on the market.
During the analysis stage, feedback from the stakeholder groups would be compared to determine areas of agreement as well as areas of divergence
