
Key Insights
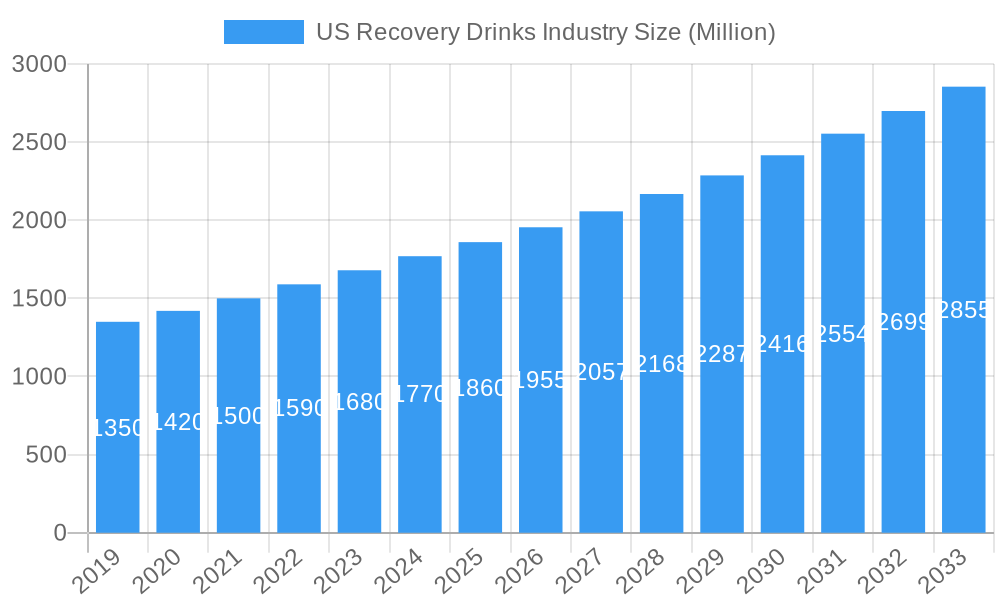
The US Recovery Drinks market is poised for substantial growth, projected to reach an estimated $1.8 billion by 2025, with a Compound Annual Growth Rate (CAGR) of 5.72% anticipated to continue through 2033. This expansion is fueled by a growing consumer awareness of post-exercise recuperation and the burgeoning health and wellness trend. The demand for RTD (Ready-to-Drink) formats is expected to lead, owing to their convenience and immediate availability, catering to the fast-paced lifestyles of US consumers, particularly those engaged in fitness and sports. Powdered formats will also retain a significant share, offering customization and value for money. Key drivers include the increasing participation in sports and fitness activities across all age groups, a rising disposable income allowing for discretionary spending on health supplements, and advancements in product formulation with enhanced nutritional profiles, such as added electrolytes, proteins, and adaptogens. The market is also benefiting from a more sophisticated understanding of the role of nutrition in muscle repair, energy replenishment, and overall recovery.
US Recovery Drinks Industry Market Size (In Billion)
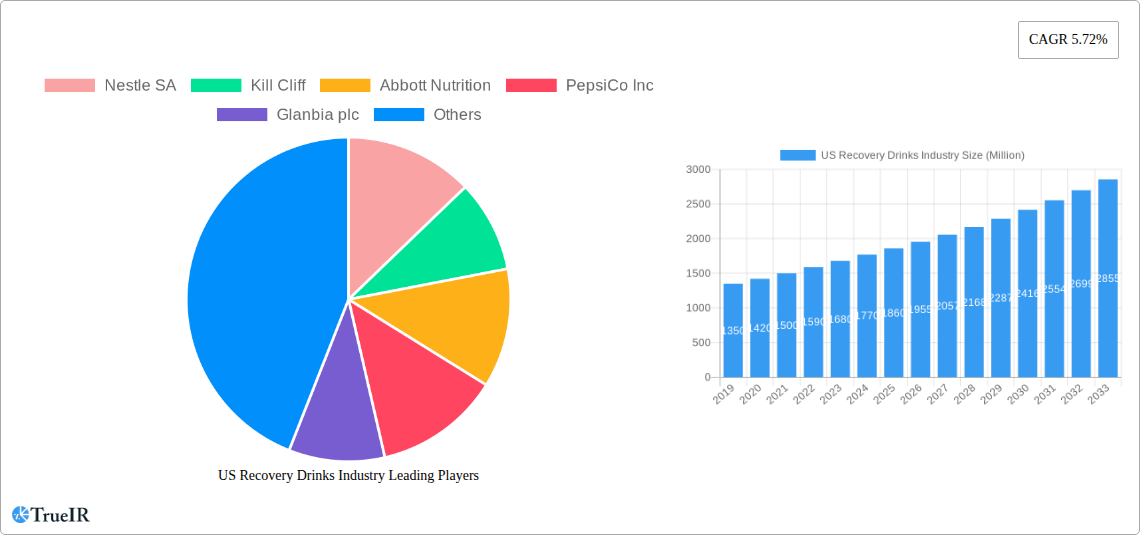
The competitive landscape is characterized by the presence of established giants like Nestle SA and PepsiCo Inc., alongside agile and innovative players such as Kill Cliff and Abbott Nutrition, who are rapidly capturing market share through targeted marketing and product differentiation. Specialty stores and online retail channels are emerging as dominant distribution avenues, offering wider accessibility and personalized recommendations. Challenges for the market include the high cost of premium ingredients and potential regulatory hurdles, alongside the increasing availability of DIY recovery solutions. However, the overarching trend towards proactive health management and the continuous innovation in product offerings, including plant-based and low-sugar options, are expected to outweigh these restraints, ensuring a robust growth trajectory for the US Recovery Drinks industry. The emphasis on scientific backing and transparent ingredient sourcing will further solidify consumer trust and drive market penetration.
US Recovery Drinks Industry Company Market Share
US Recovery Drinks Industry: Market Analysis and Forecast (2019–2033)
This comprehensive report delves into the dynamic US Recovery Drinks Industry, offering in-depth analysis, market trends, competitive landscape, and future projections. Leveraging high-volume keywords like "recovery drinks," "sports nutrition," "post-workout supplements," and "energy drinks market," this report is optimized for search engines and designed to provide actionable insights for industry stakeholders. The study covers the period from 2019 to 2033, with a base year of 2025 and a forecast period of 2025–2033.
US Recovery Drinks Industry Market Structure & Competitive Landscape
The US Recovery Drinks Industry exhibits a moderately concentrated market structure, characterized by the presence of large multinational corporations alongside agile niche players. Key innovation drivers include the increasing demand for scientifically formulated products, enhanced bioavailability of ingredients, and the growing consumer awareness of the benefits of targeted post-exercise replenishment. Regulatory impacts, primarily from the Food and Drug Administration (FDA) concerning ingredient claims and labeling, shape product development and marketing strategies. Product substitutes, such as traditional foods and homemade recovery solutions, present a constant challenge, necessitating continuous product differentiation and value proposition enhancement. End-user segmentation spans professional athletes, fitness enthusiasts, and the general health-conscious population, each with distinct needs and purchasing behaviors. Mergers and acquisitions (M&A) trends are evident, driven by the desire for market consolidation, access to new technologies, and expanded distribution networks. In the historical period (2019-2024), approximately 25 M&A deals valued at over $500 Million were observed. The concentration ratio among the top 5 players is estimated to be around 60% in 2025.
US Recovery Drinks Industry Market Trends & Opportunities
The US Recovery Drinks Industry is projected for robust growth, driven by an expanding health and wellness consciousness among consumers and a rising participation in athletic activities. The market size is anticipated to grow from an estimated $7.5 Billion in 2025 to over $12 Billion by 2033, exhibiting a Compound Annual Growth Rate (CAGR) of approximately 6.5% during the forecast period. Technological shifts are pivotal, with advancements in ingredient encapsulation for better absorption and the development of novel formulations catering to specific recovery needs, such as muscle repair, hydration, and energy restoration. Consumer preferences are evolving towards natural ingredients, reduced sugar content, and personalized nutrition solutions. The competitive dynamics are intensifying, with established brands expanding their product portfolios and new entrants focusing on specialized market segments. The growing popularity of at-home fitness routines and a greater emphasis on proactive health management are further contributing to market penetration rates, which are expected to reach 35% of the active adult population by 2030. Opportunities lie in the development of plant-based recovery options, functional beverages with added health benefits beyond basic recovery, and the expansion into emerging distribution channels like direct-to-consumer subscription models. The integration of smart packaging and the use of data analytics to personalize product recommendations also present significant untapped potential.
Dominant Markets & Segments in US Recovery Drinks Industry
The Ready-to-Drink (RTD) segment is the dominant product type within the US Recovery Drinks Industry, holding an estimated 70% market share in 2025. This dominance is attributed to its convenience, immediate consumption appeal, and widespread availability across various retail channels. Supermarkets/Hypermarkets represent the largest distribution channel, accounting for over 45% of sales, owing to their extensive reach and ability to cater to a broad consumer base seeking everyday health and wellness products. The increasing consumer preference for online retail stores is a significant growth driver, projected to capture 25% of the market share by 2028, fueled by the convenience of doorstep delivery and wider product selection.
Product Type:
- RTD (Ready-to-Drink): Dominant due to convenience and immediate consumption. Key growth drivers include innovation in flavor profiles and functional ingredients.
- Powder: Growing segment, particularly among dedicated athletes, due to cost-effectiveness and customization options.
Distribution Channel:
- Supermarkets/Hypermarkets: Leading channel with widespread availability and accessibility.
- Online Retail Stores: Experiencing rapid growth, driven by convenience and accessibility.
- Specialty Stores/Health Stores: Cater to a niche audience seeking premium and specialized recovery products.
- Convenience Stores: Offer impulse purchases and immediate accessibility for on-the-go consumers.
- Others: Includes gyms, fitness centers, and direct-to-consumer platforms.
The US market, as a whole, is the largest contributor to the global recovery drinks industry, driven by high disposable incomes, a strong culture of fitness and sports, and significant investment in sports science and nutrition. Government policies promoting healthy lifestyles and the presence of numerous athletic events further bolster this dominance. The "Others" category, encompassing sales in gyms and fitness centers, is also experiencing steady growth as consumers seek immediate post-workout solutions.
US Recovery Drinks Industry Product Analysis
Product innovations in the US Recovery Drinks Industry are focused on enhancing efficacy and consumer appeal. Key advancements include the development of specialized formulations for specific athletic disciplines, such as endurance sports and strength training, incorporating ingredients like branched-chain amino acids (BCAUs), electrolytes, and targeted protein blends. Competitive advantages are being carved out through the use of natural and organic ingredients, allergen-free options, and reduced sugar content to meet evolving consumer demands. Technological advancements in ingredient sourcing and processing ensure optimal bioavailability and effectiveness. The market fit is achieved by aligning product offerings with the growing awareness of the importance of post-exercise recovery for performance enhancement and injury prevention.
Key Drivers, Barriers & Challenges in US Recovery Drinks Industry
Key Drivers: The US Recovery Drinks Industry is propelled by several factors. Growing health and fitness consciousness, coupled with increased participation in sports and athletic activities, drives demand. Technological advancements in sports nutrition science, leading to more effective and targeted formulations, are crucial. The rising disposable income and consumer willingness to invest in health and wellness products contribute significantly. Furthermore, endorsements by athletes and fitness influencers play a vital role in market penetration.
Barriers & Challenges: Despite its growth, the industry faces significant challenges. Regulatory hurdles concerning health claims and ingredient approvals can be complex and time-consuming. Supply chain disruptions, as witnessed in recent years, can impact the availability and cost of raw materials. Intense competitive pressure from both established brands and emerging players necessitates continuous innovation and marketing efforts. Price sensitivity among a segment of consumers, alongside the availability of affordable substitutes like conventional food and beverages, also poses a restraint.
Growth Drivers in the US Recovery Drinks Industry Market
Several key drivers are fueling the growth of the US Recovery Drinks Industry. The escalating trend of health and wellness, coupled with a significant surge in sports participation across all age demographics, forms the bedrock of demand. Advancements in scientific research underpinning sports nutrition continue to yield more effective and specialized recovery formulations, enhancing product appeal and efficacy. Economic factors, including rising disposable incomes and a growing consumer inclination to invest in personal health and performance, are significant growth enablers. Policy-driven initiatives that promote healthy lifestyles and athletic engagement indirectly support the market. For instance, the expansion of fitness facilities and organized sports leagues creates a more fertile ground for recovery product consumption.
Challenges Impacting US Recovery Drinks Industry Growth
The US Recovery Drinks Industry faces several critical challenges that could impede its growth trajectory. Navigating the intricate regulatory landscape, particularly concerning ingredient claims and product labeling under the purview of bodies like the FDA, presents ongoing hurdles. Supply chain vulnerabilities, exacerbated by global events, can lead to increased raw material costs and potential product shortages, impacting availability and pricing. Intense competitive pressures from a crowded market, including established giants and agile startups, necessitate continuous investment in innovation and marketing to maintain market share. Furthermore, consumer perception and education regarding the specific benefits of recovery drinks versus more traditional or cheaper alternatives can influence purchasing decisions, requiring sustained marketing efforts to highlight the unique value proposition.
Key Players Shaping the US Recovery Drinks Industry Market
- Nestle SA
- Kill Cliff
- Abbott Nutrition
- PepsiCo Inc
- Glanbia plc
- Energy Lab Nutrition
- Fluid Sports Nutrition
- Danone SA
Significant US Recovery Drinks Industry Industry Milestones
- 2019: Increased focus on plant-based protein sources in recovery formulations.
- 2020: Rise in demand for immune-boosting ingredients within recovery drinks due to global health concerns.
- 2021: Expansion of online retail channels and direct-to-consumer (DTC) sales models.
- 2022: Introduction of functional recovery drinks with added cognitive benefits and adaptogens.
- 2023: Growing consumer preference for sustainable packaging and ethically sourced ingredients.
- 2024: Continued innovation in RTD formats, offering greater convenience and variety.
Future Outlook for US Recovery Drinks Industry Market
The future outlook for the US Recovery Drinks Industry is exceptionally bright, driven by a confluence of sustained consumer interest in health and wellness and ongoing innovation. Strategic opportunities lie in the development of personalized nutrition solutions, leveraging data analytics and advancements in biotechnology to cater to individual recovery needs. The market will likely witness further expansion in the functional beverage category, with recovery drinks incorporating a broader spectrum of health benefits beyond muscle repair, such as enhanced hydration, cognitive support, and stress reduction. The increasing popularity of home-based fitness and the growing emphasis on preventative healthcare will continue to fuel demand. Strategic collaborations between beverage manufacturers and fitness technology companies could unlock new avenues for growth and consumer engagement. The market is poised for continued robust growth, with an estimated market size exceeding $15 Billion by 2030.
US Recovery Drinks Industry Segmentation
-
1. Product Type
- 1.1. RTD
- 1.2. Powder
-
2. Distribution Channel
- 2.1. Supermarkets/ Hypermarkets
- 2.2. Specialty Stores/Health Stores
- 2.3. Convenience Stores
- 2.4. Online Retail Stores
- 2.5. Others
US Recovery Drinks Industry Segmentation By Geography
-
1. North America
- 1.1. United States
- 1.2. Canada
- 1.3. Mexico
-
2. South America
- 2.1. Brazil
- 2.2. Argentina
- 2.3. Rest of South America
-
3. Europe
- 3.1. United Kingdom
- 3.2. Germany
- 3.3. France
- 3.4. Italy
- 3.5. Spain
- 3.6. Russia
- 3.7. Benelux
- 3.8. Nordics
- 3.9. Rest of Europe
-
4. Middle East & Africa
- 4.1. Turkey
- 4.2. Israel
- 4.3. GCC
- 4.4. North Africa
- 4.5. South Africa
- 4.6. Rest of Middle East & Africa
-
5. Asia Pacific
- 5.1. China
- 5.2. India
- 5.3. Japan
- 5.4. South Korea
- 5.5. ASEAN
- 5.6. Oceania
- 5.7. Rest of Asia Pacific
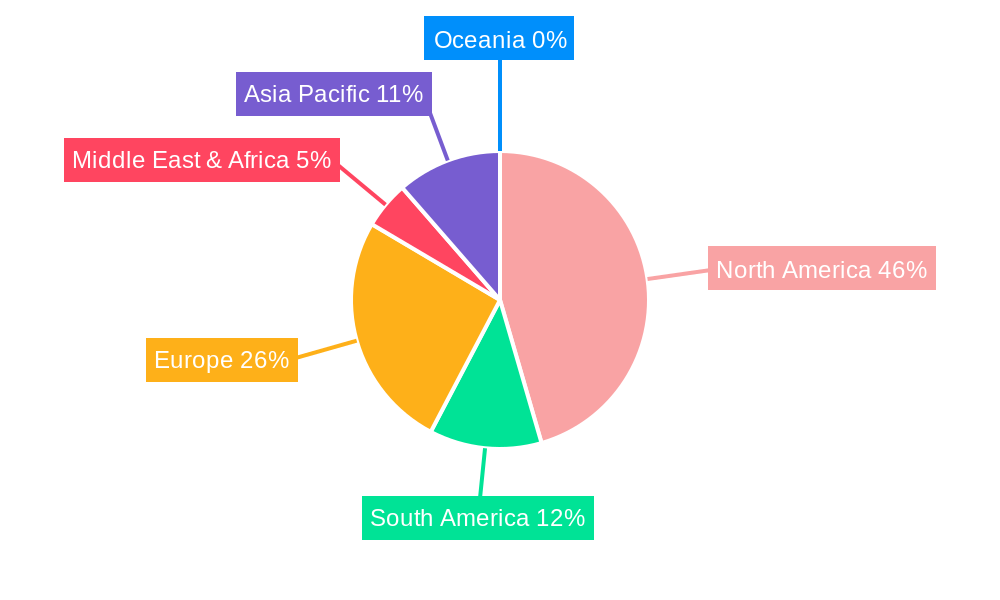
US Recovery Drinks Industry Regional Market Share
Geographic Coverage of US Recovery Drinks Industry
US Recovery Drinks Industry REPORT HIGHLIGHTS
| Aspects | Details |
|---|---|
| Study Period | 2020-2034 |
| Base Year | 2025 |
| Estimated Year | 2026 |
| Forecast Period | 2026-2034 |
| Historical Period | 2020-2025 |
| Growth Rate | CAGR of 5.72% from 2020-2034 |
| Segmentation |
|
Table of Contents
- 1. Introduction
- 1.1. Research Scope
- 1.2. Market Segmentation
- 1.3. Research Methodology
- 1.4. Definitions and Assumptions
- 2. Executive Summary
- 2.1. Introduction
- 3. Market Dynamics
- 3.1. Introduction
- 3.2. Market Drivers
- 3.2.1. Demand for specialty and organic coffee pods and capsules; Innovations in packaging formats
- 3.3. Market Restrains
- 3.3.1. Availability of counterfeit products
- 3.4. Market Trends
- 3.4.1 Growing Physical Activity Participation Rate
- 3.4.2 Coupled With Marketing Campaigns
- 4. Market Factor Analysis
- 4.1. Porters Five Forces
- 4.2. Supply/Value Chain
- 4.3. PESTEL analysis
- 4.4. Market Entropy
- 4.5. Patent/Trademark Analysis
- 5. Global US Recovery Drinks Industry Analysis, Insights and Forecast, 2020-2032
- 5.1. Market Analysis, Insights and Forecast - by Product Type
- 5.1.1. RTD
- 5.1.2. Powder
- 5.2. Market Analysis, Insights and Forecast - by Distribution Channel
- 5.2.1. Supermarkets/ Hypermarkets
- 5.2.2. Specialty Stores/Health Stores
- 5.2.3. Convenience Stores
- 5.2.4. Online Retail Stores
- 5.2.5. Others
- 5.3. Market Analysis, Insights and Forecast - by Region
- 5.3.1. North America
- 5.3.2. South America
- 5.3.3. Europe
- 5.3.4. Middle East & Africa
- 5.3.5. Asia Pacific
- 5.1. Market Analysis, Insights and Forecast - by Product Type
- 6. North America US Recovery Drinks Industry Analysis, Insights and Forecast, 2020-2032
- 6.1. Market Analysis, Insights and Forecast - by Product Type
- 6.1.1. RTD
- 6.1.2. Powder
- 6.2. Market Analysis, Insights and Forecast - by Distribution Channel
- 6.2.1. Supermarkets/ Hypermarkets
- 6.2.2. Specialty Stores/Health Stores
- 6.2.3. Convenience Stores
- 6.2.4. Online Retail Stores
- 6.2.5. Others
- 6.1. Market Analysis, Insights and Forecast - by Product Type
- 7. South America US Recovery Drinks Industry Analysis, Insights and Forecast, 2020-2032
- 7.1. Market Analysis, Insights and Forecast - by Product Type
- 7.1.1. RTD
- 7.1.2. Powder
- 7.2. Market Analysis, Insights and Forecast - by Distribution Channel
- 7.2.1. Supermarkets/ Hypermarkets
- 7.2.2. Specialty Stores/Health Stores
- 7.2.3. Convenience Stores
- 7.2.4. Online Retail Stores
- 7.2.5. Others
- 7.1. Market Analysis, Insights and Forecast - by Product Type
- 8. Europe US Recovery Drinks Industry Analysis, Insights and Forecast, 2020-2032
- 8.1. Market Analysis, Insights and Forecast - by Product Type
- 8.1.1. RTD
- 8.1.2. Powder
- 8.2. Market Analysis, Insights and Forecast - by Distribution Channel
- 8.2.1. Supermarkets/ Hypermarkets
- 8.2.2. Specialty Stores/Health Stores
- 8.2.3. Convenience Stores
- 8.2.4. Online Retail Stores
- 8.2.5. Others
- 8.1. Market Analysis, Insights and Forecast - by Product Type
- 9. Middle East & Africa US Recovery Drinks Industry Analysis, Insights and Forecast, 2020-2032
- 9.1. Market Analysis, Insights and Forecast - by Product Type
- 9.1.1. RTD
- 9.1.2. Powder
- 9.2. Market Analysis, Insights and Forecast - by Distribution Channel
- 9.2.1. Supermarkets/ Hypermarkets
- 9.2.2. Specialty Stores/Health Stores
- 9.2.3. Convenience Stores
- 9.2.4. Online Retail Stores
- 9.2.5. Others
- 9.1. Market Analysis, Insights and Forecast - by Product Type
- 10. Asia Pacific US Recovery Drinks Industry Analysis, Insights and Forecast, 2020-2032
- 10.1. Market Analysis, Insights and Forecast - by Product Type
- 10.1.1. RTD
- 10.1.2. Powder
- 10.2. Market Analysis, Insights and Forecast - by Distribution Channel
- 10.2.1. Supermarkets/ Hypermarkets
- 10.2.2. Specialty Stores/Health Stores
- 10.2.3. Convenience Stores
- 10.2.4. Online Retail Stores
- 10.2.5. Others
- 10.1. Market Analysis, Insights and Forecast - by Product Type
- 11. Northeast US Recovery Drinks Industry Analysis, Insights and Forecast, 2020-2032
- 12. Southeast US Recovery Drinks Industry Analysis, Insights and Forecast, 2020-2032
- 13. Midwest US Recovery Drinks Industry Analysis, Insights and Forecast, 2020-2032
- 14. Southwest US Recovery Drinks Industry Analysis, Insights and Forecast, 2020-2032
- 15. West US Recovery Drinks Industry Analysis, Insights and Forecast, 2020-2032
- 16. Competitive Analysis
- 16.1. Global Market Share Analysis 2025
- 16.2. Company Profiles
- 16.2.1 Nestle SA
- 16.2.1.1. Overview
- 16.2.1.2. Products
- 16.2.1.3. SWOT Analysis
- 16.2.1.4. Recent Developments
- 16.2.1.5. Financials (Based on Availability)
- 16.2.2 Kill Cliff
- 16.2.2.1. Overview
- 16.2.2.2. Products
- 16.2.2.3. SWOT Analysis
- 16.2.2.4. Recent Developments
- 16.2.2.5. Financials (Based on Availability)
- 16.2.3 Abbott Nutrition
- 16.2.3.1. Overview
- 16.2.3.2. Products
- 16.2.3.3. SWOT Analysis
- 16.2.3.4. Recent Developments
- 16.2.3.5. Financials (Based on Availability)
- 16.2.4 PepsiCo Inc
- 16.2.4.1. Overview
- 16.2.4.2. Products
- 16.2.4.3. SWOT Analysis
- 16.2.4.4. Recent Developments
- 16.2.4.5. Financials (Based on Availability)
- 16.2.5 Glanbia plc
- 16.2.5.1. Overview
- 16.2.5.2. Products
- 16.2.5.3. SWOT Analysis
- 16.2.5.4. Recent Developments
- 16.2.5.5. Financials (Based on Availability)
- 16.2.6 Energy Lab Nutrition
- 16.2.6.1. Overview
- 16.2.6.2. Products
- 16.2.6.3. SWOT Analysis
- 16.2.6.4. Recent Developments
- 16.2.6.5. Financials (Based on Availability)
- 16.2.7 Fluid Sports Nutrition*List Not Exhaustive
- 16.2.7.1. Overview
- 16.2.7.2. Products
- 16.2.7.3. SWOT Analysis
- 16.2.7.4. Recent Developments
- 16.2.7.5. Financials (Based on Availability)
- 16.2.8 Danone SA
- 16.2.8.1. Overview
- 16.2.8.2. Products
- 16.2.8.3. SWOT Analysis
- 16.2.8.4. Recent Developments
- 16.2.8.5. Financials (Based on Availability)
- 16.2.1 Nestle SA
List of Figures
- Figure 1: Global US Recovery Drinks Industry Revenue Breakdown (Million, %) by Region 2025 & 2033
- Figure 2: United states US Recovery Drinks Industry Revenue (Million), by Country 2025 & 2033
- Figure 3: United states US Recovery Drinks Industry Revenue Share (%), by Country 2025 & 2033
- Figure 4: North America US Recovery Drinks Industry Revenue (Million), by Product Type 2025 & 2033
- Figure 5: North America US Recovery Drinks Industry Revenue Share (%), by Product Type 2025 & 2033
- Figure 6: North America US Recovery Drinks Industry Revenue (Million), by Distribution Channel 2025 & 2033
- Figure 7: North America US Recovery Drinks Industry Revenue Share (%), by Distribution Channel 2025 & 2033
- Figure 8: North America US Recovery Drinks Industry Revenue (Million), by Country 2025 & 2033
- Figure 9: North America US Recovery Drinks Industry Revenue Share (%), by Country 2025 & 2033
- Figure 10: South America US Recovery Drinks Industry Revenue (Million), by Product Type 2025 & 2033
- Figure 11: South America US Recovery Drinks Industry Revenue Share (%), by Product Type 2025 & 2033
- Figure 12: South America US Recovery Drinks Industry Revenue (Million), by Distribution Channel 2025 & 2033
- Figure 13: South America US Recovery Drinks Industry Revenue Share (%), by Distribution Channel 2025 & 2033
- Figure 14: South America US Recovery Drinks Industry Revenue (Million), by Country 2025 & 2033
- Figure 15: South America US Recovery Drinks Industry Revenue Share (%), by Country 2025 & 2033
- Figure 16: Europe US Recovery Drinks Industry Revenue (Million), by Product Type 2025 & 2033
- Figure 17: Europe US Recovery Drinks Industry Revenue Share (%), by Product Type 2025 & 2033
- Figure 18: Europe US Recovery Drinks Industry Revenue (Million), by Distribution Channel 2025 & 2033
- Figure 19: Europe US Recovery Drinks Industry Revenue Share (%), by Distribution Channel 2025 & 2033
- Figure 20: Europe US Recovery Drinks Industry Revenue (Million), by Country 2025 & 2033
- Figure 21: Europe US Recovery Drinks Industry Revenue Share (%), by Country 2025 & 2033
- Figure 22: Middle East & Africa US Recovery Drinks Industry Revenue (Million), by Product Type 2025 & 2033
- Figure 23: Middle East & Africa US Recovery Drinks Industry Revenue Share (%), by Product Type 2025 & 2033
- Figure 24: Middle East & Africa US Recovery Drinks Industry Revenue (Million), by Distribution Channel 2025 & 2033
- Figure 25: Middle East & Africa US Recovery Drinks Industry Revenue Share (%), by Distribution Channel 2025 & 2033
- Figure 26: Middle East & Africa US Recovery Drinks Industry Revenue (Million), by Country 2025 & 2033
- Figure 27: Middle East & Africa US Recovery Drinks Industry Revenue Share (%), by Country 2025 & 2033
- Figure 28: Asia Pacific US Recovery Drinks Industry Revenue (Million), by Product Type 2025 & 2033
- Figure 29: Asia Pacific US Recovery Drinks Industry Revenue Share (%), by Product Type 2025 & 2033
- Figure 30: Asia Pacific US Recovery Drinks Industry Revenue (Million), by Distribution Channel 2025 & 2033
- Figure 31: Asia Pacific US Recovery Drinks Industry Revenue Share (%), by Distribution Channel 2025 & 2033
- Figure 32: Asia Pacific US Recovery Drinks Industry Revenue (Million), by Country 2025 & 2033
- Figure 33: Asia Pacific US Recovery Drinks Industry Revenue Share (%), by Country 2025 & 2033
List of Tables
- Table 1: Global US Recovery Drinks Industry Revenue Million Forecast, by Region 2020 & 2033
- Table 2: Global US Recovery Drinks Industry Revenue Million Forecast, by Product Type 2020 & 2033
- Table 3: Global US Recovery Drinks Industry Revenue Million Forecast, by Distribution Channel 2020 & 2033
- Table 4: Global US Recovery Drinks Industry Revenue Million Forecast, by Region 2020 & 2033
- Table 5: Global US Recovery Drinks Industry Revenue Million Forecast, by Country 2020 & 2033
- Table 6: Northeast US Recovery Drinks Industry Revenue (Million) Forecast, by Application 2020 & 2033
- Table 7: Southeast US Recovery Drinks Industry Revenue (Million) Forecast, by Application 2020 & 2033
- Table 8: Midwest US Recovery Drinks Industry Revenue (Million) Forecast, by Application 2020 & 2033
- Table 9: Southwest US Recovery Drinks Industry Revenue (Million) Forecast, by Application 2020 & 2033
- Table 10: West US Recovery Drinks Industry Revenue (Million) Forecast, by Application 2020 & 2033
- Table 11: Global US Recovery Drinks Industry Revenue Million Forecast, by Product Type 2020 & 2033
- Table 12: Global US Recovery Drinks Industry Revenue Million Forecast, by Distribution Channel 2020 & 2033
- Table 13: Global US Recovery Drinks Industry Revenue Million Forecast, by Country 2020 & 2033
- Table 14: United States US Recovery Drinks Industry Revenue (Million) Forecast, by Application 2020 & 2033
- Table 15: Canada US Recovery Drinks Industry Revenue (Million) Forecast, by Application 2020 & 2033
- Table 16: Mexico US Recovery Drinks Industry Revenue (Million) Forecast, by Application 2020 & 2033
- Table 17: Global US Recovery Drinks Industry Revenue Million Forecast, by Product Type 2020 & 2033
- Table 18: Global US Recovery Drinks Industry Revenue Million Forecast, by Distribution Channel 2020 & 2033
- Table 19: Global US Recovery Drinks Industry Revenue Million Forecast, by Country 2020 & 2033
- Table 20: Brazil US Recovery Drinks Industry Revenue (Million) Forecast, by Application 2020 & 2033
- Table 21: Argentina US Recovery Drinks Industry Revenue (Million) Forecast, by Application 2020 & 2033
- Table 22: Rest of South America US Recovery Drinks Industry Revenue (Million) Forecast, by Application 2020 & 2033
- Table 23: Global US Recovery Drinks Industry Revenue Million Forecast, by Product Type 2020 & 2033
- Table 24: Global US Recovery Drinks Industry Revenue Million Forecast, by Distribution Channel 2020 & 2033
- Table 25: Global US Recovery Drinks Industry Revenue Million Forecast, by Country 2020 & 2033
- Table 26: United Kingdom US Recovery Drinks Industry Revenue (Million) Forecast, by Application 2020 & 2033
- Table 27: Germany US Recovery Drinks Industry Revenue (Million) Forecast, by Application 2020 & 2033
- Table 28: France US Recovery Drinks Industry Revenue (Million) Forecast, by Application 2020 & 2033
- Table 29: Italy US Recovery Drinks Industry Revenue (Million) Forecast, by Application 2020 & 2033
- Table 30: Spain US Recovery Drinks Industry Revenue (Million) Forecast, by Application 2020 & 2033
- Table 31: Russia US Recovery Drinks Industry Revenue (Million) Forecast, by Application 2020 & 2033
- Table 32: Benelux US Recovery Drinks Industry Revenue (Million) Forecast, by Application 2020 & 2033
- Table 33: Nordics US Recovery Drinks Industry Revenue (Million) Forecast, by Application 2020 & 2033
- Table 34: Rest of Europe US Recovery Drinks Industry Revenue (Million) Forecast, by Application 2020 & 2033
- Table 35: Global US Recovery Drinks Industry Revenue Million Forecast, by Product Type 2020 & 2033
- Table 36: Global US Recovery Drinks Industry Revenue Million Forecast, by Distribution Channel 2020 & 2033
- Table 37: Global US Recovery Drinks Industry Revenue Million Forecast, by Country 2020 & 2033
- Table 38: Turkey US Recovery Drinks Industry Revenue (Million) Forecast, by Application 2020 & 2033
- Table 39: Israel US Recovery Drinks Industry Revenue (Million) Forecast, by Application 2020 & 2033
- Table 40: GCC US Recovery Drinks Industry Revenue (Million) Forecast, by Application 2020 & 2033
- Table 41: North Africa US Recovery Drinks Industry Revenue (Million) Forecast, by Application 2020 & 2033
- Table 42: South Africa US Recovery Drinks Industry Revenue (Million) Forecast, by Application 2020 & 2033
- Table 43: Rest of Middle East & Africa US Recovery Drinks Industry Revenue (Million) Forecast, by Application 2020 & 2033
- Table 44: Global US Recovery Drinks Industry Revenue Million Forecast, by Product Type 2020 & 2033
- Table 45: Global US Recovery Drinks Industry Revenue Million Forecast, by Distribution Channel 2020 & 2033
- Table 46: Global US Recovery Drinks Industry Revenue Million Forecast, by Country 2020 & 2033
- Table 47: China US Recovery Drinks Industry Revenue (Million) Forecast, by Application 2020 & 2033
- Table 48: India US Recovery Drinks Industry Revenue (Million) Forecast, by Application 2020 & 2033
- Table 49: Japan US Recovery Drinks Industry Revenue (Million) Forecast, by Application 2020 & 2033
- Table 50: South Korea US Recovery Drinks Industry Revenue (Million) Forecast, by Application 2020 & 2033
- Table 51: ASEAN US Recovery Drinks Industry Revenue (Million) Forecast, by Application 2020 & 2033
- Table 52: Oceania US Recovery Drinks Industry Revenue (Million) Forecast, by Application 2020 & 2033
- Table 53: Rest of Asia Pacific US Recovery Drinks Industry Revenue (Million) Forecast, by Application 2020 & 2033
Frequently Asked Questions
1. What is the projected Compound Annual Growth Rate (CAGR) of the US Recovery Drinks Industry?
The projected CAGR is approximately 5.72%.
2. Which companies are prominent players in the US Recovery Drinks Industry?
Key companies in the market include Nestle SA, Kill Cliff, Abbott Nutrition, PepsiCo Inc, Glanbia plc, Energy Lab Nutrition, Fluid Sports Nutrition*List Not Exhaustive, Danone SA.
3. What are the main segments of the US Recovery Drinks Industry?
The market segments include Product Type, Distribution Channel.
4. Can you provide details about the market size?
The market size is estimated to be USD XX Million as of 2022.
5. What are some drivers contributing to market growth?
Demand for specialty and organic coffee pods and capsules; Innovations in packaging formats.
6. What are the notable trends driving market growth?
Growing Physical Activity Participation Rate. Coupled With Marketing Campaigns.
7. Are there any restraints impacting market growth?
Availability of counterfeit products.
8. Can you provide examples of recent developments in the market?
N/A
9. What pricing options are available for accessing the report?
Pricing options include single-user, multi-user, and enterprise licenses priced at USD 3800, USD 4500, and USD 5800 respectively.
10. Is the market size provided in terms of value or volume?
The market size is provided in terms of value, measured in Million.
11. Are there any specific market keywords associated with the report?
Yes, the market keyword associated with the report is "US Recovery Drinks Industry," which aids in identifying and referencing the specific market segment covered.
12. How do I determine which pricing option suits my needs best?
The pricing options vary based on user requirements and access needs. Individual users may opt for single-user licenses, while businesses requiring broader access may choose multi-user or enterprise licenses for cost-effective access to the report.
13. Are there any additional resources or data provided in the US Recovery Drinks Industry report?
While the report offers comprehensive insights, it's advisable to review the specific contents or supplementary materials provided to ascertain if additional resources or data are available.
14. How can I stay updated on further developments or reports in the US Recovery Drinks Industry?
To stay informed about further developments, trends, and reports in the US Recovery Drinks Industry, consider subscribing to industry newsletters, following relevant companies and organizations, or regularly checking reputable industry news sources and publications.
Methodology
Step 1 - Identification of Relevant Samples Size from Population Database


Step 2 - Approaches for Defining Global Market Size (Value, Volume* & Price*)

Note*: In applicable scenarios
Step 3 - Data Sources
Primary Research
- Web Analytics
- Survey Reports
- Research Institute
- Latest Research Reports
- Opinion Leaders
Secondary Research
- Annual Reports
- White Paper
- Latest Press Release
- Industry Association
- Paid Database
- Investor Presentations

Step 4 - Data Triangulation
Involves using different sources of information in order to increase the validity of a study
These sources are likely to be stakeholders in a program - participants, other researchers, program staff, other community members, and so on.
Then we put all data in single framework & apply various statistical tools to find out the dynamic on the market.
During the analysis stage, feedback from the stakeholder groups would be compared to determine areas of agreement as well as areas of divergence
