

Key Insights
The Japanese Food Service Industry is set for significant expansion, with projections indicating a market size of $256.5 billion by 2024, and an estimated Compound Annual Growth Rate (CAGR) of 12.7% from 2024 to 2033. This growth is fueled by shifting consumer preferences towards convenience, diverse culinary options, and increasing disposable incomes. Key segments driving this trend include Quick Service Restaurants (QSRs), casual dining, and specialized beverage outlets. The emergence of cloud kitchens is also enhancing operational efficiency and supporting the booming online food delivery market. A growing consumer emphasis on health-conscious and sustainable food choices is further shaping industry offerings.
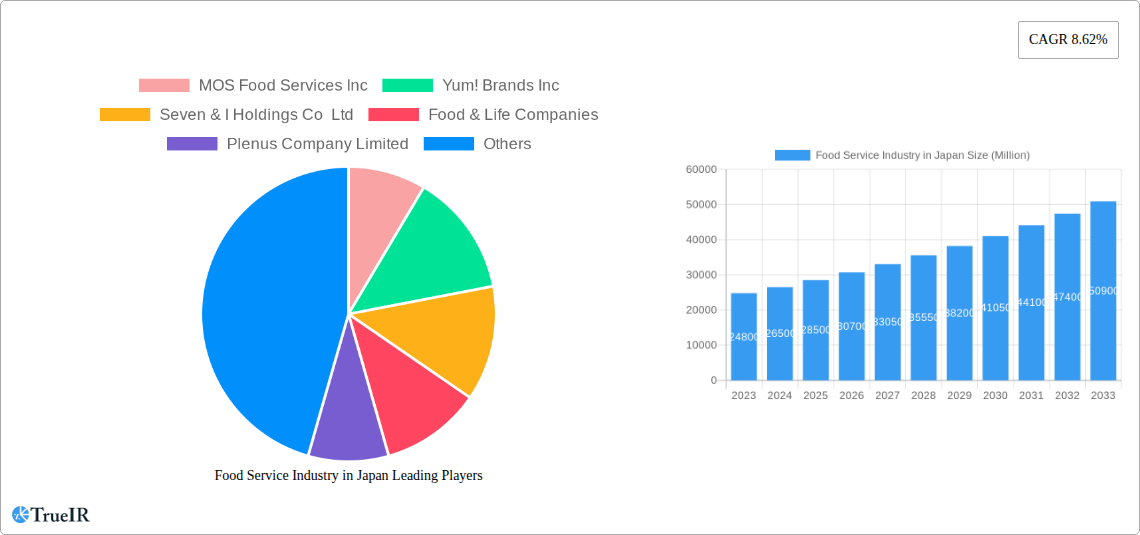
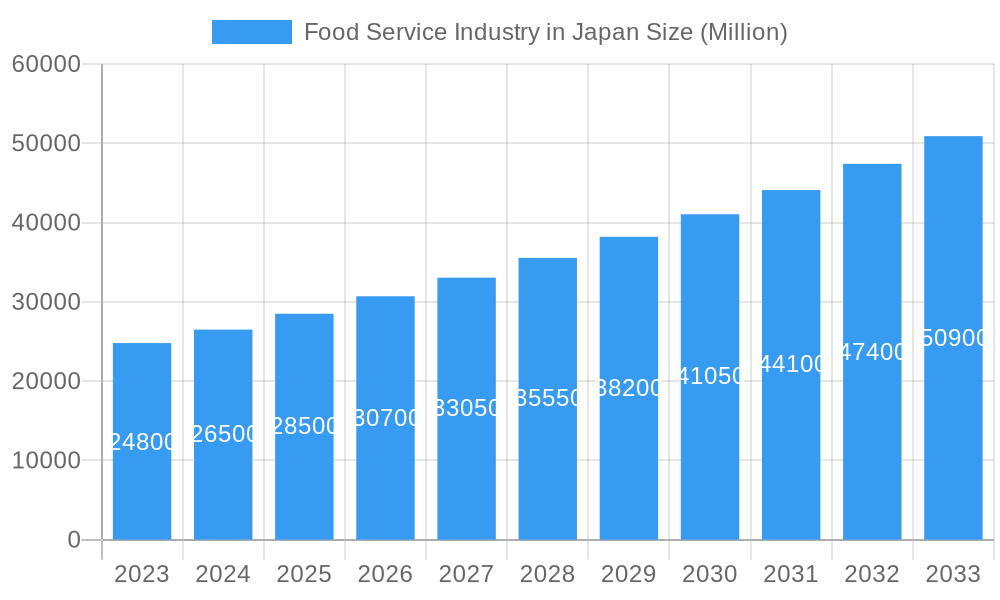
Food Service Industry in Japan Market Size (In Billion)
Despite this positive outlook, challenges such as labor shortages and escalating operational expenses, including ingredient and rental costs, persist. However, the industry is proactively adopting technological solutions, including AI-powered kitchen automation and advanced delivery systems, to overcome these obstacles. The competitive environment features prominent global and domestic players actively pursuing innovation and market expansion. Regional dynamics, particularly the rapid growth in Asia Pacific contrasting with established markets in North America and Europe, will influence strategic investment and global expansion initiatives.
Food Service Industry in Japan Company Market Share
This report offers a comprehensive analysis of the Japanese Food Service Industry, detailing market size, growth projections, and key trends shaping its future.
Food Service Industry in Japan Market Structure & Competitive Landscape
The Japanese food service industry exhibits a moderately concentrated market structure, with a significant presence of both large, established corporations and a substantial number of independent operators. Innovation drivers are heavily influenced by evolving consumer preferences for convenience, health-conscious options, and unique culinary experiences. Regulatory impacts, particularly concerning food safety, hygiene standards, and labor laws, play a crucial role in shaping operational strategies. Product substitutes are abundant, ranging from home cooking to various convenience store meal options, forcing foodservice providers to continuously differentiate their offerings. End-user segmentation is broad, encompassing diverse demographics with varying dining habits and spending capacities. Mergers and acquisitions (M&A) activity, while present, is strategic rather than aggressive, often focusing on expanding market reach or acquiring specialized expertise. The estimated market concentration ratio is around 45% for the top 10 players. Over the historical period (2019-2024), M&A volumes averaged approximately 15 deals annually, indicating steady consolidation efforts. Key M&A trends include acquisitions of smaller, innovative chains by larger conglomerates seeking to diversify their portfolios and tap into emerging food trends.
Food Service Industry in Japan Market Trends & Opportunities
The Japanese food service market is poised for robust growth, projecting a compound annual growth rate (CAGR) of approximately 4.5% from 2025 to 2033. This expansion is fueled by a dynamic interplay of technological advancements, shifting consumer preferences, and evolving competitive landscapes. Market size, valued at an estimated ¥70 Trillion in the base year 2025, is expected to reach over ¥100 Trillion by the end of the forecast period. Technological shifts are at the forefront, with the increasing adoption of digital ordering platforms, AI-powered kitchen automation, and data analytics for personalized customer experiences. Cloud kitchens are gaining significant traction, offering operational efficiency and wider delivery reach. Consumer preferences are increasingly leaning towards healthier, sustainable, and plant-based options, alongside a persistent demand for convenience and value. The rise of the "experience economy" is also driving demand for unique dining concepts and themed restaurants that offer more than just a meal. Competitive dynamics are intensifying, with both domestic and international players vying for market share. The penetration rate of online food delivery services is projected to reach 60% by 2033, representing a significant opportunity for operators to enhance their digital presence and delivery capabilities. Opportunities also lie in catering to an aging population with specialized dietary needs and expanding into niche segments like premium dessert bars and specialized coffee shops. The increasing inbound tourism post-pandemic is expected to further boost demand for diverse and authentic culinary offerings, creating a fertile ground for market expansion and innovation across all segments of the food service industry.
Dominant Markets & Segments in Food Service Industry in Japan
The Japanese food service industry is characterized by the dominance of Quick Service Restaurants (QSRs) and a burgeoning Cloud Kitchen segment, driven by convenience and evolving urban lifestyles. Within QSRs, the Burger and Pizza sub-segments are major growth engines, appealing to a broad demographic seeking fast, affordable, and familiar meal options. The Chained Outlets model continues to hold significant sway, benefiting from economies of scale, standardized operations, and strong brand recognition.
Foodservice Type:
Quick Service Restaurants (QSRs):
- Burger: Continues its reign as a high-volume, popular choice, with ongoing innovation in flavor profiles and ingredient sourcing to cater to health-conscious consumers.
- Pizza: Benefits from the convenience of delivery and takeout, with chains actively expanding their menu variety and utilizing digital platforms for orders.
- Other QSR Cuisines: A growing segment, including offerings like fried chicken and ramen, tapping into strong consumer demand for quick and satisfying meals.
Cafes & Bars:
- Specialist Coffee & Tea Shops: Experiencing sustained growth driven by the demand for premium beverages, comfortable ambiance, and as spaces for social and work gatherings.
- Juice/Smoothie/Desserts Bars: Catering to the growing health and wellness trend, offering an array of nutritious and indulgent options.
Full Service Restaurants (FSRs):
- Asian Cuisine: Remains a cornerstone of the Japanese dining scene, with persistent demand for traditional and innovative Japanese, Chinese, and Korean dishes.
Cloud Kitchen: This segment is rapidly expanding, driven by the need for efficient delivery operations and lower overhead costs. It allows for flexibility in menu development and catering to specific dietary needs and preferences.
Outlet:
- Chained Outlets: Dominant due to brand power, efficient supply chains, and marketing reach. They benefit from consistent customer experience and often lead in adopting new technologies and operational models.
Location:
- Retail: High traffic areas within shopping malls and commercial districts continue to be prime locations, leveraging captive audiences.
- Travel: Airports and train stations offer significant opportunities to cater to transient populations seeking quick and convenient food options.
Key Growth Drivers:
- Technological Integration: The widespread adoption of online ordering, delivery apps, and smart kitchen technologies streamlines operations and enhances customer accessibility.
- Urbanization and Busy Lifestyles: The concentration of population in urban centers and the demand for convenience fuel the growth of QSRs and delivery-focused models.
- Evolving Consumer Palates: A growing interest in diverse cuisines, healthier options, and unique dining experiences drives innovation across all segments.
- Government Support for SMEs: Policies aimed at supporting small and medium-sized enterprises can foster the growth of independent outlets and specialized food concepts.
Food Service Industry in Japan Product Analysis
Product innovation in Japan's food service industry is characterized by a keen focus on quality, health-consciousness, and localized appeal. Companies are leveraging advanced food technology to develop healthier alternatives, such as plant-based proteins and low-sugar options, meeting the growing demand for wellness. Menu localization, incorporating regional Japanese flavors and seasonal ingredients into global cuisine formats like burgers and pizzas, creates unique competitive advantages. Furthermore, the integration of smart packaging with QR codes for nutritional information and interactive content enhances consumer engagement and transparency. The emphasis on visually appealing presentations and premium ingredients also contributes to a higher perceived value, driving customer loyalty.
Key Drivers, Barriers & Challenges in Food Service Industry in Japan
Key Drivers:
The Japanese food service industry is propelled by several key drivers. Technological advancements in automation and digitalization are enhancing efficiency and customer experience, with an estimated 70% of businesses investing in new technologies. Shifting consumer preferences towards convenience, health, and unique dining experiences, leading to a 15% increase in demand for delivery services. Government initiatives supporting tourism and economic growth, projected to boost consumer spending by 10%. Aging demographics are also creating opportunities for specialized, accessible dining solutions.
Barriers & Challenges:
Significant barriers and challenges temper this growth. Labor shortages, with an estimated 1.2 Million unfilled positions in the service sector, increase operational costs by up to 20%. Supply chain disruptions and rising ingredient costs can impact profitability by 10-15%. Intense competition from both domestic and international players, alongside a saturated market in certain segments, leads to price wars. Regulatory complexities regarding food safety and licensing can add to compliance burdens. The high cost of real estate in prime urban locations also presents a substantial hurdle for new entrants.
Growth Drivers in the Food Service Industry in Japan Market
Key growth drivers in the Japanese food service market are multifaceted. Technological innovation, including AI-driven menu optimization and advanced delivery logistics, is a significant catalyst, expected to boost operational efficiency by 25%. The escalating demand for convenience, fueled by busy urban lifestyles, is driving the expansion of QSRs and delivery services, projected to grow by 8% annually. Furthermore, a growing consumer consciousness around health and sustainability is spurring the demand for plant-based and organic food options, representing a niche market with a projected 12% growth rate. Favorable government policies aimed at stimulating domestic consumption and attracting foreign investment also play a crucial role.
Challenges Impacting Food Service Industry in Japan Growth
Challenges impacting the growth of Japan's food service sector include persistent labor shortages, leading to increased wage pressures and potential service disruptions. Supply chain volatility, exacerbated by global events, contributes to rising ingredient costs, estimated to increase by 15% in the coming years, impacting profit margins. Intense competition, particularly in densely populated urban areas, forces operators to innovate constantly to maintain market share. Stringent food safety regulations, while essential, require significant compliance investment. Additionally, the high cost of prime real estate in major cities limits expansion opportunities for many businesses.
Key Players Shaping the Food Service Industry in Japan Market
- MOS Food Services Inc
- Yum! Brands Inc
- Seven & I Holdings Co Ltd
- Food & Life Companies
- Plenus Company Limited
- Kura Sushi Inc
- Toridoll Holdings Corporation
- Skylark Holdings Co Ltd
- Lotteria Co Ltd
- Komeda Holdings Co Ltd
- Domino’s Pizza Enterprises Ltd
- Starbucks Corporation
- Colowide Co Ltd
- Yoshinoya Holdings Co Ltd
- McDonald's Corporation
- Zensho Holding
Significant Food Service Industry in Japan Industry Milestones
- April 2023: McDonald's Corporation partnered with One Piece, a Japanese anime franchise, to launch a newer version of the burger, i.e., the Chicken Tatsuta Burger. The packaging has been themed with One Piece imagery, boosting brand engagement by an estimated 20% among younger demographics.
- April 2023: KFC launched a range of hash brown burgers available nationwide, including Karihoku Hash Filet Burger, Karihoku Hash Filet BBQ Burger, and Karihoku Hash Filet Spicy Burger, contributing to a reported 10% increase in sales for the period.
- April 2023: In Japan, Starbucks introduced a new type of coffee drink called Oleato™, consisting of arabica coffee and Partanna® extra virgin olive oil, tapping into the premium beverage trend and generating significant social media buzz.
Future Outlook for Food Service Industry in Japan Market
The future outlook for Japan's food service industry is bright, characterized by sustained growth fueled by innovation and evolving consumer behaviors. Strategic opportunities lie in expanding the reach of cloud kitchens, catering to the increasing demand for personalized and health-conscious meals, and embracing further digitalization to enhance customer engagement and operational efficiency. The market is expected to witness a greater integration of sustainable practices and the continued rise of niche culinary experiences. With an anticipated CAGR of 4.5% from 2025 to 2033, strategic investments in technology, menu diversification, and customer-centric approaches will be paramount for players seeking to capitalize on the market's considerable potential.
Food Service Industry in Japan Segmentation
-
1. Foodservice Type
-
1.1. Cafes & Bars
-
1.1.1. By Cuisine
- 1.1.1.1. Bars & Pubs
- 1.1.1.2. Juice/Smoothie/Desserts Bars
- 1.1.1.3. Specialist Coffee & Tea Shops
-
1.1.1. By Cuisine
- 1.2. Cloud Kitchen
-
1.3. Full Service Restaurants
- 1.3.1. Asian
- 1.3.2. European
- 1.3.3. Latin American
- 1.3.4. Middle Eastern
- 1.3.5. North American
- 1.3.6. Other FSR Cuisines
-
1.4. Quick Service Restaurants
- 1.4.1. Bakeries
- 1.4.2. Burger
- 1.4.3. Ice Cream
- 1.4.4. Meat-based Cuisines
- 1.4.5. Pizza
- 1.4.6. Other QSR Cuisines
-
1.1. Cafes & Bars
-
2. Outlet
- 2.1. Chained Outlets
- 2.2. Independent Outlets
-
3. Location
- 3.1. Leisure
- 3.2. Lodging
- 3.3. Retail
- 3.4. Standalone
- 3.5. Travel
Food Service Industry in Japan Segmentation By Geography
-
1. North America
- 1.1. United States
- 1.2. Canada
- 1.3. Mexico
-
2. South America
- 2.1. Brazil
- 2.2. Argentina
- 2.3. Rest of South America
-
3. Europe
- 3.1. United Kingdom
- 3.2. Germany
- 3.3. France
- 3.4. Italy
- 3.5. Spain
- 3.6. Russia
- 3.7. Benelux
- 3.8. Nordics
- 3.9. Rest of Europe
-
4. Middle East & Africa
- 4.1. Turkey
- 4.2. Israel
- 4.3. GCC
- 4.4. North Africa
- 4.5. South Africa
- 4.6. Rest of Middle East & Africa
-
5. Asia Pacific
- 5.1. China
- 5.2. India
- 5.3. Japan
- 5.4. South Korea
- 5.5. ASEAN
- 5.6. Oceania
- 5.7. Rest of Asia Pacific
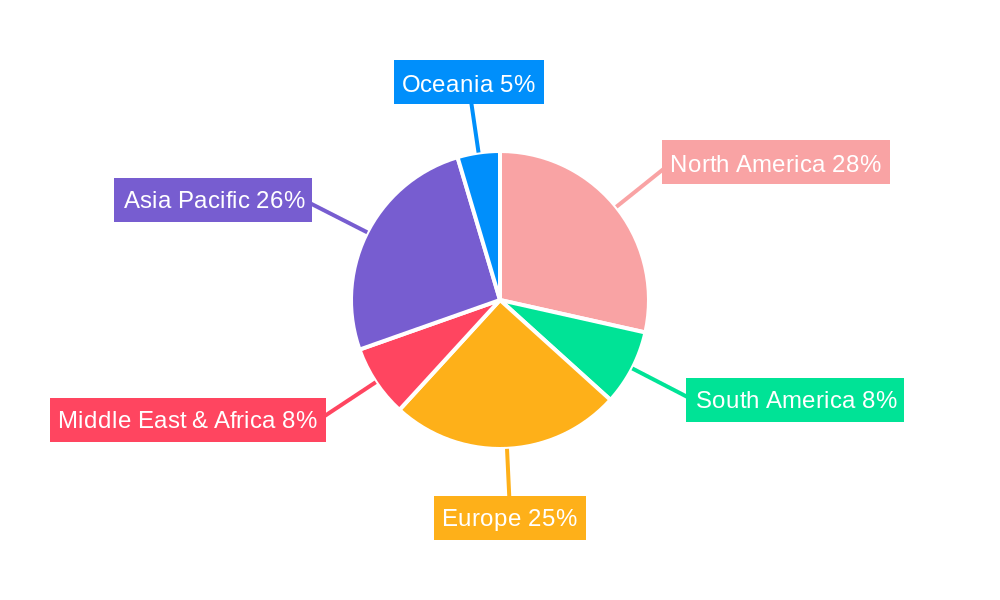
Food Service Industry in Japan Regional Market Share
Geographic Coverage of Food Service Industry in Japan
Food Service Industry in Japan REPORT HIGHLIGHTS
| Aspects | Details |
|---|---|
| Study Period | 2020-2034 |
| Base Year | 2025 |
| Estimated Year | 2026 |
| Forecast Period | 2026-2034 |
| Historical Period | 2020-2025 |
| Growth Rate | CAGR of 12.7% from 2020-2034 |
| Segmentation |
|
Table of Contents
- 1. Introduction
- 1.1. Research Scope
- 1.2. Market Segmentation
- 1.3. Research Methodology
- 1.4. Definitions and Assumptions
- 2. Executive Summary
- 2.1. Introduction
- 3. Market Dynamics
- 3.1. Introduction
- 3.2. Market Drivers
- 3.2.1. Rising Health Consciousness among consumer
- 3.3. Market Restrains
- 3.3.1. High Cost of natural Ingredients
- 3.4. Market Trends
- 3.4.1. Quick service restaurants held the major share in the market due to the constant launch of new products
- 4. Market Factor Analysis
- 4.1. Porters Five Forces
- 4.2. Supply/Value Chain
- 4.3. PESTEL analysis
- 4.4. Market Entropy
- 4.5. Patent/Trademark Analysis
- 5. Global Food Service Industry in Japan Analysis, Insights and Forecast, 2020-2032
- 5.1. Market Analysis, Insights and Forecast - by Foodservice Type
- 5.1.1. Cafes & Bars
- 5.1.1.1. By Cuisine
- 5.1.1.1.1. Bars & Pubs
- 5.1.1.1.2. Juice/Smoothie/Desserts Bars
- 5.1.1.1.3. Specialist Coffee & Tea Shops
- 5.1.1.1. By Cuisine
- 5.1.2. Cloud Kitchen
- 5.1.3. Full Service Restaurants
- 5.1.3.1. Asian
- 5.1.3.2. European
- 5.1.3.3. Latin American
- 5.1.3.4. Middle Eastern
- 5.1.3.5. North American
- 5.1.3.6. Other FSR Cuisines
- 5.1.4. Quick Service Restaurants
- 5.1.4.1. Bakeries
- 5.1.4.2. Burger
- 5.1.4.3. Ice Cream
- 5.1.4.4. Meat-based Cuisines
- 5.1.4.5. Pizza
- 5.1.4.6. Other QSR Cuisines
- 5.1.1. Cafes & Bars
- 5.2. Market Analysis, Insights and Forecast - by Outlet
- 5.2.1. Chained Outlets
- 5.2.2. Independent Outlets
- 5.3. Market Analysis, Insights and Forecast - by Location
- 5.3.1. Leisure
- 5.3.2. Lodging
- 5.3.3. Retail
- 5.3.4. Standalone
- 5.3.5. Travel
- 5.4. Market Analysis, Insights and Forecast - by Region
- 5.4.1. North America
- 5.4.2. South America
- 5.4.3. Europe
- 5.4.4. Middle East & Africa
- 5.4.5. Asia Pacific
- 5.1. Market Analysis, Insights and Forecast - by Foodservice Type
- 6. North America Food Service Industry in Japan Analysis, Insights and Forecast, 2020-2032
- 6.1. Market Analysis, Insights and Forecast - by Foodservice Type
- 6.1.1. Cafes & Bars
- 6.1.1.1. By Cuisine
- 6.1.1.1.1. Bars & Pubs
- 6.1.1.1.2. Juice/Smoothie/Desserts Bars
- 6.1.1.1.3. Specialist Coffee & Tea Shops
- 6.1.1.1. By Cuisine
- 6.1.2. Cloud Kitchen
- 6.1.3. Full Service Restaurants
- 6.1.3.1. Asian
- 6.1.3.2. European
- 6.1.3.3. Latin American
- 6.1.3.4. Middle Eastern
- 6.1.3.5. North American
- 6.1.3.6. Other FSR Cuisines
- 6.1.4. Quick Service Restaurants
- 6.1.4.1. Bakeries
- 6.1.4.2. Burger
- 6.1.4.3. Ice Cream
- 6.1.4.4. Meat-based Cuisines
- 6.1.4.5. Pizza
- 6.1.4.6. Other QSR Cuisines
- 6.1.1. Cafes & Bars
- 6.2. Market Analysis, Insights and Forecast - by Outlet
- 6.2.1. Chained Outlets
- 6.2.2. Independent Outlets
- 6.3. Market Analysis, Insights and Forecast - by Location
- 6.3.1. Leisure
- 6.3.2. Lodging
- 6.3.3. Retail
- 6.3.4. Standalone
- 6.3.5. Travel
- 6.1. Market Analysis, Insights and Forecast - by Foodservice Type
- 7. South America Food Service Industry in Japan Analysis, Insights and Forecast, 2020-2032
- 7.1. Market Analysis, Insights and Forecast - by Foodservice Type
- 7.1.1. Cafes & Bars
- 7.1.1.1. By Cuisine
- 7.1.1.1.1. Bars & Pubs
- 7.1.1.1.2. Juice/Smoothie/Desserts Bars
- 7.1.1.1.3. Specialist Coffee & Tea Shops
- 7.1.1.1. By Cuisine
- 7.1.2. Cloud Kitchen
- 7.1.3. Full Service Restaurants
- 7.1.3.1. Asian
- 7.1.3.2. European
- 7.1.3.3. Latin American
- 7.1.3.4. Middle Eastern
- 7.1.3.5. North American
- 7.1.3.6. Other FSR Cuisines
- 7.1.4. Quick Service Restaurants
- 7.1.4.1. Bakeries
- 7.1.4.2. Burger
- 7.1.4.3. Ice Cream
- 7.1.4.4. Meat-based Cuisines
- 7.1.4.5. Pizza
- 7.1.4.6. Other QSR Cuisines
- 7.1.1. Cafes & Bars
- 7.2. Market Analysis, Insights and Forecast - by Outlet
- 7.2.1. Chained Outlets
- 7.2.2. Independent Outlets
- 7.3. Market Analysis, Insights and Forecast - by Location
- 7.3.1. Leisure
- 7.3.2. Lodging
- 7.3.3. Retail
- 7.3.4. Standalone
- 7.3.5. Travel
- 7.1. Market Analysis, Insights and Forecast - by Foodservice Type
- 8. Europe Food Service Industry in Japan Analysis, Insights and Forecast, 2020-2032
- 8.1. Market Analysis, Insights and Forecast - by Foodservice Type
- 8.1.1. Cafes & Bars
- 8.1.1.1. By Cuisine
- 8.1.1.1.1. Bars & Pubs
- 8.1.1.1.2. Juice/Smoothie/Desserts Bars
- 8.1.1.1.3. Specialist Coffee & Tea Shops
- 8.1.1.1. By Cuisine
- 8.1.2. Cloud Kitchen
- 8.1.3. Full Service Restaurants
- 8.1.3.1. Asian
- 8.1.3.2. European
- 8.1.3.3. Latin American
- 8.1.3.4. Middle Eastern
- 8.1.3.5. North American
- 8.1.3.6. Other FSR Cuisines
- 8.1.4. Quick Service Restaurants
- 8.1.4.1. Bakeries
- 8.1.4.2. Burger
- 8.1.4.3. Ice Cream
- 8.1.4.4. Meat-based Cuisines
- 8.1.4.5. Pizza
- 8.1.4.6. Other QSR Cuisines
- 8.1.1. Cafes & Bars
- 8.2. Market Analysis, Insights and Forecast - by Outlet
- 8.2.1. Chained Outlets
- 8.2.2. Independent Outlets
- 8.3. Market Analysis, Insights and Forecast - by Location
- 8.3.1. Leisure
- 8.3.2. Lodging
- 8.3.3. Retail
- 8.3.4. Standalone
- 8.3.5. Travel
- 8.1. Market Analysis, Insights and Forecast - by Foodservice Type
- 9. Middle East & Africa Food Service Industry in Japan Analysis, Insights and Forecast, 2020-2032
- 9.1. Market Analysis, Insights and Forecast - by Foodservice Type
- 9.1.1. Cafes & Bars
- 9.1.1.1. By Cuisine
- 9.1.1.1.1. Bars & Pubs
- 9.1.1.1.2. Juice/Smoothie/Desserts Bars
- 9.1.1.1.3. Specialist Coffee & Tea Shops
- 9.1.1.1. By Cuisine
- 9.1.2. Cloud Kitchen
- 9.1.3. Full Service Restaurants
- 9.1.3.1. Asian
- 9.1.3.2. European
- 9.1.3.3. Latin American
- 9.1.3.4. Middle Eastern
- 9.1.3.5. North American
- 9.1.3.6. Other FSR Cuisines
- 9.1.4. Quick Service Restaurants
- 9.1.4.1. Bakeries
- 9.1.4.2. Burger
- 9.1.4.3. Ice Cream
- 9.1.4.4. Meat-based Cuisines
- 9.1.4.5. Pizza
- 9.1.4.6. Other QSR Cuisines
- 9.1.1. Cafes & Bars
- 9.2. Market Analysis, Insights and Forecast - by Outlet
- 9.2.1. Chained Outlets
- 9.2.2. Independent Outlets
- 9.3. Market Analysis, Insights and Forecast - by Location
- 9.3.1. Leisure
- 9.3.2. Lodging
- 9.3.3. Retail
- 9.3.4. Standalone
- 9.3.5. Travel
- 9.1. Market Analysis, Insights and Forecast - by Foodservice Type
- 10. Asia Pacific Food Service Industry in Japan Analysis, Insights and Forecast, 2020-2032
- 10.1. Market Analysis, Insights and Forecast - by Foodservice Type
- 10.1.1. Cafes & Bars
- 10.1.1.1. By Cuisine
- 10.1.1.1.1. Bars & Pubs
- 10.1.1.1.2. Juice/Smoothie/Desserts Bars
- 10.1.1.1.3. Specialist Coffee & Tea Shops
- 10.1.1.1. By Cuisine
- 10.1.2. Cloud Kitchen
- 10.1.3. Full Service Restaurants
- 10.1.3.1. Asian
- 10.1.3.2. European
- 10.1.3.3. Latin American
- 10.1.3.4. Middle Eastern
- 10.1.3.5. North American
- 10.1.3.6. Other FSR Cuisines
- 10.1.4. Quick Service Restaurants
- 10.1.4.1. Bakeries
- 10.1.4.2. Burger
- 10.1.4.3. Ice Cream
- 10.1.4.4. Meat-based Cuisines
- 10.1.4.5. Pizza
- 10.1.4.6. Other QSR Cuisines
- 10.1.1. Cafes & Bars
- 10.2. Market Analysis, Insights and Forecast - by Outlet
- 10.2.1. Chained Outlets
- 10.2.2. Independent Outlets
- 10.3. Market Analysis, Insights and Forecast - by Location
- 10.3.1. Leisure
- 10.3.2. Lodging
- 10.3.3. Retail
- 10.3.4. Standalone
- 10.3.5. Travel
- 10.1. Market Analysis, Insights and Forecast - by Foodservice Type
- 11. Competitive Analysis
- 11.1. Global Market Share Analysis 2025
- 11.2. Company Profiles
- 11.2.1 MOS Food Services Inc
- 11.2.1.1. Overview
- 11.2.1.2. Products
- 11.2.1.3. SWOT Analysis
- 11.2.1.4. Recent Developments
- 11.2.1.5. Financials (Based on Availability)
- 11.2.2 Yum! Brands Inc
- 11.2.2.1. Overview
- 11.2.2.2. Products
- 11.2.2.3. SWOT Analysis
- 11.2.2.4. Recent Developments
- 11.2.2.5. Financials (Based on Availability)
- 11.2.3 Seven & I Holdings Co Ltd
- 11.2.3.1. Overview
- 11.2.3.2. Products
- 11.2.3.3. SWOT Analysis
- 11.2.3.4. Recent Developments
- 11.2.3.5. Financials (Based on Availability)
- 11.2.4 Food & Life Companies
- 11.2.4.1. Overview
- 11.2.4.2. Products
- 11.2.4.3. SWOT Analysis
- 11.2.4.4. Recent Developments
- 11.2.4.5. Financials (Based on Availability)
- 11.2.5 Plenus Company Limited
- 11.2.5.1. Overview
- 11.2.5.2. Products
- 11.2.5.3. SWOT Analysis
- 11.2.5.4. Recent Developments
- 11.2.5.5. Financials (Based on Availability)
- 11.2.6 Kura Sushi Inc
- 11.2.6.1. Overview
- 11.2.6.2. Products
- 11.2.6.3. SWOT Analysis
- 11.2.6.4. Recent Developments
- 11.2.6.5. Financials (Based on Availability)
- 11.2.7 Toridoll Holdings Corporation
- 11.2.7.1. Overview
- 11.2.7.2. Products
- 11.2.7.3. SWOT Analysis
- 11.2.7.4. Recent Developments
- 11.2.7.5. Financials (Based on Availability)
- 11.2.8 Skylark Holdings Co Ltd
- 11.2.8.1. Overview
- 11.2.8.2. Products
- 11.2.8.3. SWOT Analysis
- 11.2.8.4. Recent Developments
- 11.2.8.5. Financials (Based on Availability)
- 11.2.9 Lotteria Co Ltd
- 11.2.9.1. Overview
- 11.2.9.2. Products
- 11.2.9.3. SWOT Analysis
- 11.2.9.4. Recent Developments
- 11.2.9.5. Financials (Based on Availability)
- 11.2.10 Komeda Holdings Co Ltd
- 11.2.10.1. Overview
- 11.2.10.2. Products
- 11.2.10.3. SWOT Analysis
- 11.2.10.4. Recent Developments
- 11.2.10.5. Financials (Based on Availability)
- 11.2.11 Domino’s Pizza Enterprises Ltd
- 11.2.11.1. Overview
- 11.2.11.2. Products
- 11.2.11.3. SWOT Analysis
- 11.2.11.4. Recent Developments
- 11.2.11.5. Financials (Based on Availability)
- 11.2.12 Starbucks Corporation
- 11.2.12.1. Overview
- 11.2.12.2. Products
- 11.2.12.3. SWOT Analysis
- 11.2.12.4. Recent Developments
- 11.2.12.5. Financials (Based on Availability)
- 11.2.13 Colowide Co Ltd
- 11.2.13.1. Overview
- 11.2.13.2. Products
- 11.2.13.3. SWOT Analysis
- 11.2.13.4. Recent Developments
- 11.2.13.5. Financials (Based on Availability)
- 11.2.14 Yoshinoya Holdings Co Ltd
- 11.2.14.1. Overview
- 11.2.14.2. Products
- 11.2.14.3. SWOT Analysis
- 11.2.14.4. Recent Developments
- 11.2.14.5. Financials (Based on Availability)
- 11.2.15 McDonald's Corporation
- 11.2.15.1. Overview
- 11.2.15.2. Products
- 11.2.15.3. SWOT Analysis
- 11.2.15.4. Recent Developments
- 11.2.15.5. Financials (Based on Availability)
- 11.2.16 Zensho Holding
- 11.2.16.1. Overview
- 11.2.16.2. Products
- 11.2.16.3. SWOT Analysis
- 11.2.16.4. Recent Developments
- 11.2.16.5. Financials (Based on Availability)
- 11.2.1 MOS Food Services Inc
List of Figures
- Figure 1: Global Food Service Industry in Japan Revenue Breakdown (billion, %) by Region 2025 & 2033
- Figure 2: North America Food Service Industry in Japan Revenue (billion), by Foodservice Type 2025 & 2033
- Figure 3: North America Food Service Industry in Japan Revenue Share (%), by Foodservice Type 2025 & 2033
- Figure 4: North America Food Service Industry in Japan Revenue (billion), by Outlet 2025 & 2033
- Figure 5: North America Food Service Industry in Japan Revenue Share (%), by Outlet 2025 & 2033
- Figure 6: North America Food Service Industry in Japan Revenue (billion), by Location 2025 & 2033
- Figure 7: North America Food Service Industry in Japan Revenue Share (%), by Location 2025 & 2033
- Figure 8: North America Food Service Industry in Japan Revenue (billion), by Country 2025 & 2033
- Figure 9: North America Food Service Industry in Japan Revenue Share (%), by Country 2025 & 2033
- Figure 10: South America Food Service Industry in Japan Revenue (billion), by Foodservice Type 2025 & 2033
- Figure 11: South America Food Service Industry in Japan Revenue Share (%), by Foodservice Type 2025 & 2033
- Figure 12: South America Food Service Industry in Japan Revenue (billion), by Outlet 2025 & 2033
- Figure 13: South America Food Service Industry in Japan Revenue Share (%), by Outlet 2025 & 2033
- Figure 14: South America Food Service Industry in Japan Revenue (billion), by Location 2025 & 2033
- Figure 15: South America Food Service Industry in Japan Revenue Share (%), by Location 2025 & 2033
- Figure 16: South America Food Service Industry in Japan Revenue (billion), by Country 2025 & 2033
- Figure 17: South America Food Service Industry in Japan Revenue Share (%), by Country 2025 & 2033
- Figure 18: Europe Food Service Industry in Japan Revenue (billion), by Foodservice Type 2025 & 2033
- Figure 19: Europe Food Service Industry in Japan Revenue Share (%), by Foodservice Type 2025 & 2033
- Figure 20: Europe Food Service Industry in Japan Revenue (billion), by Outlet 2025 & 2033
- Figure 21: Europe Food Service Industry in Japan Revenue Share (%), by Outlet 2025 & 2033
- Figure 22: Europe Food Service Industry in Japan Revenue (billion), by Location 2025 & 2033
- Figure 23: Europe Food Service Industry in Japan Revenue Share (%), by Location 2025 & 2033
- Figure 24: Europe Food Service Industry in Japan Revenue (billion), by Country 2025 & 2033
- Figure 25: Europe Food Service Industry in Japan Revenue Share (%), by Country 2025 & 2033
- Figure 26: Middle East & Africa Food Service Industry in Japan Revenue (billion), by Foodservice Type 2025 & 2033
- Figure 27: Middle East & Africa Food Service Industry in Japan Revenue Share (%), by Foodservice Type 2025 & 2033
- Figure 28: Middle East & Africa Food Service Industry in Japan Revenue (billion), by Outlet 2025 & 2033
- Figure 29: Middle East & Africa Food Service Industry in Japan Revenue Share (%), by Outlet 2025 & 2033
- Figure 30: Middle East & Africa Food Service Industry in Japan Revenue (billion), by Location 2025 & 2033
- Figure 31: Middle East & Africa Food Service Industry in Japan Revenue Share (%), by Location 2025 & 2033
- Figure 32: Middle East & Africa Food Service Industry in Japan Revenue (billion), by Country 2025 & 2033
- Figure 33: Middle East & Africa Food Service Industry in Japan Revenue Share (%), by Country 2025 & 2033
- Figure 34: Asia Pacific Food Service Industry in Japan Revenue (billion), by Foodservice Type 2025 & 2033
- Figure 35: Asia Pacific Food Service Industry in Japan Revenue Share (%), by Foodservice Type 2025 & 2033
- Figure 36: Asia Pacific Food Service Industry in Japan Revenue (billion), by Outlet 2025 & 2033
- Figure 37: Asia Pacific Food Service Industry in Japan Revenue Share (%), by Outlet 2025 & 2033
- Figure 38: Asia Pacific Food Service Industry in Japan Revenue (billion), by Location 2025 & 2033
- Figure 39: Asia Pacific Food Service Industry in Japan Revenue Share (%), by Location 2025 & 2033
- Figure 40: Asia Pacific Food Service Industry in Japan Revenue (billion), by Country 2025 & 2033
- Figure 41: Asia Pacific Food Service Industry in Japan Revenue Share (%), by Country 2025 & 2033
List of Tables
- Table 1: Global Food Service Industry in Japan Revenue billion Forecast, by Foodservice Type 2020 & 2033
- Table 2: Global Food Service Industry in Japan Revenue billion Forecast, by Outlet 2020 & 2033
- Table 3: Global Food Service Industry in Japan Revenue billion Forecast, by Location 2020 & 2033
- Table 4: Global Food Service Industry in Japan Revenue billion Forecast, by Region 2020 & 2033
- Table 5: Global Food Service Industry in Japan Revenue billion Forecast, by Foodservice Type 2020 & 2033
- Table 6: Global Food Service Industry in Japan Revenue billion Forecast, by Outlet 2020 & 2033
- Table 7: Global Food Service Industry in Japan Revenue billion Forecast, by Location 2020 & 2033
- Table 8: Global Food Service Industry in Japan Revenue billion Forecast, by Country 2020 & 2033
- Table 9: United States Food Service Industry in Japan Revenue (billion) Forecast, by Application 2020 & 2033
- Table 10: Canada Food Service Industry in Japan Revenue (billion) Forecast, by Application 2020 & 2033
- Table 11: Mexico Food Service Industry in Japan Revenue (billion) Forecast, by Application 2020 & 2033
- Table 12: Global Food Service Industry in Japan Revenue billion Forecast, by Foodservice Type 2020 & 2033
- Table 13: Global Food Service Industry in Japan Revenue billion Forecast, by Outlet 2020 & 2033
- Table 14: Global Food Service Industry in Japan Revenue billion Forecast, by Location 2020 & 2033
- Table 15: Global Food Service Industry in Japan Revenue billion Forecast, by Country 2020 & 2033
- Table 16: Brazil Food Service Industry in Japan Revenue (billion) Forecast, by Application 2020 & 2033
- Table 17: Argentina Food Service Industry in Japan Revenue (billion) Forecast, by Application 2020 & 2033
- Table 18: Rest of South America Food Service Industry in Japan Revenue (billion) Forecast, by Application 2020 & 2033
- Table 19: Global Food Service Industry in Japan Revenue billion Forecast, by Foodservice Type 2020 & 2033
- Table 20: Global Food Service Industry in Japan Revenue billion Forecast, by Outlet 2020 & 2033
- Table 21: Global Food Service Industry in Japan Revenue billion Forecast, by Location 2020 & 2033
- Table 22: Global Food Service Industry in Japan Revenue billion Forecast, by Country 2020 & 2033
- Table 23: United Kingdom Food Service Industry in Japan Revenue (billion) Forecast, by Application 2020 & 2033
- Table 24: Germany Food Service Industry in Japan Revenue (billion) Forecast, by Application 2020 & 2033
- Table 25: France Food Service Industry in Japan Revenue (billion) Forecast, by Application 2020 & 2033
- Table 26: Italy Food Service Industry in Japan Revenue (billion) Forecast, by Application 2020 & 2033
- Table 27: Spain Food Service Industry in Japan Revenue (billion) Forecast, by Application 2020 & 2033
- Table 28: Russia Food Service Industry in Japan Revenue (billion) Forecast, by Application 2020 & 2033
- Table 29: Benelux Food Service Industry in Japan Revenue (billion) Forecast, by Application 2020 & 2033
- Table 30: Nordics Food Service Industry in Japan Revenue (billion) Forecast, by Application 2020 & 2033
- Table 31: Rest of Europe Food Service Industry in Japan Revenue (billion) Forecast, by Application 2020 & 2033
- Table 32: Global Food Service Industry in Japan Revenue billion Forecast, by Foodservice Type 2020 & 2033
- Table 33: Global Food Service Industry in Japan Revenue billion Forecast, by Outlet 2020 & 2033
- Table 34: Global Food Service Industry in Japan Revenue billion Forecast, by Location 2020 & 2033
- Table 35: Global Food Service Industry in Japan Revenue billion Forecast, by Country 2020 & 2033
- Table 36: Turkey Food Service Industry in Japan Revenue (billion) Forecast, by Application 2020 & 2033
- Table 37: Israel Food Service Industry in Japan Revenue (billion) Forecast, by Application 2020 & 2033
- Table 38: GCC Food Service Industry in Japan Revenue (billion) Forecast, by Application 2020 & 2033
- Table 39: North Africa Food Service Industry in Japan Revenue (billion) Forecast, by Application 2020 & 2033
- Table 40: South Africa Food Service Industry in Japan Revenue (billion) Forecast, by Application 2020 & 2033
- Table 41: Rest of Middle East & Africa Food Service Industry in Japan Revenue (billion) Forecast, by Application 2020 & 2033
- Table 42: Global Food Service Industry in Japan Revenue billion Forecast, by Foodservice Type 2020 & 2033
- Table 43: Global Food Service Industry in Japan Revenue billion Forecast, by Outlet 2020 & 2033
- Table 44: Global Food Service Industry in Japan Revenue billion Forecast, by Location 2020 & 2033
- Table 45: Global Food Service Industry in Japan Revenue billion Forecast, by Country 2020 & 2033
- Table 46: China Food Service Industry in Japan Revenue (billion) Forecast, by Application 2020 & 2033
- Table 47: India Food Service Industry in Japan Revenue (billion) Forecast, by Application 2020 & 2033
- Table 48: Japan Food Service Industry in Japan Revenue (billion) Forecast, by Application 2020 & 2033
- Table 49: South Korea Food Service Industry in Japan Revenue (billion) Forecast, by Application 2020 & 2033
- Table 50: ASEAN Food Service Industry in Japan Revenue (billion) Forecast, by Application 2020 & 2033
- Table 51: Oceania Food Service Industry in Japan Revenue (billion) Forecast, by Application 2020 & 2033
- Table 52: Rest of Asia Pacific Food Service Industry in Japan Revenue (billion) Forecast, by Application 2020 & 2033
Frequently Asked Questions
1. What is the projected Compound Annual Growth Rate (CAGR) of the Food Service Industry in Japan?
The projected CAGR is approximately 12.7%.
2. Which companies are prominent players in the Food Service Industry in Japan?
Key companies in the market include MOS Food Services Inc, Yum! Brands Inc, Seven & I Holdings Co Ltd, Food & Life Companies, Plenus Company Limited, Kura Sushi Inc, Toridoll Holdings Corporation, Skylark Holdings Co Ltd, Lotteria Co Ltd, Komeda Holdings Co Ltd, Domino’s Pizza Enterprises Ltd, Starbucks Corporation, Colowide Co Ltd, Yoshinoya Holdings Co Ltd, McDonald's Corporation, Zensho Holding.
3. What are the main segments of the Food Service Industry in Japan?
The market segments include Foodservice Type, Outlet, Location.
4. Can you provide details about the market size?
The market size is estimated to be USD 256.5 billion as of 2022.
5. What are some drivers contributing to market growth?
Rising Health Consciousness among consumer.
6. What are the notable trends driving market growth?
Quick service restaurants held the major share in the market due to the constant launch of new products.
7. Are there any restraints impacting market growth?
High Cost of natural Ingredients.
8. Can you provide examples of recent developments in the market?
April 2023: McDonald's Corporation partnered with One Piece, a Japanese anime franchise, to launch a newer version of the burger, i.e., the Chicken Tatsuta Burger. The packaging has been themed with One Piece imagery.April 2023: KFC launched a range of hash brown burgers available nationwide, including Karihoku Hash Filet Burger, Karihoku Hash Filet BBQ Burger, and Karihoku Hash Filet Spicy Burger.April 2023: In Japan, Starbucks introduced a new type of coffee drink called Oleato™, consisting of arabica coffee and Partanna® extra virgin olive oil.
9. What pricing options are available for accessing the report?
Pricing options include single-user, multi-user, and enterprise licenses priced at USD 3800, USD 4500, and USD 5800 respectively.
10. Is the market size provided in terms of value or volume?
The market size is provided in terms of value, measured in billion.
11. Are there any specific market keywords associated with the report?
Yes, the market keyword associated with the report is "Food Service Industry in Japan," which aids in identifying and referencing the specific market segment covered.
12. How do I determine which pricing option suits my needs best?
The pricing options vary based on user requirements and access needs. Individual users may opt for single-user licenses, while businesses requiring broader access may choose multi-user or enterprise licenses for cost-effective access to the report.
13. Are there any additional resources or data provided in the Food Service Industry in Japan report?
While the report offers comprehensive insights, it's advisable to review the specific contents or supplementary materials provided to ascertain if additional resources or data are available.
14. How can I stay updated on further developments or reports in the Food Service Industry in Japan?
To stay informed about further developments, trends, and reports in the Food Service Industry in Japan, consider subscribing to industry newsletters, following relevant companies and organizations, or regularly checking reputable industry news sources and publications.
Methodology
Step 1 - Identification of Relevant Samples Size from Population Database


Step 2 - Approaches for Defining Global Market Size (Value, Volume* & Price*)

Note*: In applicable scenarios
Step 3 - Data Sources
Primary Research
- Web Analytics
- Survey Reports
- Research Institute
- Latest Research Reports
- Opinion Leaders
Secondary Research
- Annual Reports
- White Paper
- Latest Press Release
- Industry Association
- Paid Database
- Investor Presentations

Step 4 - Data Triangulation
Involves using different sources of information in order to increase the validity of a study
These sources are likely to be stakeholders in a program - participants, other researchers, program staff, other community members, and so on.
Then we put all data in single framework & apply various statistical tools to find out the dynamic on the market.
During the analysis stage, feedback from the stakeholder groups would be compared to determine areas of agreement as well as areas of divergence