

Key Insights
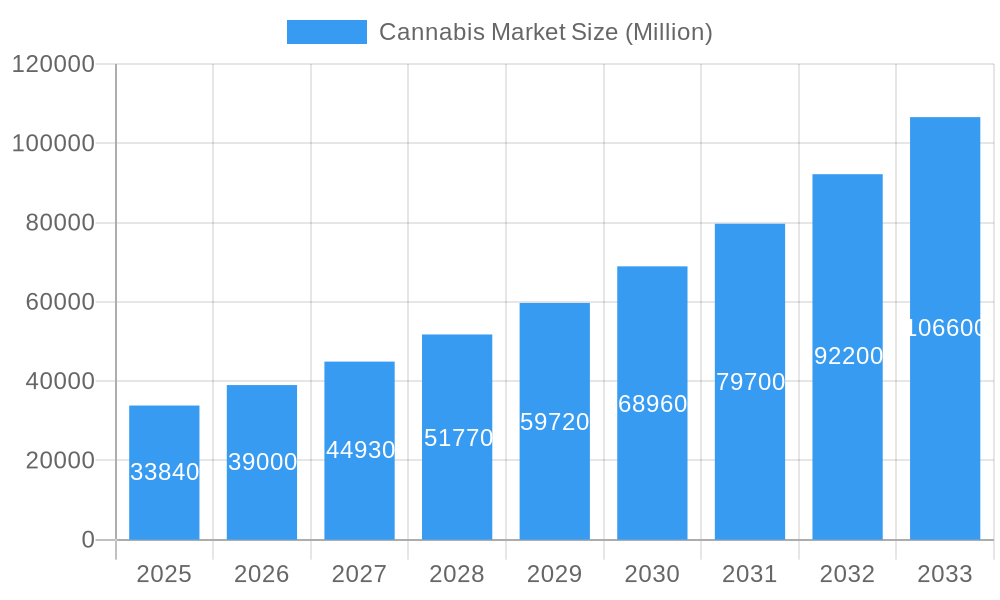
The global cannabis market, valued at $33.84 billion in 2025, is projected to experience robust growth, exhibiting a Compound Annual Growth Rate (CAGR) of 15.40% from 2025 to 2033. This expansion is fueled by several key factors. Increasing legalization and acceptance of cannabis for both medical and recreational use in various regions are primary drivers. Growing scientific research highlighting the therapeutic potential of cannabinoids like THC and CBD is further boosting market demand, particularly within the medical cannabis segment. Consumer preferences are shifting towards diverse product formats, including capsules, concentrates, and edibles, contributing to market diversification. Technological advancements in cannabis cultivation and extraction methods are also enhancing product quality and efficiency, impacting overall market growth. However, regulatory hurdles in some regions, concerns regarding potential side effects, and ongoing public perception challenges pose certain restraints to market expansion. Nevertheless, the overall market trajectory suggests a significant increase in market value over the forecast period.
Cannabis Market Market Size (In Billion)
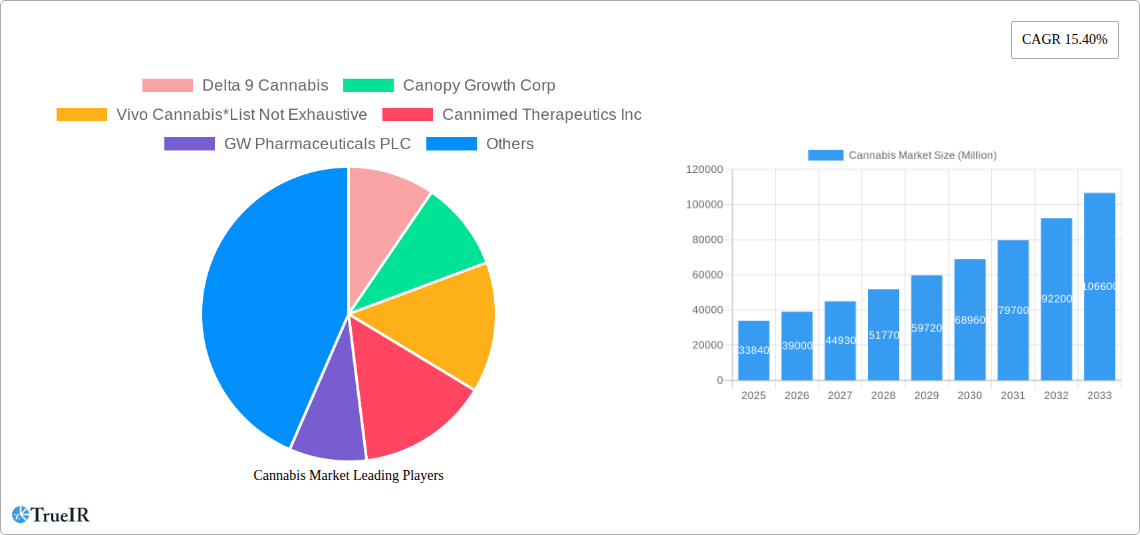
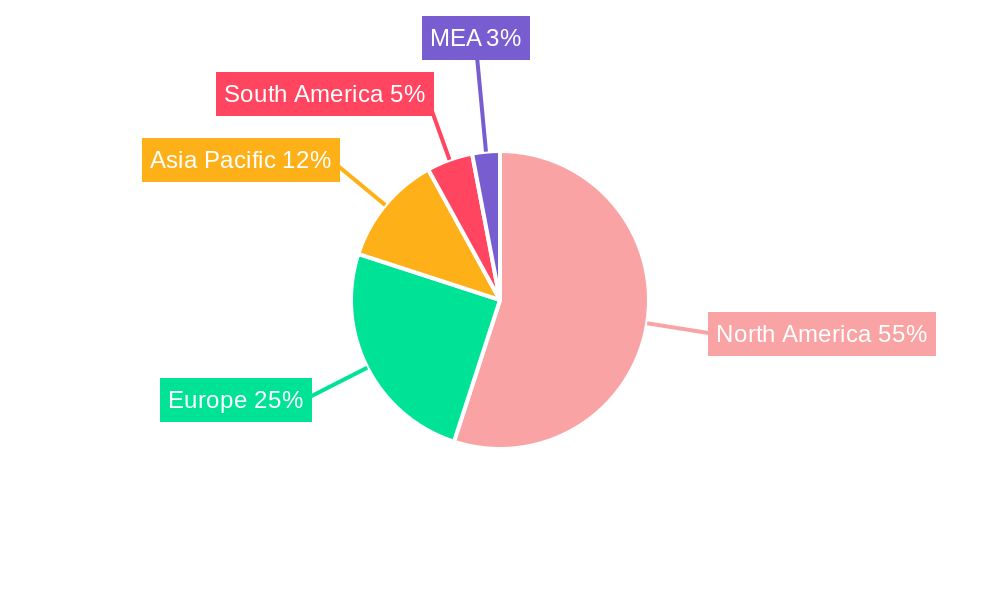
The market segmentation reveals valuable insights into consumer behavior and industry dynamics. The product type segment is expected to see strong growth across capsules, concentrates, and edibles, reflecting evolving consumer preferences. The application segment, divided between medical and recreational use, highlights the dual nature of the market and its varied growth drivers. The compound type segment, focusing on THC, CBD, and balanced THC & CBD products, reflects the diverse therapeutic and recreational applications of these cannabinoids. Geographically, North America (including the United States and Canada) currently dominates the market, benefiting from early legalization and a well-established industry infrastructure. However, significant growth potential exists in other regions like Europe and Asia Pacific as legalization efforts gain momentum and consumer awareness increases. Leading companies like Delta 9 Cannabis, Canopy Growth Corp, and Tilray are strategically positioning themselves to capture market share through product innovation, expansion into new markets, and strategic partnerships. The ongoing market evolution will continue to shape the competitive landscape, with companies focusing on meeting evolving consumer demands and navigating regulatory complexities.
Cannabis Market Company Market Share
Cannabis Market: A Comprehensive Market Report (2019-2033)
This dynamic report provides a detailed analysis of the global cannabis market, offering invaluable insights for investors, industry professionals, and researchers. We delve into market structure, competitive dynamics, emerging trends, and future growth projections, covering the period from 2019 to 2033. The report leverages extensive data and qualitative analysis to provide a complete understanding of this rapidly evolving industry. With a focus on key players like Delta 9 Cannabis, Canopy Growth Corp, and Vivo Cannabis, this report is essential for navigating the complexities of the cannabis market.
Cannabis Market Structure & Competitive Landscape
The global cannabis market exhibits a complex interplay of factors influencing its structure and competitive landscape. Market concentration varies significantly across regions, with some dominated by a few large players, while others feature a more fragmented landscape. The market's dynamics are driven by continuous innovation in product development (e.g., new delivery methods, compound formulations), shifting regulatory environments, and the emergence of substitute products. End-user segmentation (medical vs. recreational) significantly impacts product demand and pricing strategies. Furthermore, the market witnesses substantial mergers and acquisitions (M&A) activity, reflecting the consolidation trend among major players.
- Market Concentration: The Herfindahl-Hirschman Index (HHI) for the global market is estimated to be xx in 2025, indicating a moderately concentrated market. Regional variations exist, with some markets showing higher concentration.
- Innovation Drivers: The continuous development of new product formulations (e.g., nano-emulsions, advanced extraction techniques) and delivery systems drives innovation, enhancing consumer experience and market penetration.
- Regulatory Impacts: Varying regulations across jurisdictions create significant market complexities and barriers to entry, influencing market structure and growth potential.
- Product Substitutes: The availability of alternative therapies and treatments presents a degree of substitution, impacting market share of specific cannabis products.
- End-User Segmentation: The medical cannabis segment is projected to account for xx Million in revenue in 2025, while the recreational segment is estimated at xx Million. This ratio is expected to shift based on evolving regulations and consumer preferences.
- M&A Trends: The total value of M&A transactions in the cannabis sector reached xx Million in 2024, with a projected increase to xx Million by 2028 as industry consolidation accelerates.
Cannabis Market Trends & Opportunities
The global cannabis market is experiencing exponential growth, driven by a confluence of factors. Market size is expanding rapidly, with a Compound Annual Growth Rate (CAGR) projected at xx% from 2025 to 2033. Technological advancements, such as advancements in extraction and cultivation techniques, are continuously improving product quality and efficiency. Evolving consumer preferences towards specific product types (e.g., increasing demand for CBD products) and application methods (e.g., vape pens) are reshaping market demand. The competitive landscape remains dynamic, with companies focusing on strategic partnerships, brand building, and market expansion to secure market share. Market penetration rates for cannabis products vary significantly across regions, reflecting differences in consumer awareness, acceptance, and access. The overall market size is estimated at xx Million in 2025, poised to reach xx Million by 2033.
Dominant Markets & Segments in Cannabis Market
The North American market currently dominates the global cannabis landscape, driven by factors such as relatively progressive regulatory environments in several states and provinces. Within North America, the United States and Canada represent the largest markets. However, significant growth potential exists in other regions as legalization and acceptance continue to expand globally.
Key Growth Drivers:
- Progressive Regulatory Environments: Legalization and decriminalization efforts in various jurisdictions are critical drivers of market growth.
- Increased Consumer Awareness: Growing awareness of the therapeutic benefits of cannabis and its various applications is fueling market demand.
- Technological Advancements: Improved cultivation techniques, extraction methods, and product formulations are enhancing product quality and appeal.
- Strong Investment in Research and Development: This leads to increased knowledge of the potential benefits and applications of cannabis.
Market Dominance Analysis:
- Product Type: Edibles are projected to hold a significant market share, followed by concentrates and capsules, driven by increasing consumer preference for convenient and diverse consumption options. Other product types, such as topicals and tinctures, represent smaller but growing segments.
- Application: The recreational market is experiencing rapid growth, but the medical application segment remains significant, driven by the increasing recognition of cannabis’ therapeutic properties.
- Compound Type: THC-dominant products remain highly popular in the recreational market, while CBD-dominant products are gaining traction in both medical and recreational segments due to their purported therapeutic effects without the psychoactive effects. Balanced THC & CBD products offer a blend of benefits and are becoming increasingly popular.
Cannabis Market Product Analysis
The cannabis market showcases a wide array of products, including capsules, concentrates, edibles, and other forms. Technological advancements are continually driving product innovation, leading to new delivery methods, enhanced efficacy, and improved consumer experience. Products are tailored to meet diverse consumer needs and preferences, from those seeking relaxation to those with medical conditions. Companies are employing various strategies to differentiate their offerings, including focusing on specific compound types, creating unique formulations, and developing convenient delivery systems.
Key Drivers, Barriers & Challenges in Cannabis Market
Key Drivers:
The cannabis market's growth is primarily fueled by factors like increasing legalization and acceptance, growing consumer demand for alternative therapies, and technological advancements enhancing cultivation and product development. Further, the potential therapeutic benefits of cannabis and cannabinoids drive significant investment in research and development, leading to a wider range of products and applications.
Challenges and Restraints:
The cannabis industry faces significant challenges, including stringent regulations and licensing requirements that limit market entry and expansion. Supply chain complexities and inconsistencies in product quality impact market stability. Moreover, intense competition and price pressures challenge profitability. The uncertainty surrounding future regulations poses a considerable risk, impacting investment decisions and long-term market development. These factors combined may restrict the growth of the market if not addressed effectively.
Growth Drivers in the Cannabis Market
The continued legalization and decriminalization of cannabis in various regions globally remain a major driver. Technological innovations in cultivation, processing, and product development significantly contribute to market expansion. Increased consumer awareness about the potential health benefits of cannabis is also a crucial factor. Furthermore, significant investments in research and development lead to new product offerings, widening the market appeal.
Challenges Impacting Cannabis Market Growth
Stringent regulations and licensing requirements create barriers to market entry for many businesses. Inconsistencies in product quality and safety regulations can impact consumer confidence. Supply chain vulnerabilities, due to the unique regulatory landscape, pose significant challenges to market expansion. The competitive landscape is becoming increasingly intense, with price pressures affecting margins.
Key Players Shaping the Cannabis Market
- Delta 9 Cannabis
- Canopy Growth Corp
- Vivo Cannabis
- Cannimed Therapeutics Inc
- GW Pharmaceuticals PLC
- Aphria Inc
- Tilray
- CV Sciences Inc
- MedReLeaf Corp
- Aurora Cannabis Inc
Significant Cannabis Market Industry Milestones
- May 2023: Toast and Nirvana Group partnered to launch innovative cannabis products in Oklahoma and New Mexico. This signifies expansion into new markets and potentially increased competition.
- April 2023: Hello Juice and Smoothie partnered with Beleaf Co. to introduce CBD-infused juice shots, indicating growing consumer demand for CBD products in diverse formats.
- May 2022: Canopy Growth launched new flavors of cannabis-infused carbonated drinks, demonstrating the ongoing innovation in product offerings to cater to evolving consumer preferences.
Future Outlook for Cannabis Market
The cannabis market is poised for continued growth, driven by ongoing legalization efforts, expanding consumer acceptance, and innovation in product development. Strategic partnerships and mergers & acquisitions will likely shape the competitive landscape. New product formats, targeted marketing campaigns, and a deeper understanding of consumer preferences will drive market expansion. The market holds substantial potential for growth across various segments and regions, particularly as the regulatory environment evolves towards greater acceptance and accessibility.
Cannabis Market Segmentation
- 1. Production Analysis
- 2. Consumption Analysis
- 3. Import Market Analysis (Value & Volume)
- 4. Export Market Analysis (Value & Volume)
- 5. Price Trend Analysis
Cannabis Market Segmentation By Geography
-
1. North America
- 1.1. United States
- 1.2. Canada
- 1.3. Mexico
-
2. South America
- 2.1. Brazil
- 2.2. Argentina
- 2.3. Rest of South America
-
3. Europe
- 3.1. United Kingdom
- 3.2. Germany
- 3.3. France
- 3.4. Italy
- 3.5. Spain
- 3.6. Russia
- 3.7. Benelux
- 3.8. Nordics
- 3.9. Rest of Europe
-
4. Middle East & Africa
- 4.1. Turkey
- 4.2. Israel
- 4.3. GCC
- 4.4. North Africa
- 4.5. South Africa
- 4.6. Rest of Middle East & Africa
-
5. Asia Pacific
- 5.1. China
- 5.2. India
- 5.3. Japan
- 5.4. South Korea
- 5.5. ASEAN
- 5.6. Oceania
- 5.7. Rest of Asia Pacific
Cannabis Market Regional Market Share
Geographic Coverage of Cannabis Market
Cannabis Market REPORT HIGHLIGHTS
| Aspects | Details |
|---|---|
| Study Period | 2020-2034 |
| Base Year | 2025 |
| Estimated Year | 2026 |
| Forecast Period | 2026-2034 |
| Historical Period | 2020-2025 |
| Growth Rate | CAGR of 15.40% from 2020-2034 |
| Segmentation |
|
Table of Contents
- 1. Introduction
- 1.1. Research Scope
- 1.2. Market Segmentation
- 1.3. Research Methodology
- 1.4. Definitions and Assumptions
- 2. Executive Summary
- 2.1. Introduction
- 3. Market Dynamics
- 3.1. Introduction
- 3.2. Market Drivers
- 3.2.1. Increasing Legalization of Cannabis; Growing Focus on Health Benefits of Cannabis
- 3.3. Market Restrains
- 3.3.1. Lack of Data on Dosages and Results; Lack of Access to Financial Assistance
- 3.4. Market Trends
- 3.4.1. Legalization of Cannabis
- 4. Market Factor Analysis
- 4.1. Porters Five Forces
- 4.2. Supply/Value Chain
- 4.3. PESTEL analysis
- 4.4. Market Entropy
- 4.5. Patent/Trademark Analysis
- 5. Global Cannabis Market Analysis, Insights and Forecast, 2020-2032
- 5.1. Market Analysis, Insights and Forecast - by Production Analysis
- 5.2. Market Analysis, Insights and Forecast - by Consumption Analysis
- 5.3. Market Analysis, Insights and Forecast - by Import Market Analysis (Value & Volume)
- 5.4. Market Analysis, Insights and Forecast - by Export Market Analysis (Value & Volume)
- 5.5. Market Analysis, Insights and Forecast - by Price Trend Analysis
- 5.6. Market Analysis, Insights and Forecast - by Region
- 5.6.1. North America
- 5.6.2. South America
- 5.6.3. Europe
- 5.6.4. Middle East & Africa
- 5.6.5. Asia Pacific
- 5.1. Market Analysis, Insights and Forecast - by Production Analysis
- 6. North America Cannabis Market Analysis, Insights and Forecast, 2020-2032
- 6.1. Market Analysis, Insights and Forecast - by Production Analysis
- 6.2. Market Analysis, Insights and Forecast - by Consumption Analysis
- 6.3. Market Analysis, Insights and Forecast - by Import Market Analysis (Value & Volume)
- 6.4. Market Analysis, Insights and Forecast - by Export Market Analysis (Value & Volume)
- 6.5. Market Analysis, Insights and Forecast - by Price Trend Analysis
- 6.1. Market Analysis, Insights and Forecast - by Production Analysis
- 7. South America Cannabis Market Analysis, Insights and Forecast, 2020-2032
- 7.1. Market Analysis, Insights and Forecast - by Production Analysis
- 7.2. Market Analysis, Insights and Forecast - by Consumption Analysis
- 7.3. Market Analysis, Insights and Forecast - by Import Market Analysis (Value & Volume)
- 7.4. Market Analysis, Insights and Forecast - by Export Market Analysis (Value & Volume)
- 7.5. Market Analysis, Insights and Forecast - by Price Trend Analysis
- 7.1. Market Analysis, Insights and Forecast - by Production Analysis
- 8. Europe Cannabis Market Analysis, Insights and Forecast, 2020-2032
- 8.1. Market Analysis, Insights and Forecast - by Production Analysis
- 8.2. Market Analysis, Insights and Forecast - by Consumption Analysis
- 8.3. Market Analysis, Insights and Forecast - by Import Market Analysis (Value & Volume)
- 8.4. Market Analysis, Insights and Forecast - by Export Market Analysis (Value & Volume)
- 8.5. Market Analysis, Insights and Forecast - by Price Trend Analysis
- 8.1. Market Analysis, Insights and Forecast - by Production Analysis
- 9. Middle East & Africa Cannabis Market Analysis, Insights and Forecast, 2020-2032
- 9.1. Market Analysis, Insights and Forecast - by Production Analysis
- 9.2. Market Analysis, Insights and Forecast - by Consumption Analysis
- 9.3. Market Analysis, Insights and Forecast - by Import Market Analysis (Value & Volume)
- 9.4. Market Analysis, Insights and Forecast - by Export Market Analysis (Value & Volume)
- 9.5. Market Analysis, Insights and Forecast - by Price Trend Analysis
- 9.1. Market Analysis, Insights and Forecast - by Production Analysis
- 10. Asia Pacific Cannabis Market Analysis, Insights and Forecast, 2020-2032
- 10.1. Market Analysis, Insights and Forecast - by Production Analysis
- 10.2. Market Analysis, Insights and Forecast - by Consumption Analysis
- 10.3. Market Analysis, Insights and Forecast - by Import Market Analysis (Value & Volume)
- 10.4. Market Analysis, Insights and Forecast - by Export Market Analysis (Value & Volume)
- 10.5. Market Analysis, Insights and Forecast - by Price Trend Analysis
- 10.1. Market Analysis, Insights and Forecast - by Production Analysis
- 11. Competitive Analysis
- 11.1. Global Market Share Analysis 2025
- 11.2. Company Profiles
- 11.2.1 Delta 9 Cannabis
- 11.2.1.1. Overview
- 11.2.1.2. Products
- 11.2.1.3. SWOT Analysis
- 11.2.1.4. Recent Developments
- 11.2.1.5. Financials (Based on Availability)
- 11.2.2 Canopy Growth Corp
- 11.2.2.1. Overview
- 11.2.2.2. Products
- 11.2.2.3. SWOT Analysis
- 11.2.2.4. Recent Developments
- 11.2.2.5. Financials (Based on Availability)
- 11.2.3 Vivo Cannabis*List Not Exhaustive
- 11.2.3.1. Overview
- 11.2.3.2. Products
- 11.2.3.3. SWOT Analysis
- 11.2.3.4. Recent Developments
- 11.2.3.5. Financials (Based on Availability)
- 11.2.4 Cannimed Therapeutics Inc
- 11.2.4.1. Overview
- 11.2.4.2. Products
- 11.2.4.3. SWOT Analysis
- 11.2.4.4. Recent Developments
- 11.2.4.5. Financials (Based on Availability)
- 11.2.5 GW Pharmaceuticals PLC
- 11.2.5.1. Overview
- 11.2.5.2. Products
- 11.2.5.3. SWOT Analysis
- 11.2.5.4. Recent Developments
- 11.2.5.5. Financials (Based on Availability)
- 11.2.6 Aphria Inc
- 11.2.6.1. Overview
- 11.2.6.2. Products
- 11.2.6.3. SWOT Analysis
- 11.2.6.4. Recent Developments
- 11.2.6.5. Financials (Based on Availability)
- 11.2.7 Tilray
- 11.2.7.1. Overview
- 11.2.7.2. Products
- 11.2.7.3. SWOT Analysis
- 11.2.7.4. Recent Developments
- 11.2.7.5. Financials (Based on Availability)
- 11.2.8 CV Sciences Inc
- 11.2.8.1. Overview
- 11.2.8.2. Products
- 11.2.8.3. SWOT Analysis
- 11.2.8.4. Recent Developments
- 11.2.8.5. Financials (Based on Availability)
- 11.2.9 MedReLeaf Corp
- 11.2.9.1. Overview
- 11.2.9.2. Products
- 11.2.9.3. SWOT Analysis
- 11.2.9.4. Recent Developments
- 11.2.9.5. Financials (Based on Availability)
- 11.2.10 Aurora Cannabis Inc
- 11.2.10.1. Overview
- 11.2.10.2. Products
- 11.2.10.3. SWOT Analysis
- 11.2.10.4. Recent Developments
- 11.2.10.5. Financials (Based on Availability)
- 11.2.1 Delta 9 Cannabis
List of Figures
- Figure 1: Global Cannabis Market Revenue Breakdown (Million, %) by Region 2025 & 2033
- Figure 2: Global Cannabis Market Volume Breakdown (Kiloton, %) by Region 2025 & 2033
- Figure 3: North America Cannabis Market Revenue (Million), by Production Analysis 2025 & 2033
- Figure 4: North America Cannabis Market Volume (Kiloton), by Production Analysis 2025 & 2033
- Figure 5: North America Cannabis Market Revenue Share (%), by Production Analysis 2025 & 2033
- Figure 6: North America Cannabis Market Volume Share (%), by Production Analysis 2025 & 2033
- Figure 7: North America Cannabis Market Revenue (Million), by Consumption Analysis 2025 & 2033
- Figure 8: North America Cannabis Market Volume (Kiloton), by Consumption Analysis 2025 & 2033
- Figure 9: North America Cannabis Market Revenue Share (%), by Consumption Analysis 2025 & 2033
- Figure 10: North America Cannabis Market Volume Share (%), by Consumption Analysis 2025 & 2033
- Figure 11: North America Cannabis Market Revenue (Million), by Import Market Analysis (Value & Volume) 2025 & 2033
- Figure 12: North America Cannabis Market Volume (Kiloton), by Import Market Analysis (Value & Volume) 2025 & 2033
- Figure 13: North America Cannabis Market Revenue Share (%), by Import Market Analysis (Value & Volume) 2025 & 2033
- Figure 14: North America Cannabis Market Volume Share (%), by Import Market Analysis (Value & Volume) 2025 & 2033
- Figure 15: North America Cannabis Market Revenue (Million), by Export Market Analysis (Value & Volume) 2025 & 2033
- Figure 16: North America Cannabis Market Volume (Kiloton), by Export Market Analysis (Value & Volume) 2025 & 2033
- Figure 17: North America Cannabis Market Revenue Share (%), by Export Market Analysis (Value & Volume) 2025 & 2033
- Figure 18: North America Cannabis Market Volume Share (%), by Export Market Analysis (Value & Volume) 2025 & 2033
- Figure 19: North America Cannabis Market Revenue (Million), by Price Trend Analysis 2025 & 2033
- Figure 20: North America Cannabis Market Volume (Kiloton), by Price Trend Analysis 2025 & 2033
- Figure 21: North America Cannabis Market Revenue Share (%), by Price Trend Analysis 2025 & 2033
- Figure 22: North America Cannabis Market Volume Share (%), by Price Trend Analysis 2025 & 2033
- Figure 23: North America Cannabis Market Revenue (Million), by Country 2025 & 2033
- Figure 24: North America Cannabis Market Volume (Kiloton), by Country 2025 & 2033
- Figure 25: North America Cannabis Market Revenue Share (%), by Country 2025 & 2033
- Figure 26: North America Cannabis Market Volume Share (%), by Country 2025 & 2033
- Figure 27: South America Cannabis Market Revenue (Million), by Production Analysis 2025 & 2033
- Figure 28: South America Cannabis Market Volume (Kiloton), by Production Analysis 2025 & 2033
- Figure 29: South America Cannabis Market Revenue Share (%), by Production Analysis 2025 & 2033
- Figure 30: South America Cannabis Market Volume Share (%), by Production Analysis 2025 & 2033
- Figure 31: South America Cannabis Market Revenue (Million), by Consumption Analysis 2025 & 2033
- Figure 32: South America Cannabis Market Volume (Kiloton), by Consumption Analysis 2025 & 2033
- Figure 33: South America Cannabis Market Revenue Share (%), by Consumption Analysis 2025 & 2033
- Figure 34: South America Cannabis Market Volume Share (%), by Consumption Analysis 2025 & 2033
- Figure 35: South America Cannabis Market Revenue (Million), by Import Market Analysis (Value & Volume) 2025 & 2033
- Figure 36: South America Cannabis Market Volume (Kiloton), by Import Market Analysis (Value & Volume) 2025 & 2033
- Figure 37: South America Cannabis Market Revenue Share (%), by Import Market Analysis (Value & Volume) 2025 & 2033
- Figure 38: South America Cannabis Market Volume Share (%), by Import Market Analysis (Value & Volume) 2025 & 2033
- Figure 39: South America Cannabis Market Revenue (Million), by Export Market Analysis (Value & Volume) 2025 & 2033
- Figure 40: South America Cannabis Market Volume (Kiloton), by Export Market Analysis (Value & Volume) 2025 & 2033
- Figure 41: South America Cannabis Market Revenue Share (%), by Export Market Analysis (Value & Volume) 2025 & 2033
- Figure 42: South America Cannabis Market Volume Share (%), by Export Market Analysis (Value & Volume) 2025 & 2033
- Figure 43: South America Cannabis Market Revenue (Million), by Price Trend Analysis 2025 & 2033
- Figure 44: South America Cannabis Market Volume (Kiloton), by Price Trend Analysis 2025 & 2033
- Figure 45: South America Cannabis Market Revenue Share (%), by Price Trend Analysis 2025 & 2033
- Figure 46: South America Cannabis Market Volume Share (%), by Price Trend Analysis 2025 & 2033
- Figure 47: South America Cannabis Market Revenue (Million), by Country 2025 & 2033
- Figure 48: South America Cannabis Market Volume (Kiloton), by Country 2025 & 2033
- Figure 49: South America Cannabis Market Revenue Share (%), by Country 2025 & 2033
- Figure 50: South America Cannabis Market Volume Share (%), by Country 2025 & 2033
- Figure 51: Europe Cannabis Market Revenue (Million), by Production Analysis 2025 & 2033
- Figure 52: Europe Cannabis Market Volume (Kiloton), by Production Analysis 2025 & 2033
- Figure 53: Europe Cannabis Market Revenue Share (%), by Production Analysis 2025 & 2033
- Figure 54: Europe Cannabis Market Volume Share (%), by Production Analysis 2025 & 2033
- Figure 55: Europe Cannabis Market Revenue (Million), by Consumption Analysis 2025 & 2033
- Figure 56: Europe Cannabis Market Volume (Kiloton), by Consumption Analysis 2025 & 2033
- Figure 57: Europe Cannabis Market Revenue Share (%), by Consumption Analysis 2025 & 2033
- Figure 58: Europe Cannabis Market Volume Share (%), by Consumption Analysis 2025 & 2033
- Figure 59: Europe Cannabis Market Revenue (Million), by Import Market Analysis (Value & Volume) 2025 & 2033
- Figure 60: Europe Cannabis Market Volume (Kiloton), by Import Market Analysis (Value & Volume) 2025 & 2033
- Figure 61: Europe Cannabis Market Revenue Share (%), by Import Market Analysis (Value & Volume) 2025 & 2033
- Figure 62: Europe Cannabis Market Volume Share (%), by Import Market Analysis (Value & Volume) 2025 & 2033
- Figure 63: Europe Cannabis Market Revenue (Million), by Export Market Analysis (Value & Volume) 2025 & 2033
- Figure 64: Europe Cannabis Market Volume (Kiloton), by Export Market Analysis (Value & Volume) 2025 & 2033
- Figure 65: Europe Cannabis Market Revenue Share (%), by Export Market Analysis (Value & Volume) 2025 & 2033
- Figure 66: Europe Cannabis Market Volume Share (%), by Export Market Analysis (Value & Volume) 2025 & 2033
- Figure 67: Europe Cannabis Market Revenue (Million), by Price Trend Analysis 2025 & 2033
- Figure 68: Europe Cannabis Market Volume (Kiloton), by Price Trend Analysis 2025 & 2033
- Figure 69: Europe Cannabis Market Revenue Share (%), by Price Trend Analysis 2025 & 2033
- Figure 70: Europe Cannabis Market Volume Share (%), by Price Trend Analysis 2025 & 2033
- Figure 71: Europe Cannabis Market Revenue (Million), by Country 2025 & 2033
- Figure 72: Europe Cannabis Market Volume (Kiloton), by Country 2025 & 2033
- Figure 73: Europe Cannabis Market Revenue Share (%), by Country 2025 & 2033
- Figure 74: Europe Cannabis Market Volume Share (%), by Country 2025 & 2033
- Figure 75: Middle East & Africa Cannabis Market Revenue (Million), by Production Analysis 2025 & 2033
- Figure 76: Middle East & Africa Cannabis Market Volume (Kiloton), by Production Analysis 2025 & 2033
- Figure 77: Middle East & Africa Cannabis Market Revenue Share (%), by Production Analysis 2025 & 2033
- Figure 78: Middle East & Africa Cannabis Market Volume Share (%), by Production Analysis 2025 & 2033
- Figure 79: Middle East & Africa Cannabis Market Revenue (Million), by Consumption Analysis 2025 & 2033
- Figure 80: Middle East & Africa Cannabis Market Volume (Kiloton), by Consumption Analysis 2025 & 2033
- Figure 81: Middle East & Africa Cannabis Market Revenue Share (%), by Consumption Analysis 2025 & 2033
- Figure 82: Middle East & Africa Cannabis Market Volume Share (%), by Consumption Analysis 2025 & 2033
- Figure 83: Middle East & Africa Cannabis Market Revenue (Million), by Import Market Analysis (Value & Volume) 2025 & 2033
- Figure 84: Middle East & Africa Cannabis Market Volume (Kiloton), by Import Market Analysis (Value & Volume) 2025 & 2033
- Figure 85: Middle East & Africa Cannabis Market Revenue Share (%), by Import Market Analysis (Value & Volume) 2025 & 2033
- Figure 86: Middle East & Africa Cannabis Market Volume Share (%), by Import Market Analysis (Value & Volume) 2025 & 2033
- Figure 87: Middle East & Africa Cannabis Market Revenue (Million), by Export Market Analysis (Value & Volume) 2025 & 2033
- Figure 88: Middle East & Africa Cannabis Market Volume (Kiloton), by Export Market Analysis (Value & Volume) 2025 & 2033
- Figure 89: Middle East & Africa Cannabis Market Revenue Share (%), by Export Market Analysis (Value & Volume) 2025 & 2033
- Figure 90: Middle East & Africa Cannabis Market Volume Share (%), by Export Market Analysis (Value & Volume) 2025 & 2033
- Figure 91: Middle East & Africa Cannabis Market Revenue (Million), by Price Trend Analysis 2025 & 2033
- Figure 92: Middle East & Africa Cannabis Market Volume (Kiloton), by Price Trend Analysis 2025 & 2033
- Figure 93: Middle East & Africa Cannabis Market Revenue Share (%), by Price Trend Analysis 2025 & 2033
- Figure 94: Middle East & Africa Cannabis Market Volume Share (%), by Price Trend Analysis 2025 & 2033
- Figure 95: Middle East & Africa Cannabis Market Revenue (Million), by Country 2025 & 2033
- Figure 96: Middle East & Africa Cannabis Market Volume (Kiloton), by Country 2025 & 2033
- Figure 97: Middle East & Africa Cannabis Market Revenue Share (%), by Country 2025 & 2033
- Figure 98: Middle East & Africa Cannabis Market Volume Share (%), by Country 2025 & 2033
- Figure 99: Asia Pacific Cannabis Market Revenue (Million), by Production Analysis 2025 & 2033
- Figure 100: Asia Pacific Cannabis Market Volume (Kiloton), by Production Analysis 2025 & 2033
- Figure 101: Asia Pacific Cannabis Market Revenue Share (%), by Production Analysis 2025 & 2033
- Figure 102: Asia Pacific Cannabis Market Volume Share (%), by Production Analysis 2025 & 2033
- Figure 103: Asia Pacific Cannabis Market Revenue (Million), by Consumption Analysis 2025 & 2033
- Figure 104: Asia Pacific Cannabis Market Volume (Kiloton), by Consumption Analysis 2025 & 2033
- Figure 105: Asia Pacific Cannabis Market Revenue Share (%), by Consumption Analysis 2025 & 2033
- Figure 106: Asia Pacific Cannabis Market Volume Share (%), by Consumption Analysis 2025 & 2033
- Figure 107: Asia Pacific Cannabis Market Revenue (Million), by Import Market Analysis (Value & Volume) 2025 & 2033
- Figure 108: Asia Pacific Cannabis Market Volume (Kiloton), by Import Market Analysis (Value & Volume) 2025 & 2033
- Figure 109: Asia Pacific Cannabis Market Revenue Share (%), by Import Market Analysis (Value & Volume) 2025 & 2033
- Figure 110: Asia Pacific Cannabis Market Volume Share (%), by Import Market Analysis (Value & Volume) 2025 & 2033
- Figure 111: Asia Pacific Cannabis Market Revenue (Million), by Export Market Analysis (Value & Volume) 2025 & 2033
- Figure 112: Asia Pacific Cannabis Market Volume (Kiloton), by Export Market Analysis (Value & Volume) 2025 & 2033
- Figure 113: Asia Pacific Cannabis Market Revenue Share (%), by Export Market Analysis (Value & Volume) 2025 & 2033
- Figure 114: Asia Pacific Cannabis Market Volume Share (%), by Export Market Analysis (Value & Volume) 2025 & 2033
- Figure 115: Asia Pacific Cannabis Market Revenue (Million), by Price Trend Analysis 2025 & 2033
- Figure 116: Asia Pacific Cannabis Market Volume (Kiloton), by Price Trend Analysis 2025 & 2033
- Figure 117: Asia Pacific Cannabis Market Revenue Share (%), by Price Trend Analysis 2025 & 2033
- Figure 118: Asia Pacific Cannabis Market Volume Share (%), by Price Trend Analysis 2025 & 2033
- Figure 119: Asia Pacific Cannabis Market Revenue (Million), by Country 2025 & 2033
- Figure 120: Asia Pacific Cannabis Market Volume (Kiloton), by Country 2025 & 2033
- Figure 121: Asia Pacific Cannabis Market Revenue Share (%), by Country 2025 & 2033
- Figure 122: Asia Pacific Cannabis Market Volume Share (%), by Country 2025 & 2033
List of Tables
- Table 1: Global Cannabis Market Revenue Million Forecast, by Production Analysis 2020 & 2033
- Table 2: Global Cannabis Market Volume Kiloton Forecast, by Production Analysis 2020 & 2033
- Table 3: Global Cannabis Market Revenue Million Forecast, by Consumption Analysis 2020 & 2033
- Table 4: Global Cannabis Market Volume Kiloton Forecast, by Consumption Analysis 2020 & 2033
- Table 5: Global Cannabis Market Revenue Million Forecast, by Import Market Analysis (Value & Volume) 2020 & 2033
- Table 6: Global Cannabis Market Volume Kiloton Forecast, by Import Market Analysis (Value & Volume) 2020 & 2033
- Table 7: Global Cannabis Market Revenue Million Forecast, by Export Market Analysis (Value & Volume) 2020 & 2033
- Table 8: Global Cannabis Market Volume Kiloton Forecast, by Export Market Analysis (Value & Volume) 2020 & 2033
- Table 9: Global Cannabis Market Revenue Million Forecast, by Price Trend Analysis 2020 & 2033
- Table 10: Global Cannabis Market Volume Kiloton Forecast, by Price Trend Analysis 2020 & 2033
- Table 11: Global Cannabis Market Revenue Million Forecast, by Region 2020 & 2033
- Table 12: Global Cannabis Market Volume Kiloton Forecast, by Region 2020 & 2033
- Table 13: Global Cannabis Market Revenue Million Forecast, by Production Analysis 2020 & 2033
- Table 14: Global Cannabis Market Volume Kiloton Forecast, by Production Analysis 2020 & 2033
- Table 15: Global Cannabis Market Revenue Million Forecast, by Consumption Analysis 2020 & 2033
- Table 16: Global Cannabis Market Volume Kiloton Forecast, by Consumption Analysis 2020 & 2033
- Table 17: Global Cannabis Market Revenue Million Forecast, by Import Market Analysis (Value & Volume) 2020 & 2033
- Table 18: Global Cannabis Market Volume Kiloton Forecast, by Import Market Analysis (Value & Volume) 2020 & 2033
- Table 19: Global Cannabis Market Revenue Million Forecast, by Export Market Analysis (Value & Volume) 2020 & 2033
- Table 20: Global Cannabis Market Volume Kiloton Forecast, by Export Market Analysis (Value & Volume) 2020 & 2033
- Table 21: Global Cannabis Market Revenue Million Forecast, by Price Trend Analysis 2020 & 2033
- Table 22: Global Cannabis Market Volume Kiloton Forecast, by Price Trend Analysis 2020 & 2033
- Table 23: Global Cannabis Market Revenue Million Forecast, by Country 2020 & 2033
- Table 24: Global Cannabis Market Volume Kiloton Forecast, by Country 2020 & 2033
- Table 25: United States Cannabis Market Revenue (Million) Forecast, by Application 2020 & 2033
- Table 26: United States Cannabis Market Volume (Kiloton) Forecast, by Application 2020 & 2033
- Table 27: Canada Cannabis Market Revenue (Million) Forecast, by Application 2020 & 2033
- Table 28: Canada Cannabis Market Volume (Kiloton) Forecast, by Application 2020 & 2033
- Table 29: Mexico Cannabis Market Revenue (Million) Forecast, by Application 2020 & 2033
- Table 30: Mexico Cannabis Market Volume (Kiloton) Forecast, by Application 2020 & 2033
- Table 31: Global Cannabis Market Revenue Million Forecast, by Production Analysis 2020 & 2033
- Table 32: Global Cannabis Market Volume Kiloton Forecast, by Production Analysis 2020 & 2033
- Table 33: Global Cannabis Market Revenue Million Forecast, by Consumption Analysis 2020 & 2033
- Table 34: Global Cannabis Market Volume Kiloton Forecast, by Consumption Analysis 2020 & 2033
- Table 35: Global Cannabis Market Revenue Million Forecast, by Import Market Analysis (Value & Volume) 2020 & 2033
- Table 36: Global Cannabis Market Volume Kiloton Forecast, by Import Market Analysis (Value & Volume) 2020 & 2033
- Table 37: Global Cannabis Market Revenue Million Forecast, by Export Market Analysis (Value & Volume) 2020 & 2033
- Table 38: Global Cannabis Market Volume Kiloton Forecast, by Export Market Analysis (Value & Volume) 2020 & 2033
- Table 39: Global Cannabis Market Revenue Million Forecast, by Price Trend Analysis 2020 & 2033
- Table 40: Global Cannabis Market Volume Kiloton Forecast, by Price Trend Analysis 2020 & 2033
- Table 41: Global Cannabis Market Revenue Million Forecast, by Country 2020 & 2033
- Table 42: Global Cannabis Market Volume Kiloton Forecast, by Country 2020 & 2033
- Table 43: Brazil Cannabis Market Revenue (Million) Forecast, by Application 2020 & 2033
- Table 44: Brazil Cannabis Market Volume (Kiloton) Forecast, by Application 2020 & 2033
- Table 45: Argentina Cannabis Market Revenue (Million) Forecast, by Application 2020 & 2033
- Table 46: Argentina Cannabis Market Volume (Kiloton) Forecast, by Application 2020 & 2033
- Table 47: Rest of South America Cannabis Market Revenue (Million) Forecast, by Application 2020 & 2033
- Table 48: Rest of South America Cannabis Market Volume (Kiloton) Forecast, by Application 2020 & 2033
- Table 49: Global Cannabis Market Revenue Million Forecast, by Production Analysis 2020 & 2033
- Table 50: Global Cannabis Market Volume Kiloton Forecast, by Production Analysis 2020 & 2033
- Table 51: Global Cannabis Market Revenue Million Forecast, by Consumption Analysis 2020 & 2033
- Table 52: Global Cannabis Market Volume Kiloton Forecast, by Consumption Analysis 2020 & 2033
- Table 53: Global Cannabis Market Revenue Million Forecast, by Import Market Analysis (Value & Volume) 2020 & 2033
- Table 54: Global Cannabis Market Volume Kiloton Forecast, by Import Market Analysis (Value & Volume) 2020 & 2033
- Table 55: Global Cannabis Market Revenue Million Forecast, by Export Market Analysis (Value & Volume) 2020 & 2033
- Table 56: Global Cannabis Market Volume Kiloton Forecast, by Export Market Analysis (Value & Volume) 2020 & 2033
- Table 57: Global Cannabis Market Revenue Million Forecast, by Price Trend Analysis 2020 & 2033
- Table 58: Global Cannabis Market Volume Kiloton Forecast, by Price Trend Analysis 2020 & 2033
- Table 59: Global Cannabis Market Revenue Million Forecast, by Country 2020 & 2033
- Table 60: Global Cannabis Market Volume Kiloton Forecast, by Country 2020 & 2033
- Table 61: United Kingdom Cannabis Market Revenue (Million) Forecast, by Application 2020 & 2033
- Table 62: United Kingdom Cannabis Market Volume (Kiloton) Forecast, by Application 2020 & 2033
- Table 63: Germany Cannabis Market Revenue (Million) Forecast, by Application 2020 & 2033
- Table 64: Germany Cannabis Market Volume (Kiloton) Forecast, by Application 2020 & 2033
- Table 65: France Cannabis Market Revenue (Million) Forecast, by Application 2020 & 2033
- Table 66: France Cannabis Market Volume (Kiloton) Forecast, by Application 2020 & 2033
- Table 67: Italy Cannabis Market Revenue (Million) Forecast, by Application 2020 & 2033
- Table 68: Italy Cannabis Market Volume (Kiloton) Forecast, by Application 2020 & 2033
- Table 69: Spain Cannabis Market Revenue (Million) Forecast, by Application 2020 & 2033
- Table 70: Spain Cannabis Market Volume (Kiloton) Forecast, by Application 2020 & 2033
- Table 71: Russia Cannabis Market Revenue (Million) Forecast, by Application 2020 & 2033
- Table 72: Russia Cannabis Market Volume (Kiloton) Forecast, by Application 2020 & 2033
- Table 73: Benelux Cannabis Market Revenue (Million) Forecast, by Application 2020 & 2033
- Table 74: Benelux Cannabis Market Volume (Kiloton) Forecast, by Application 2020 & 2033
- Table 75: Nordics Cannabis Market Revenue (Million) Forecast, by Application 2020 & 2033
- Table 76: Nordics Cannabis Market Volume (Kiloton) Forecast, by Application 2020 & 2033
- Table 77: Rest of Europe Cannabis Market Revenue (Million) Forecast, by Application 2020 & 2033
- Table 78: Rest of Europe Cannabis Market Volume (Kiloton) Forecast, by Application 2020 & 2033
- Table 79: Global Cannabis Market Revenue Million Forecast, by Production Analysis 2020 & 2033
- Table 80: Global Cannabis Market Volume Kiloton Forecast, by Production Analysis 2020 & 2033
- Table 81: Global Cannabis Market Revenue Million Forecast, by Consumption Analysis 2020 & 2033
- Table 82: Global Cannabis Market Volume Kiloton Forecast, by Consumption Analysis 2020 & 2033
- Table 83: Global Cannabis Market Revenue Million Forecast, by Import Market Analysis (Value & Volume) 2020 & 2033
- Table 84: Global Cannabis Market Volume Kiloton Forecast, by Import Market Analysis (Value & Volume) 2020 & 2033
- Table 85: Global Cannabis Market Revenue Million Forecast, by Export Market Analysis (Value & Volume) 2020 & 2033
- Table 86: Global Cannabis Market Volume Kiloton Forecast, by Export Market Analysis (Value & Volume) 2020 & 2033
- Table 87: Global Cannabis Market Revenue Million Forecast, by Price Trend Analysis 2020 & 2033
- Table 88: Global Cannabis Market Volume Kiloton Forecast, by Price Trend Analysis 2020 & 2033
- Table 89: Global Cannabis Market Revenue Million Forecast, by Country 2020 & 2033
- Table 90: Global Cannabis Market Volume Kiloton Forecast, by Country 2020 & 2033
- Table 91: Turkey Cannabis Market Revenue (Million) Forecast, by Application 2020 & 2033
- Table 92: Turkey Cannabis Market Volume (Kiloton) Forecast, by Application 2020 & 2033
- Table 93: Israel Cannabis Market Revenue (Million) Forecast, by Application 2020 & 2033
- Table 94: Israel Cannabis Market Volume (Kiloton) Forecast, by Application 2020 & 2033
- Table 95: GCC Cannabis Market Revenue (Million) Forecast, by Application 2020 & 2033
- Table 96: GCC Cannabis Market Volume (Kiloton) Forecast, by Application 2020 & 2033
- Table 97: North Africa Cannabis Market Revenue (Million) Forecast, by Application 2020 & 2033
- Table 98: North Africa Cannabis Market Volume (Kiloton) Forecast, by Application 2020 & 2033
- Table 99: South Africa Cannabis Market Revenue (Million) Forecast, by Application 2020 & 2033
- Table 100: South Africa Cannabis Market Volume (Kiloton) Forecast, by Application 2020 & 2033
- Table 101: Rest of Middle East & Africa Cannabis Market Revenue (Million) Forecast, by Application 2020 & 2033
- Table 102: Rest of Middle East & Africa Cannabis Market Volume (Kiloton) Forecast, by Application 2020 & 2033
- Table 103: Global Cannabis Market Revenue Million Forecast, by Production Analysis 2020 & 2033
- Table 104: Global Cannabis Market Volume Kiloton Forecast, by Production Analysis 2020 & 2033
- Table 105: Global Cannabis Market Revenue Million Forecast, by Consumption Analysis 2020 & 2033
- Table 106: Global Cannabis Market Volume Kiloton Forecast, by Consumption Analysis 2020 & 2033
- Table 107: Global Cannabis Market Revenue Million Forecast, by Import Market Analysis (Value & Volume) 2020 & 2033
- Table 108: Global Cannabis Market Volume Kiloton Forecast, by Import Market Analysis (Value & Volume) 2020 & 2033
- Table 109: Global Cannabis Market Revenue Million Forecast, by Export Market Analysis (Value & Volume) 2020 & 2033
- Table 110: Global Cannabis Market Volume Kiloton Forecast, by Export Market Analysis (Value & Volume) 2020 & 2033
- Table 111: Global Cannabis Market Revenue Million Forecast, by Price Trend Analysis 2020 & 2033
- Table 112: Global Cannabis Market Volume Kiloton Forecast, by Price Trend Analysis 2020 & 2033
- Table 113: Global Cannabis Market Revenue Million Forecast, by Country 2020 & 2033
- Table 114: Global Cannabis Market Volume Kiloton Forecast, by Country 2020 & 2033
- Table 115: China Cannabis Market Revenue (Million) Forecast, by Application 2020 & 2033
- Table 116: China Cannabis Market Volume (Kiloton) Forecast, by Application 2020 & 2033
- Table 117: India Cannabis Market Revenue (Million) Forecast, by Application 2020 & 2033
- Table 118: India Cannabis Market Volume (Kiloton) Forecast, by Application 2020 & 2033
- Table 119: Japan Cannabis Market Revenue (Million) Forecast, by Application 2020 & 2033
- Table 120: Japan Cannabis Market Volume (Kiloton) Forecast, by Application 2020 & 2033
- Table 121: South Korea Cannabis Market Revenue (Million) Forecast, by Application 2020 & 2033
- Table 122: South Korea Cannabis Market Volume (Kiloton) Forecast, by Application 2020 & 2033
- Table 123: ASEAN Cannabis Market Revenue (Million) Forecast, by Application 2020 & 2033
- Table 124: ASEAN Cannabis Market Volume (Kiloton) Forecast, by Application 2020 & 2033
- Table 125: Oceania Cannabis Market Revenue (Million) Forecast, by Application 2020 & 2033
- Table 126: Oceania Cannabis Market Volume (Kiloton) Forecast, by Application 2020 & 2033
- Table 127: Rest of Asia Pacific Cannabis Market Revenue (Million) Forecast, by Application 2020 & 2033
- Table 128: Rest of Asia Pacific Cannabis Market Volume (Kiloton) Forecast, by Application 2020 & 2033
Frequently Asked Questions
1. What is the projected Compound Annual Growth Rate (CAGR) of the Cannabis Market?
The projected CAGR is approximately 15.40%.
2. Which companies are prominent players in the Cannabis Market?
Key companies in the market include Delta 9 Cannabis, Canopy Growth Corp, Vivo Cannabis*List Not Exhaustive, Cannimed Therapeutics Inc, GW Pharmaceuticals PLC, Aphria Inc, Tilray, CV Sciences Inc, MedReLeaf Corp, Aurora Cannabis Inc.
3. What are the main segments of the Cannabis Market?
The market segments include Production Analysis, Consumption Analysis, Import Market Analysis (Value & Volume), Export Market Analysis (Value & Volume), Price Trend Analysis.
4. Can you provide details about the market size?
The market size is estimated to be USD 33.84 Million as of 2022.
5. What are some drivers contributing to market growth?
Increasing Legalization of Cannabis; Growing Focus on Health Benefits of Cannabis.
6. What are the notable trends driving market growth?
Legalization of Cannabis.
7. Are there any restraints impacting market growth?
Lack of Data on Dosages and Results; Lack of Access to Financial Assistance.
8. Can you provide examples of recent developments in the market?
May 2023: Toast and Nirvana Group formed a partnership to introduce innovative products for patients and consumers in Oklahoma and New Mexico.
9. What pricing options are available for accessing the report?
Pricing options include single-user, multi-user, and enterprise licenses priced at USD 4750, USD 5250, and USD 8750 respectively.
10. Is the market size provided in terms of value or volume?
The market size is provided in terms of value, measured in Million and volume, measured in Kiloton.
11. Are there any specific market keywords associated with the report?
Yes, the market keyword associated with the report is "Cannabis Market," which aids in identifying and referencing the specific market segment covered.
12. How do I determine which pricing option suits my needs best?
The pricing options vary based on user requirements and access needs. Individual users may opt for single-user licenses, while businesses requiring broader access may choose multi-user or enterprise licenses for cost-effective access to the report.
13. Are there any additional resources or data provided in the Cannabis Market report?
While the report offers comprehensive insights, it's advisable to review the specific contents or supplementary materials provided to ascertain if additional resources or data are available.
14. How can I stay updated on further developments or reports in the Cannabis Market?
To stay informed about further developments, trends, and reports in the Cannabis Market, consider subscribing to industry newsletters, following relevant companies and organizations, or regularly checking reputable industry news sources and publications.
Methodology
Step 1 - Identification of Relevant Samples Size from Population Database


Step 2 - Approaches for Defining Global Market Size (Value, Volume* & Price*)

Note*: In applicable scenarios
Step 3 - Data Sources
Primary Research
- Web Analytics
- Survey Reports
- Research Institute
- Latest Research Reports
- Opinion Leaders
Secondary Research
- Annual Reports
- White Paper
- Latest Press Release
- Industry Association
- Paid Database
- Investor Presentations

Step 4 - Data Triangulation
Involves using different sources of information in order to increase the validity of a study
These sources are likely to be stakeholders in a program - participants, other researchers, program staff, other community members, and so on.
Then we put all data in single framework & apply various statistical tools to find out the dynamic on the market.
During the analysis stage, feedback from the stakeholder groups would be compared to determine areas of agreement as well as areas of divergence