

Key Insights
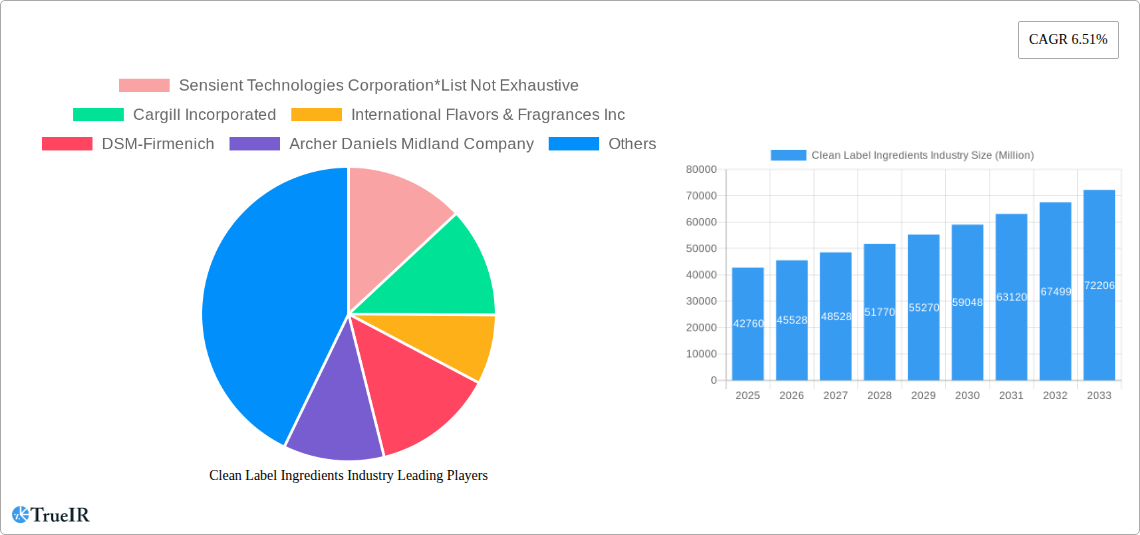
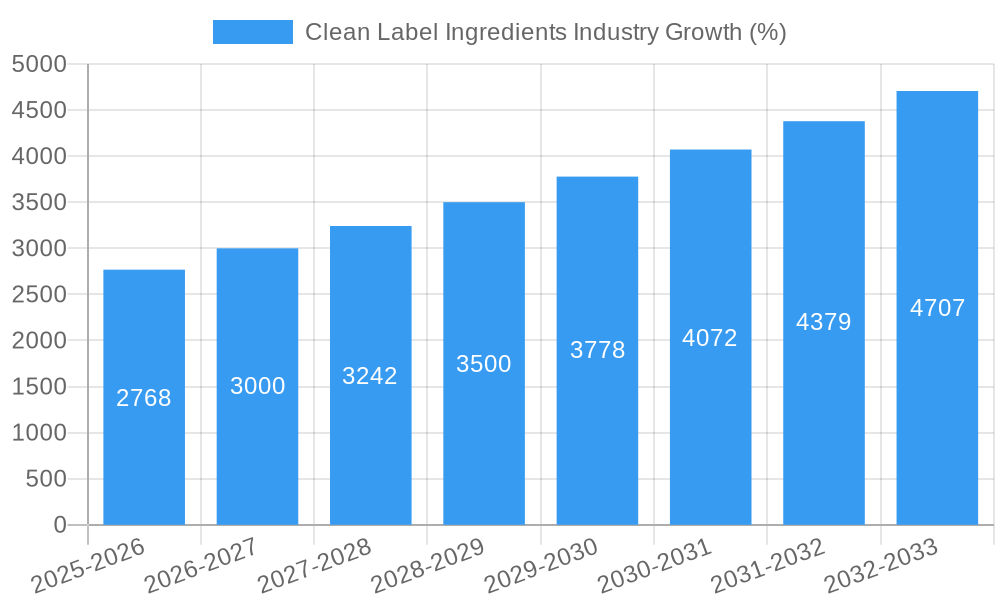
The Clean Label Ingredients market, valued at $42.76 billion in 2025, is projected to experience robust growth, driven by increasing consumer demand for natural, minimally processed foods. This preference for transparency and recognizable ingredients is fueling the market's expansion, with a Compound Annual Growth Rate (CAGR) of 6.51% anticipated from 2025 to 2033. Key drivers include the rising awareness of health and wellness, coupled with growing concerns about artificial additives and preservatives. The burgeoning popularity of plant-based diets and functional foods further strengthens market demand. Significant growth is expected across various segments, including food preservatives (driven by demand for natural alternatives to synthetic options), food sweeteners (with increased interest in stevia and other natural alternatives to sugar), and food colors (as consumers seek natural sources of vibrant hues). The bakery and confectionery, dairy and frozen desserts, and beverage sectors are major application areas, reflecting the widespread adoption of clean label ingredients across diverse food and beverage categories. While regulatory changes and the higher cost of clean label ingredients compared to conventional alternatives could present some restraints, the overall market outlook remains positive, supported by ongoing innovation and the increasing availability of clean label options.
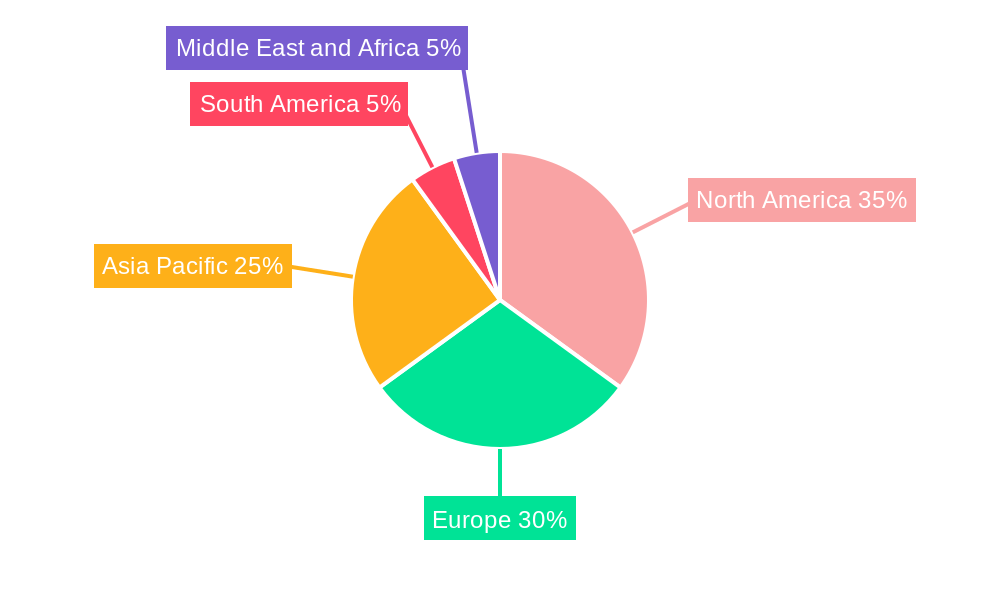
The geographical distribution of the market reveals strong performance across North America and Europe, reflecting established consumer preferences for clean label products in these regions. However, rapid growth is anticipated in the Asia-Pacific region, driven by rising disposable incomes and changing dietary habits. Companies such as Sensient Technologies Corporation, Cargill Incorporated, and International Flavors & Fragrances Inc. are leading players, actively investing in research and development to expand their product portfolios and cater to the evolving demands of the clean label market. Competition is expected to intensify as more companies enter this rapidly expanding sector, focusing on innovation and sustainable sourcing to capture market share. The long-term outlook for the clean label ingredients market remains exceptionally promising, predicated on sustained consumer preference for transparency, health, and natural ingredients in food and beverage products.
Clean Label Ingredients Industry Market Report: 2019-2033
This comprehensive report provides a detailed analysis of the Clean Label Ingredients industry, projecting a market value exceeding $XX Million by 2033. It covers market structure, competitive dynamics, key trends, and future growth potential, offering invaluable insights for industry stakeholders. The study period spans 2019-2033, with 2025 serving as the base and estimated year. This report is essential for businesses seeking to navigate the evolving landscape of clean label ingredients.
Clean Label Ingredients Industry Market Structure & Competitive Landscape
The Clean Label Ingredients market is characterized by a moderately concentrated structure, with key players like Sensient Technologies Corporation, Cargill Incorporated, International Flavors & Fragrances Inc, DSM-Firmenich, Archer Daniels Midland Company, Ajinomoto Co Inc, Tate & Lyle PLC, Kerry Group PLC, Ingredion Incorporated, and Corbion NV holding significant market share. However, the market also features numerous smaller players, fostering intense competition.
Market Concentration: The Herfindahl-Hirschman Index (HHI) is estimated at xx, suggesting a moderately concentrated market. This is driven by economies of scale enjoyed by large multinational corporations.
Innovation Drivers: Consumer demand for natural and ethically sourced ingredients is a major driver of innovation, pushing companies to develop novel clean label alternatives to traditional additives.
Regulatory Impacts: Stringent regulations surrounding food labeling and ingredient safety significantly impact market dynamics, influencing product development and market access.
Product Substitutes: The availability of alternative ingredients and formulations creates competitive pressure, forcing companies to continuously innovate and improve their product offerings.
End-User Segmentation: The market is segmented by application, including bakery and confectionery, dairy and frozen desserts, beverages, meat and meat products, and sauces and condiments. Each segment exhibits unique growth dynamics driven by specific consumer preferences and technological advancements.
M&A Trends: The Clean Label Ingredients sector has witnessed a moderate level of mergers and acquisitions in recent years, with xx deals recorded between 2019 and 2024, primarily focused on expanding product portfolios and geographical reach.
Clean Label Ingredients Industry Market Trends & Opportunities
The Clean Label Ingredients market is experiencing robust growth, fueled by increasing consumer demand for natural and minimally processed foods. The market is projected to expand at a CAGR of xx% during the forecast period (2025-2033), reaching a value exceeding $XX Million by 2033. This growth is underpinned by several key trends:
Shifting Consumer Preferences: Consumers are increasingly aware of the ingredients in their food and are actively seeking products with clean labels, devoid of artificial colors, flavors, and preservatives. This heightened awareness is a major driving force behind the market's expansion.
Technological Advancements: Innovation in ingredient extraction, processing, and formulation techniques is crucial to meeting the growing demand for clean label alternatives. This includes the development of novel plant-based ingredients and sustainable sourcing practices.
Market Penetration: The penetration rate of clean label ingredients in various food and beverage categories is steadily increasing. Products marketed as "clean label" are gaining mainstream appeal, capturing significant market share.
Competitive Dynamics: Intense competition among existing players and the emergence of new entrants are driving innovation and creating opportunities for market diversification. The strategic partnerships, such as that between ADM and New Culture, are examples of this dynamic landscape.
Dominant Markets & Segments in Clean Label Ingredients Industry
The North American region currently dominates the Clean Label Ingredients market, driven by high consumer awareness and demand for clean label products. However, strong growth potential exists in Asia-Pacific and European markets, particularly in emerging economies.
Leading Segments:
Product Type: Food Flavors and Enhancers currently represent the largest segment, with a market value of $XX Million in 2025. Strong growth is expected in Food Preservatives and Food Sweeteners segments due to increased demand for natural alternatives.
Application: The Bakery and Confectionery sector currently exhibits the highest consumption of clean label ingredients, while the Beverages sector is anticipated to show significant growth due to the growing popularity of functional beverages.
Key Growth Drivers:
- Strong consumer demand for natural and healthy products
- Growing adoption of clean label standards
- Stringent food safety regulations
- Technological innovations in ingredient production
- Increased investment in R&D
The dominance of North America is attributed to factors such as strong consumer purchasing power, well-established food processing industries, and proactive regulations concerning food safety and labeling.
Clean Label Ingredients Industry Product Analysis
Clean label ingredient innovations predominantly focus on natural and plant-based alternatives to traditional additives. These include plant-based proteins, natural colors and flavors, and sustainable sweeteners. The success of these products is driven by their functional properties, compatibility with existing food processing technologies, and their ability to meet stringent regulatory requirements. Companies are also emphasizing traceability and sustainability in their sourcing and production practices to enhance their appeal to consumers.
Key Drivers, Barriers & Challenges in Clean Label Ingredients Industry
Key Drivers: The primary drivers of market growth include rising consumer awareness of food ingredients, stringent food safety regulations, and growing demand for healthier food options. Technological advancements in ingredient extraction and processing also fuel market expansion. For instance, the increasing availability of plant-based alternatives like Methanova, launched by IFF, demonstrates this trend.
Challenges and Restraints: Significant challenges include the higher cost of production for clean label ingredients compared to conventional alternatives, complexities in achieving consistent product quality, and maintaining a stable supply chain, particularly for certain niche or sustainably sourced ingredients. Regulatory hurdles and potential supply chain disruptions due to climate change could further impact market growth.
Growth Drivers in the Clean Label Ingredients Industry Market
The market is driven by the increasing demand for natural and organic foods, a growing consumer preference for transparency in food labeling, advancements in food technology resulting in better-tasting and healthier products, and a push for sustainable and ethical sourcing practices. Stringent government regulations promoting clean label products also contribute to the growth.
Challenges Impacting Clean Label Ingredients Industry Growth
Significant challenges impacting growth include the high cost of production for some clean label ingredients, difficulties in maintaining a consistent supply chain, and fluctuating raw material prices. Meeting strict regulatory requirements for labeling and product composition can also create hurdles for some companies. Competition from conventional ingredients and potentially inconsistent consumer understanding of “clean label” itself present further challenges.
Key Players Shaping the Clean Label Ingredients Industry Market
- Sensient Technologies Corporation
- Cargill Incorporated
- International Flavors & Fragrances Inc
- DSM-Firmenich
- Archer Daniels Midland Company
- Ajinomoto Co Inc
- Tate & Lyle PLC
- Kerry Group PLC
- Ingredion Incorporated
- Corbion NV
Significant Clean Label Ingredients Industry Milestones
- February 2024: Ajinomoto Co. opened a new office in Silicon Valley, expanding its reach in the US clean label ingredients market.
- October 2023: International Flavors & Fragrances Inc. launched Methanova, a novel methylcellulose for the biotechnology and food industries. This launch showcases the company's commitment to innovation in plant-based biopolymers.
- August 2022: Archer-Daniels-Midland Company partnered with New Culture, reinforcing the industry's move towards sustainable and animal-free food solutions.
Future Outlook for Clean Label Ingredients Industry Market
The Clean Label Ingredients market is poised for continued strong growth, driven by persistent consumer demand for transparency and health-conscious products. Opportunities abound for companies that can innovate and deliver sustainable, high-quality clean label solutions while navigating the challenges of cost optimization and supply chain management. The market’s expansion will be significantly influenced by technological breakthroughs, evolving consumer preferences, and the regulatory landscape.
Clean Label Ingredients Industry Segmentation
-
1. Product Type
- 1.1. Food Preservatives
- 1.2. Food Sweeteners
- 1.3. Food Colorants
- 1.4. Food Hydrocolloids
- 1.5. Food Flavors and Enhancers
- 1.6. Other Product Types
-
2. Application
- 2.1. Bakery and Confectionery
- 2.2. Dairy and Frozen Desserts
- 2.3. Beverages
- 2.4. Meat and Meat Products
- 2.5. Sauces and Condiments
- 2.6. Other Applications
Clean Label Ingredients Industry Segmentation By Geography
-
1. North America
- 1.1. United States
- 1.2. Canada
- 1.3. Mexico
- 1.4. Rest of North America
-
2. Europe
- 2.1. United Kingdom
- 2.2. Germany
- 2.3. Spain
- 2.4. France
- 2.5. Italy
- 2.6. Russia
- 2.7. Rest of Europe
-
3. Asia Pacific
- 3.1. China
- 3.2. Japan
- 3.3. India
- 3.4. Australia
- 3.5. Rest of Asia Pacific
-
4. South America
- 4.1. Brazil
- 4.2. Argentina
- 4.3. Rest of South America
-
5. Middle East and Africa
- 5.1. South Africa
- 5.2. Saudi Arabia
- 5.3. Rest of Middle East and Africa
Clean Label Ingredients Industry REPORT HIGHLIGHTS
| Aspects | Details |
|---|---|
| Study Period | 2019-2033 |
| Base Year | 2024 |
| Estimated Year | 2025 |
| Forecast Period | 2025-2033 |
| Historical Period | 2019-2024 |
| Growth Rate | CAGR of 6.51% from 2019-2033 |
| Segmentation |
|
Table of Contents
- 1. Introduction
- 1.1. Research Scope
- 1.2. Market Segmentation
- 1.3. Research Methodology
- 1.4. Definitions and Assumptions
- 2. Executive Summary
- 2.1. Introduction
- 3. Market Dynamics
- 3.1. Introduction
- 3.2. Market Drivers
- 3.2.1. Increasing Health and Wellness Trends Fueling Market Growth; Rising Demand for Natural Ingredients
- 3.3. Market Restrains
- 3.3.1. High Cost Hampering Market Growth
- 3.4. Market Trends
- 3.4.1. Increasing Health and Wellness Trends Fueling Market Growth
- 4. Market Factor Analysis
- 4.1. Porters Five Forces
- 4.2. Supply/Value Chain
- 4.3. PESTEL analysis
- 4.4. Market Entropy
- 4.5. Patent/Trademark Analysis
- 5. Global Clean Label Ingredients Industry Analysis, Insights and Forecast, 2019-2031
- 5.1. Market Analysis, Insights and Forecast - by Product Type
- 5.1.1. Food Preservatives
- 5.1.2. Food Sweeteners
- 5.1.3. Food Colorants
- 5.1.4. Food Hydrocolloids
- 5.1.5. Food Flavors and Enhancers
- 5.1.6. Other Product Types
- 5.2. Market Analysis, Insights and Forecast - by Application
- 5.2.1. Bakery and Confectionery
- 5.2.2. Dairy and Frozen Desserts
- 5.2.3. Beverages
- 5.2.4. Meat and Meat Products
- 5.2.5. Sauces and Condiments
- 5.2.6. Other Applications
- 5.3. Market Analysis, Insights and Forecast - by Region
- 5.3.1. North America
- 5.3.2. Europe
- 5.3.3. Asia Pacific
- 5.3.4. South America
- 5.3.5. Middle East and Africa
- 5.1. Market Analysis, Insights and Forecast - by Product Type
- 6. North America Clean Label Ingredients Industry Analysis, Insights and Forecast, 2019-2031
- 6.1. Market Analysis, Insights and Forecast - by Product Type
- 6.1.1. Food Preservatives
- 6.1.2. Food Sweeteners
- 6.1.3. Food Colorants
- 6.1.4. Food Hydrocolloids
- 6.1.5. Food Flavors and Enhancers
- 6.1.6. Other Product Types
- 6.2. Market Analysis, Insights and Forecast - by Application
- 6.2.1. Bakery and Confectionery
- 6.2.2. Dairy and Frozen Desserts
- 6.2.3. Beverages
- 6.2.4. Meat and Meat Products
- 6.2.5. Sauces and Condiments
- 6.2.6. Other Applications
- 6.1. Market Analysis, Insights and Forecast - by Product Type
- 7. Europe Clean Label Ingredients Industry Analysis, Insights and Forecast, 2019-2031
- 7.1. Market Analysis, Insights and Forecast - by Product Type
- 7.1.1. Food Preservatives
- 7.1.2. Food Sweeteners
- 7.1.3. Food Colorants
- 7.1.4. Food Hydrocolloids
- 7.1.5. Food Flavors and Enhancers
- 7.1.6. Other Product Types
- 7.2. Market Analysis, Insights and Forecast - by Application
- 7.2.1. Bakery and Confectionery
- 7.2.2. Dairy and Frozen Desserts
- 7.2.3. Beverages
- 7.2.4. Meat and Meat Products
- 7.2.5. Sauces and Condiments
- 7.2.6. Other Applications
- 7.1. Market Analysis, Insights and Forecast - by Product Type
- 8. Asia Pacific Clean Label Ingredients Industry Analysis, Insights and Forecast, 2019-2031
- 8.1. Market Analysis, Insights and Forecast - by Product Type
- 8.1.1. Food Preservatives
- 8.1.2. Food Sweeteners
- 8.1.3. Food Colorants
- 8.1.4. Food Hydrocolloids
- 8.1.5. Food Flavors and Enhancers
- 8.1.6. Other Product Types
- 8.2. Market Analysis, Insights and Forecast - by Application
- 8.2.1. Bakery and Confectionery
- 8.2.2. Dairy and Frozen Desserts
- 8.2.3. Beverages
- 8.2.4. Meat and Meat Products
- 8.2.5. Sauces and Condiments
- 8.2.6. Other Applications
- 8.1. Market Analysis, Insights and Forecast - by Product Type
- 9. South America Clean Label Ingredients Industry Analysis, Insights and Forecast, 2019-2031
- 9.1. Market Analysis, Insights and Forecast - by Product Type
- 9.1.1. Food Preservatives
- 9.1.2. Food Sweeteners
- 9.1.3. Food Colorants
- 9.1.4. Food Hydrocolloids
- 9.1.5. Food Flavors and Enhancers
- 9.1.6. Other Product Types
- 9.2. Market Analysis, Insights and Forecast - by Application
- 9.2.1. Bakery and Confectionery
- 9.2.2. Dairy and Frozen Desserts
- 9.2.3. Beverages
- 9.2.4. Meat and Meat Products
- 9.2.5. Sauces and Condiments
- 9.2.6. Other Applications
- 9.1. Market Analysis, Insights and Forecast - by Product Type
- 10. Middle East and Africa Clean Label Ingredients Industry Analysis, Insights and Forecast, 2019-2031
- 10.1. Market Analysis, Insights and Forecast - by Product Type
- 10.1.1. Food Preservatives
- 10.1.2. Food Sweeteners
- 10.1.3. Food Colorants
- 10.1.4. Food Hydrocolloids
- 10.1.5. Food Flavors and Enhancers
- 10.1.6. Other Product Types
- 10.2. Market Analysis, Insights and Forecast - by Application
- 10.2.1. Bakery and Confectionery
- 10.2.2. Dairy and Frozen Desserts
- 10.2.3. Beverages
- 10.2.4. Meat and Meat Products
- 10.2.5. Sauces and Condiments
- 10.2.6. Other Applications
- 10.1. Market Analysis, Insights and Forecast - by Product Type
- 11. North America Clean Label Ingredients Industry Analysis, Insights and Forecast, 2019-2031
- 11.1. Market Analysis, Insights and Forecast - By Country/Sub-region
- 11.1.1 United States
- 11.1.2 Canada
- 11.1.3 Mexico
- 11.1.4 Rest of North America
- 12. Europe Clean Label Ingredients Industry Analysis, Insights and Forecast, 2019-2031
- 12.1. Market Analysis, Insights and Forecast - By Country/Sub-region
- 12.1.1 United Kingdom
- 12.1.2 Germany
- 12.1.3 Spain
- 12.1.4 France
- 12.1.5 Italy
- 12.1.6 Russia
- 12.1.7 Rest of Europe
- 13. Asia Pacific Clean Label Ingredients Industry Analysis, Insights and Forecast, 2019-2031
- 13.1. Market Analysis, Insights and Forecast - By Country/Sub-region
- 13.1.1 China
- 13.1.2 Japan
- 13.1.3 India
- 13.1.4 Australia
- 13.1.5 Rest of Asia Pacific
- 14. South America Clean Label Ingredients Industry Analysis, Insights and Forecast, 2019-2031
- 14.1. Market Analysis, Insights and Forecast - By Country/Sub-region
- 14.1.1 Brazil
- 14.1.2 Argentina
- 14.1.3 Rest of South America
- 15. Middle East and Africa Clean Label Ingredients Industry Analysis, Insights and Forecast, 2019-2031
- 15.1. Market Analysis, Insights and Forecast - By Country/Sub-region
- 15.1.1 South Africa
- 15.1.2 Saudi Arabia
- 15.1.3 Rest of Middle East and Africa
- 16. Competitive Analysis
- 16.1. Global Market Share Analysis 2024
- 16.2. Company Profiles
- 16.2.1 Sensient Technologies Corporation*List Not Exhaustive
- 16.2.1.1. Overview
- 16.2.1.2. Products
- 16.2.1.3. SWOT Analysis
- 16.2.1.4. Recent Developments
- 16.2.1.5. Financials (Based on Availability)
- 16.2.2 Cargill Incorporated
- 16.2.2.1. Overview
- 16.2.2.2. Products
- 16.2.2.3. SWOT Analysis
- 16.2.2.4. Recent Developments
- 16.2.2.5. Financials (Based on Availability)
- 16.2.3 International Flavors & Fragrances Inc
- 16.2.3.1. Overview
- 16.2.3.2. Products
- 16.2.3.3. SWOT Analysis
- 16.2.3.4. Recent Developments
- 16.2.3.5. Financials (Based on Availability)
- 16.2.4 DSM-Firmenich
- 16.2.4.1. Overview
- 16.2.4.2. Products
- 16.2.4.3. SWOT Analysis
- 16.2.4.4. Recent Developments
- 16.2.4.5. Financials (Based on Availability)
- 16.2.5 Archer Daniels Midland Company
- 16.2.5.1. Overview
- 16.2.5.2. Products
- 16.2.5.3. SWOT Analysis
- 16.2.5.4. Recent Developments
- 16.2.5.5. Financials (Based on Availability)
- 16.2.6 Ajinomoto Co Inc
- 16.2.6.1. Overview
- 16.2.6.2. Products
- 16.2.6.3. SWOT Analysis
- 16.2.6.4. Recent Developments
- 16.2.6.5. Financials (Based on Availability)
- 16.2.7 Tate & Lyle PLC
- 16.2.7.1. Overview
- 16.2.7.2. Products
- 16.2.7.3. SWOT Analysis
- 16.2.7.4. Recent Developments
- 16.2.7.5. Financials (Based on Availability)
- 16.2.8 Kerry Group PLC
- 16.2.8.1. Overview
- 16.2.8.2. Products
- 16.2.8.3. SWOT Analysis
- 16.2.8.4. Recent Developments
- 16.2.8.5. Financials (Based on Availability)
- 16.2.9 Ingredion Incorporated
- 16.2.9.1. Overview
- 16.2.9.2. Products
- 16.2.9.3. SWOT Analysis
- 16.2.9.4. Recent Developments
- 16.2.9.5. Financials (Based on Availability)
- 16.2.10 Corbion NV
- 16.2.10.1. Overview
- 16.2.10.2. Products
- 16.2.10.3. SWOT Analysis
- 16.2.10.4. Recent Developments
- 16.2.10.5. Financials (Based on Availability)
- 16.2.1 Sensient Technologies Corporation*List Not Exhaustive
List of Figures
- Figure 1: Global Clean Label Ingredients Industry Revenue Breakdown (Million, %) by Region 2024 & 2032
- Figure 2: North America Clean Label Ingredients Industry Revenue (Million), by Country 2024 & 2032
- Figure 3: North America Clean Label Ingredients Industry Revenue Share (%), by Country 2024 & 2032
- Figure 4: Europe Clean Label Ingredients Industry Revenue (Million), by Country 2024 & 2032
- Figure 5: Europe Clean Label Ingredients Industry Revenue Share (%), by Country 2024 & 2032
- Figure 6: Asia Pacific Clean Label Ingredients Industry Revenue (Million), by Country 2024 & 2032
- Figure 7: Asia Pacific Clean Label Ingredients Industry Revenue Share (%), by Country 2024 & 2032
- Figure 8: South America Clean Label Ingredients Industry Revenue (Million), by Country 2024 & 2032
- Figure 9: South America Clean Label Ingredients Industry Revenue Share (%), by Country 2024 & 2032
- Figure 10: Middle East and Africa Clean Label Ingredients Industry Revenue (Million), by Country 2024 & 2032
- Figure 11: Middle East and Africa Clean Label Ingredients Industry Revenue Share (%), by Country 2024 & 2032
- Figure 12: North America Clean Label Ingredients Industry Revenue (Million), by Product Type 2024 & 2032
- Figure 13: North America Clean Label Ingredients Industry Revenue Share (%), by Product Type 2024 & 2032
- Figure 14: North America Clean Label Ingredients Industry Revenue (Million), by Application 2024 & 2032
- Figure 15: North America Clean Label Ingredients Industry Revenue Share (%), by Application 2024 & 2032
- Figure 16: North America Clean Label Ingredients Industry Revenue (Million), by Country 2024 & 2032
- Figure 17: North America Clean Label Ingredients Industry Revenue Share (%), by Country 2024 & 2032
- Figure 18: Europe Clean Label Ingredients Industry Revenue (Million), by Product Type 2024 & 2032
- Figure 19: Europe Clean Label Ingredients Industry Revenue Share (%), by Product Type 2024 & 2032
- Figure 20: Europe Clean Label Ingredients Industry Revenue (Million), by Application 2024 & 2032
- Figure 21: Europe Clean Label Ingredients Industry Revenue Share (%), by Application 2024 & 2032
- Figure 22: Europe Clean Label Ingredients Industry Revenue (Million), by Country 2024 & 2032
- Figure 23: Europe Clean Label Ingredients Industry Revenue Share (%), by Country 2024 & 2032
- Figure 24: Asia Pacific Clean Label Ingredients Industry Revenue (Million), by Product Type 2024 & 2032
- Figure 25: Asia Pacific Clean Label Ingredients Industry Revenue Share (%), by Product Type 2024 & 2032
- Figure 26: Asia Pacific Clean Label Ingredients Industry Revenue (Million), by Application 2024 & 2032
- Figure 27: Asia Pacific Clean Label Ingredients Industry Revenue Share (%), by Application 2024 & 2032
- Figure 28: Asia Pacific Clean Label Ingredients Industry Revenue (Million), by Country 2024 & 2032
- Figure 29: Asia Pacific Clean Label Ingredients Industry Revenue Share (%), by Country 2024 & 2032
- Figure 30: South America Clean Label Ingredients Industry Revenue (Million), by Product Type 2024 & 2032
- Figure 31: South America Clean Label Ingredients Industry Revenue Share (%), by Product Type 2024 & 2032
- Figure 32: South America Clean Label Ingredients Industry Revenue (Million), by Application 2024 & 2032
- Figure 33: South America Clean Label Ingredients Industry Revenue Share (%), by Application 2024 & 2032
- Figure 34: South America Clean Label Ingredients Industry Revenue (Million), by Country 2024 & 2032
- Figure 35: South America Clean Label Ingredients Industry Revenue Share (%), by Country 2024 & 2032
- Figure 36: Middle East and Africa Clean Label Ingredients Industry Revenue (Million), by Product Type 2024 & 2032
- Figure 37: Middle East and Africa Clean Label Ingredients Industry Revenue Share (%), by Product Type 2024 & 2032
- Figure 38: Middle East and Africa Clean Label Ingredients Industry Revenue (Million), by Application 2024 & 2032
- Figure 39: Middle East and Africa Clean Label Ingredients Industry Revenue Share (%), by Application 2024 & 2032
- Figure 40: Middle East and Africa Clean Label Ingredients Industry Revenue (Million), by Country 2024 & 2032
- Figure 41: Middle East and Africa Clean Label Ingredients Industry Revenue Share (%), by Country 2024 & 2032
List of Tables
- Table 1: Global Clean Label Ingredients Industry Revenue Million Forecast, by Region 2019 & 2032
- Table 2: Global Clean Label Ingredients Industry Revenue Million Forecast, by Product Type 2019 & 2032
- Table 3: Global Clean Label Ingredients Industry Revenue Million Forecast, by Application 2019 & 2032
- Table 4: Global Clean Label Ingredients Industry Revenue Million Forecast, by Region 2019 & 2032
- Table 5: Global Clean Label Ingredients Industry Revenue Million Forecast, by Country 2019 & 2032
- Table 6: United States Clean Label Ingredients Industry Revenue (Million) Forecast, by Application 2019 & 2032
- Table 7: Canada Clean Label Ingredients Industry Revenue (Million) Forecast, by Application 2019 & 2032
- Table 8: Mexico Clean Label Ingredients Industry Revenue (Million) Forecast, by Application 2019 & 2032
- Table 9: Rest of North America Clean Label Ingredients Industry Revenue (Million) Forecast, by Application 2019 & 2032
- Table 10: Global Clean Label Ingredients Industry Revenue Million Forecast, by Country 2019 & 2032
- Table 11: United Kingdom Clean Label Ingredients Industry Revenue (Million) Forecast, by Application 2019 & 2032
- Table 12: Germany Clean Label Ingredients Industry Revenue (Million) Forecast, by Application 2019 & 2032
- Table 13: Spain Clean Label Ingredients Industry Revenue (Million) Forecast, by Application 2019 & 2032
- Table 14: France Clean Label Ingredients Industry Revenue (Million) Forecast, by Application 2019 & 2032
- Table 15: Italy Clean Label Ingredients Industry Revenue (Million) Forecast, by Application 2019 & 2032
- Table 16: Russia Clean Label Ingredients Industry Revenue (Million) Forecast, by Application 2019 & 2032
- Table 17: Rest of Europe Clean Label Ingredients Industry Revenue (Million) Forecast, by Application 2019 & 2032
- Table 18: Global Clean Label Ingredients Industry Revenue Million Forecast, by Country 2019 & 2032
- Table 19: China Clean Label Ingredients Industry Revenue (Million) Forecast, by Application 2019 & 2032
- Table 20: Japan Clean Label Ingredients Industry Revenue (Million) Forecast, by Application 2019 & 2032
- Table 21: India Clean Label Ingredients Industry Revenue (Million) Forecast, by Application 2019 & 2032
- Table 22: Australia Clean Label Ingredients Industry Revenue (Million) Forecast, by Application 2019 & 2032
- Table 23: Rest of Asia Pacific Clean Label Ingredients Industry Revenue (Million) Forecast, by Application 2019 & 2032
- Table 24: Global Clean Label Ingredients Industry Revenue Million Forecast, by Country 2019 & 2032
- Table 25: Brazil Clean Label Ingredients Industry Revenue (Million) Forecast, by Application 2019 & 2032
- Table 26: Argentina Clean Label Ingredients Industry Revenue (Million) Forecast, by Application 2019 & 2032
- Table 27: Rest of South America Clean Label Ingredients Industry Revenue (Million) Forecast, by Application 2019 & 2032
- Table 28: Global Clean Label Ingredients Industry Revenue Million Forecast, by Country 2019 & 2032
- Table 29: South Africa Clean Label Ingredients Industry Revenue (Million) Forecast, by Application 2019 & 2032
- Table 30: Saudi Arabia Clean Label Ingredients Industry Revenue (Million) Forecast, by Application 2019 & 2032
- Table 31: Rest of Middle East and Africa Clean Label Ingredients Industry Revenue (Million) Forecast, by Application 2019 & 2032
- Table 32: Global Clean Label Ingredients Industry Revenue Million Forecast, by Product Type 2019 & 2032
- Table 33: Global Clean Label Ingredients Industry Revenue Million Forecast, by Application 2019 & 2032
- Table 34: Global Clean Label Ingredients Industry Revenue Million Forecast, by Country 2019 & 2032
- Table 35: United States Clean Label Ingredients Industry Revenue (Million) Forecast, by Application 2019 & 2032
- Table 36: Canada Clean Label Ingredients Industry Revenue (Million) Forecast, by Application 2019 & 2032
- Table 37: Mexico Clean Label Ingredients Industry Revenue (Million) Forecast, by Application 2019 & 2032
- Table 38: Rest of North America Clean Label Ingredients Industry Revenue (Million) Forecast, by Application 2019 & 2032
- Table 39: Global Clean Label Ingredients Industry Revenue Million Forecast, by Product Type 2019 & 2032
- Table 40: Global Clean Label Ingredients Industry Revenue Million Forecast, by Application 2019 & 2032
- Table 41: Global Clean Label Ingredients Industry Revenue Million Forecast, by Country 2019 & 2032
- Table 42: United Kingdom Clean Label Ingredients Industry Revenue (Million) Forecast, by Application 2019 & 2032
- Table 43: Germany Clean Label Ingredients Industry Revenue (Million) Forecast, by Application 2019 & 2032
- Table 44: Spain Clean Label Ingredients Industry Revenue (Million) Forecast, by Application 2019 & 2032
- Table 45: France Clean Label Ingredients Industry Revenue (Million) Forecast, by Application 2019 & 2032
- Table 46: Italy Clean Label Ingredients Industry Revenue (Million) Forecast, by Application 2019 & 2032
- Table 47: Russia Clean Label Ingredients Industry Revenue (Million) Forecast, by Application 2019 & 2032
- Table 48: Rest of Europe Clean Label Ingredients Industry Revenue (Million) Forecast, by Application 2019 & 2032
- Table 49: Global Clean Label Ingredients Industry Revenue Million Forecast, by Product Type 2019 & 2032
- Table 50: Global Clean Label Ingredients Industry Revenue Million Forecast, by Application 2019 & 2032
- Table 51: Global Clean Label Ingredients Industry Revenue Million Forecast, by Country 2019 & 2032
- Table 52: China Clean Label Ingredients Industry Revenue (Million) Forecast, by Application 2019 & 2032
- Table 53: Japan Clean Label Ingredients Industry Revenue (Million) Forecast, by Application 2019 & 2032
- Table 54: India Clean Label Ingredients Industry Revenue (Million) Forecast, by Application 2019 & 2032
- Table 55: Australia Clean Label Ingredients Industry Revenue (Million) Forecast, by Application 2019 & 2032
- Table 56: Rest of Asia Pacific Clean Label Ingredients Industry Revenue (Million) Forecast, by Application 2019 & 2032
- Table 57: Global Clean Label Ingredients Industry Revenue Million Forecast, by Product Type 2019 & 2032
- Table 58: Global Clean Label Ingredients Industry Revenue Million Forecast, by Application 2019 & 2032
- Table 59: Global Clean Label Ingredients Industry Revenue Million Forecast, by Country 2019 & 2032
- Table 60: Brazil Clean Label Ingredients Industry Revenue (Million) Forecast, by Application 2019 & 2032
- Table 61: Argentina Clean Label Ingredients Industry Revenue (Million) Forecast, by Application 2019 & 2032
- Table 62: Rest of South America Clean Label Ingredients Industry Revenue (Million) Forecast, by Application 2019 & 2032
- Table 63: Global Clean Label Ingredients Industry Revenue Million Forecast, by Product Type 2019 & 2032
- Table 64: Global Clean Label Ingredients Industry Revenue Million Forecast, by Application 2019 & 2032
- Table 65: Global Clean Label Ingredients Industry Revenue Million Forecast, by Country 2019 & 2032
- Table 66: South Africa Clean Label Ingredients Industry Revenue (Million) Forecast, by Application 2019 & 2032
- Table 67: Saudi Arabia Clean Label Ingredients Industry Revenue (Million) Forecast, by Application 2019 & 2032
- Table 68: Rest of Middle East and Africa Clean Label Ingredients Industry Revenue (Million) Forecast, by Application 2019 & 2032
Frequently Asked Questions
1. What is the projected Compound Annual Growth Rate (CAGR) of the Clean Label Ingredients Industry?
The projected CAGR is approximately 6.51%.
2. Which companies are prominent players in the Clean Label Ingredients Industry?
Key companies in the market include Sensient Technologies Corporation*List Not Exhaustive, Cargill Incorporated, International Flavors & Fragrances Inc, DSM-Firmenich, Archer Daniels Midland Company, Ajinomoto Co Inc, Tate & Lyle PLC, Kerry Group PLC, Ingredion Incorporated, Corbion NV.
3. What are the main segments of the Clean Label Ingredients Industry?
The market segments include Product Type, Application.
4. Can you provide details about the market size?
The market size is estimated to be USD 42.76 Million as of 2022.
5. What are some drivers contributing to market growth?
Increasing Health and Wellness Trends Fueling Market Growth; Rising Demand for Natural Ingredients.
6. What are the notable trends driving market growth?
Increasing Health and Wellness Trends Fueling Market Growth.
7. Are there any restraints impacting market growth?
High Cost Hampering Market Growth.
8. Can you provide examples of recent developments in the market?
February 2024: Ajinomoto Co. opened a new office in Silicon Valley, United States. The office provides different types of food solutions, including clean label ingredients in the US market. The purpose of this expansion was to expand the company’s business.
9. What pricing options are available for accessing the report?
Pricing options include single-user, multi-user, and enterprise licenses priced at USD 4750, USD 5250, and USD 8750 respectively.
10. Is the market size provided in terms of value or volume?
The market size is provided in terms of value, measured in Million.
11. Are there any specific market keywords associated with the report?
Yes, the market keyword associated with the report is "Clean Label Ingredients Industry," which aids in identifying and referencing the specific market segment covered.
12. How do I determine which pricing option suits my needs best?
The pricing options vary based on user requirements and access needs. Individual users may opt for single-user licenses, while businesses requiring broader access may choose multi-user or enterprise licenses for cost-effective access to the report.
13. Are there any additional resources or data provided in the Clean Label Ingredients Industry report?
While the report offers comprehensive insights, it's advisable to review the specific contents or supplementary materials provided to ascertain if additional resources or data are available.
14. How can I stay updated on further developments or reports in the Clean Label Ingredients Industry?
To stay informed about further developments, trends, and reports in the Clean Label Ingredients Industry, consider subscribing to industry newsletters, following relevant companies and organizations, or regularly checking reputable industry news sources and publications.
Methodology
Step 1 - Identification of Relevant Samples Size from Population Database


Step 2 - Approaches for Defining Global Market Size (Value, Volume* & Price*)

Note*: In applicable scenarios
Step 3 - Data Sources
Primary Research
- Web Analytics
- Survey Reports
- Research Institute
- Latest Research Reports
- Opinion Leaders
Secondary Research
- Annual Reports
- White Paper
- Latest Press Release
- Industry Association
- Paid Database
- Investor Presentations

Step 4 - Data Triangulation
Involves using different sources of information in order to increase the validity of a study
These sources are likely to be stakeholders in a program - participants, other researchers, program staff, other community members, and so on.
Then we put all data in single framework & apply various statistical tools to find out the dynamic on the market.
During the analysis stage, feedback from the stakeholder groups would be compared to determine areas of agreement as well as areas of divergence
