

Key Insights
The global cocoa value chain industry, valued at $14.70 billion in 2025, is projected to experience steady growth, driven by increasing consumer demand for chocolate and cocoa-based products. A compound annual growth rate (CAGR) of 2.30% from 2025 to 2033 indicates a sustained, albeit moderate, expansion. This growth is fueled by several factors: rising disposable incomes in developing economies leading to increased chocolate consumption, the growing popularity of premium and specialized chocolate products, and ongoing innovation in cocoa processing and product development. However, challenges remain, including fluctuating cocoa bean prices due to climate change impacts on harvests and concerns regarding sustainable sourcing and ethical labor practices within the cocoa supply chain. These factors necessitate strategic investments in sustainable farming practices, improved supply chain transparency, and the development of innovative products to cater to evolving consumer preferences. The market is segmented by various cocoa product types, including chocolate, cocoa powder, and cocoa butter, further diversifying the market landscape. Geographical distribution shows significant variations, with North America and Europe maintaining substantial market shares, while Asia-Pacific is expected to exhibit promising growth potential due to rising consumption in countries like China and India. The competitive landscape is dominated by major players such as Nestlé, Mars, and Barry Callebaut, who are focusing on expanding their product portfolios and strengthening their distribution networks globally.
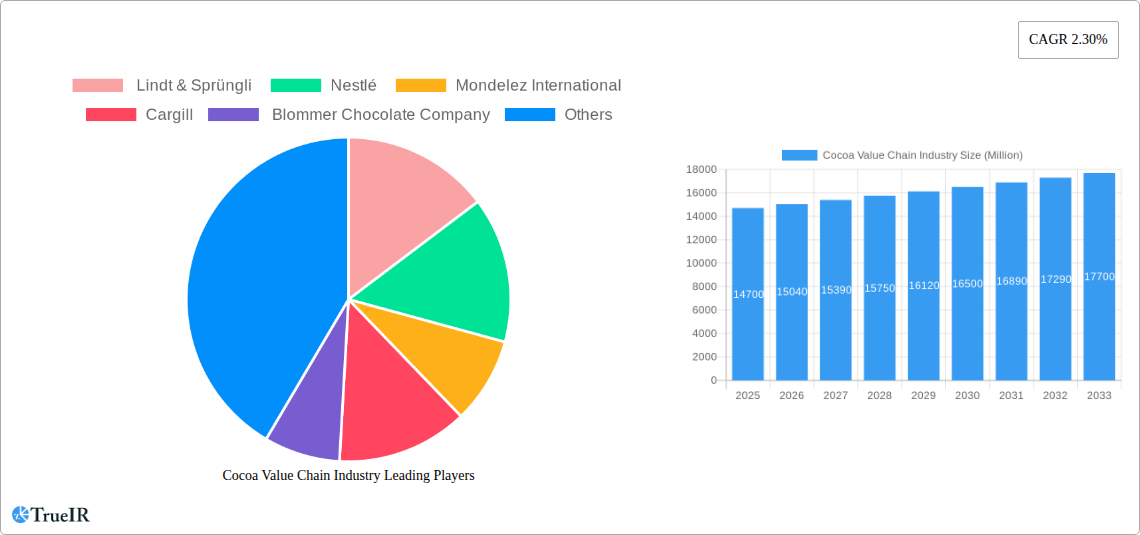
Cocoa Value Chain Industry Market Size (In Billion)
The dominance of established players, however, also presents opportunities for smaller, specialized companies focusing on niche markets such as organic or fair-trade cocoa products. These companies are able to capture a premium price point, appealing to the growing segment of ethically conscious consumers. Further growth hinges on addressing sustainability concerns, which include promoting environmentally friendly farming methods, securing fair prices for cocoa farmers, and reducing the environmental impact of cocoa production. Companies that actively address these issues will likely secure stronger market positions and consumer loyalty in the long term. The forecast period of 2025-2033 anticipates consistent growth, driven by continued innovation, consumer demand, and a focus on sustainable practices within the industry.

Cocoa Value Chain Industry Company Market Share
Cocoa Value Chain Industry: A Comprehensive Market Report (2019-2033)
This dynamic report provides a deep dive into the global cocoa value chain industry, offering invaluable insights for stakeholders across the entire ecosystem. From market size projections and competitive landscapes to emerging trends and future growth opportunities, this analysis covers all facets of this lucrative sector. The report utilizes data from 2019-2024 (Historical Period), with the Base Year set at 2025 and a Forecast Period spanning 2025-2033. The study period is 2019-2033. Expect detailed analysis of market segmentation, key players, and emerging trends with a focus on driving profitability and informed decision-making.
Cocoa Value Chain Industry Market Structure & Competitive Landscape
The cocoa value chain is characterized by a concentrated market structure at the processing and manufacturing levels, with significant players controlling a large share of global production. The Herfindahl-Hirschman Index (HHI) for the top 5 players in 2024 is estimated at xx, indicating a moderately concentrated market. Innovation is primarily driven by product diversification (e.g., organic cocoa, single-origin blends), sustainability initiatives (e.g., traceability, fair trade), and technological advancements in processing and production efficiency. Regulatory changes related to sustainability and labor practices significantly impact industry operations. Product substitutes, such as alternative sweeteners and plant-based chocolate alternatives, pose a growing threat, albeit limited currently.
The end-user segmentation is primarily divided into confectionery, food and beverage, and industrial applications, with confectionery dominating the market share. Mergers and acquisitions (M&A) activity has been relatively high in recent years, driven by companies seeking to expand their market share, diversify product portfolios, and enhance their supply chain control. The total M&A volume for the period 2019-2024 is estimated at USD xx Million. Key M&A trends include vertical integration, expanding geographical footprint and strategic partnerships.
Cocoa Value Chain Industry Market Trends & Opportunities
The global cocoa value chain market is experiencing robust growth, with an estimated Compound Annual Growth Rate (CAGR) of xx% during the forecast period (2025-2033). The market size is projected to reach USD xx Million by 2033. This growth is fueled by several key trends: increasing consumer demand for chocolate and cocoa products in developing economies; rising preference for premium and specialized cocoa products (e.g., organic, single-origin); and growing focus on sustainable and ethically sourced cocoa. Technological advancements such as precision fermentation and automation in processing are driving efficiency and reducing costs.
Shifting consumer preferences towards healthier and more sustainable options present both opportunities and challenges. Companies are adapting by offering products with reduced sugar content, promoting fair trade practices, and enhancing product traceability. The competitive landscape is characterized by intense rivalry among major players, necessitating continuous innovation and strategic partnerships to maintain market share and expand into new markets. Market penetration rates for organic cocoa are increasing rapidly, exceeding xx% in key markets by 2024.
Dominant Markets & Segments in Cocoa Value Chain Industry
While West Africa remains dominant in cocoa bean production, Europe and North America are the major consuming markets, driving demand and influencing market dynamics. Within cocoa product types, chocolate confectionery remains the largest segment, commanding a significant market share. Other segments include cocoa powder, cocoa butter, and cocoa liquor. Growth in specific segments varies depending on regional preferences and economic conditions.
- Key Growth Drivers:
- Robust Consumer Demand: Rising disposable incomes in emerging markets drive consumption.
- Product Diversification: Innovation in product offerings caters to diverse consumer tastes.
- Strong Infrastructure: Improved logistics and processing facilities enhance market access.
- Favorable Government Policies: Supporting policies promote sustainable farming practices and industry development.
The dominance of certain regions and segments is largely determined by factors like established production infrastructure, proximity to key markets, and favorable regulatory environments.
Cocoa Value Chain Industry Product Analysis
The cocoa value chain is a complex ecosystem encompassing everything from the cultivation of cocoa beans to the creation of a diverse array of finished chocolate and cocoa-based products. Recent technological advancements are revolutionizing this industry, leading to significant improvements in product quality, extended shelf life, and a stronger emphasis on sustainability. Innovations are particularly evident in areas such as advanced fermentation techniques for enhanced flavor profiles, precision milling for optimal texture and consistency, and the development of more energy-efficient and environmentally conscious processing methods. These advancements are designed to cater to an increasingly sophisticated consumer base with varied preferences and distinct market segments. A notable trend is the burgeoning demand for specialty cocoa products, where the focus shifts to specific origins, unique flavor notes, and artisanal production, signaling a clear move towards premiumization and greater appreciation for the nuanced qualities of cocoa.
Key Drivers, Barriers & Challenges in Cocoa Value Chain Industry
Key Drivers: The market's expansion is fueled by several potent forces, including consistently growing global demand for chocolate and cocoa products, a rise in disposable incomes, particularly in emerging economies, and a discernible shift in consumer preference towards premium and artisanal cocoa offerings. Furthermore, supportive government policies aimed at promoting sustainable cocoa farming practices and increased investment in research and development initiatives play a crucial role in driving industry growth.
Challenges: Despite the positive drivers, the industry faces significant hurdles. Price volatility of cocoa beans on the international market presents a persistent challenge. The growing impact of climate change, leading to unpredictable weather patterns and affecting cocoa yields, is a major concern. Deep-seated issues such as child labor and deforestation remain critical ethical and environmental challenges that require sustained and concerted efforts to address. Moreover, supply chain disruptions, exacerbated by geopolitical events and logistical complexities, along with evolving regulatory landscapes, particularly those concerning sustainability certifications and ethical sourcing practices, add layers of complexity to the industry's growth trajectory. The estimated financial impact of supply chain disruptions in 2023 alone was a substantial USD [Insert Specific Figure Here] Million, highlighting the critical need for robust risk mitigation strategies.
Growth Drivers in the Cocoa Value Chain Industry Market
The cocoa industry's growth is driven by factors such as increasing global demand for chocolate and cocoa products, particularly in emerging markets. Advancements in processing technologies lead to greater efficiency and innovation in product development. Furthermore, government support for sustainable cocoa farming practices and initiatives to improve supply chain transparency contribute to a more resilient and ethically sound industry.
Challenges Impacting Cocoa Value Chain Industry Growth
The cocoa value chain is confronted by a confluence of formidable challenges that can significantly impede its growth. Foremost among these are the inherent price volatility of cocoa beans, making financial planning and investment uncertain for all stakeholders. The intensifying effects of climate change, including extreme weather events and shifting growing conditions, directly threaten the sustainability and volume of cocoa yields. Furthermore, persistent ethical concerns surrounding child labor and deforestation continue to cast a shadow over the industry, necessitating rigorous oversight and proactive solutions. The increasing implementation of stricter regulations focused on sustainability and traceability imposes additional compliance burdens on companies, requiring greater transparency and investment in supply chain management. Supply chain disruptions, whether due to logistical bottlenecks, political instability, or unforeseen events, can lead to substantial production delays, increased costs, and significant financial losses across the value chain.
Key Players Shaping the Cocoa Value Chain Industry Market
- Lindt & Sprüngli
- Nestlé
- Mondelez International
- Cargill
- Blommer Chocolate Company
- Meiji Holdings Co., Ltd.
- Hershey's
- Mars
- Barry Callebaut
- Olam International
Significant Cocoa Value Chain Industry Milestones
- November 2021: Cargill completed a USD 100 Million expansion of its cocoa processing facilities in Yopougon, Côte d'Ivoire, significantly boosting its cocoa-grinding capacity.
- March 2022: Ivory Coast launched a pilot project to trace cocoa beans from farm to market, addressing deforestation and child labor issues.
- September 2022: Pronatec Swiss became the country's first 100% organic cocoa processing plant, processing approximately 15,000 metric tons of organic cocoa annually.
- October 2022: Niche Cocoa Industry (Ghana) partnered with Omanhene Cocoa Bean Co. (Milwaukee) to open a cocoa processing plant in the US, marking Niche's entry into the American market.
Future Outlook for Cocoa Value Chain Industry Market
The cocoa value chain is on a promising trajectory for sustained growth, propelled by a combination of escalating global demand, continuous product innovation, and an increasingly pronounced commitment to sustainability. Strategic opportunities abound for market expansion into new geographical regions, the development of novel and health-conscious cocoa-based products, and significant enhancements in supply chain efficiency, transparency, and resilience. The market holds substantial potential, offering avenues for both established industry giants and agile new entrants to secure and expand their market share. However, navigating the complexities and effectively addressing the critical challenges associated with climate change impacts, ensuring ethical sourcing and labor practices, and mitigating price volatility will be paramount for achieving enduring success and ensuring the long-term viability and prosperity of the cocoa value chain.
Cocoa Value Chain Industry Segmentation
- 1. Production Analysis
- 2. Consumption Analysis
- 3. Import Market Analysis (Value & Volume)
- 4. Export Market Analysis (Value & Volume)
- 5. Price Trend Analysis
Cocoa Value Chain Industry Segmentation By Geography
-
1. North America
- 1.1. United States
- 1.2. Canada
- 1.3. Mexico
-
2. South America
- 2.1. Brazil
- 2.2. Argentina
- 2.3. Rest of South America
-
3. Europe
- 3.1. United Kingdom
- 3.2. Germany
- 3.3. France
- 3.4. Italy
- 3.5. Spain
- 3.6. Russia
- 3.7. Benelux
- 3.8. Nordics
- 3.9. Rest of Europe
-
4. Middle East & Africa
- 4.1. Turkey
- 4.2. Israel
- 4.3. GCC
- 4.4. North Africa
- 4.5. South Africa
- 4.6. Rest of Middle East & Africa
-
5. Asia Pacific
- 5.1. China
- 5.2. India
- 5.3. Japan
- 5.4. South Korea
- 5.5. ASEAN
- 5.6. Oceania
- 5.7. Rest of Asia Pacific
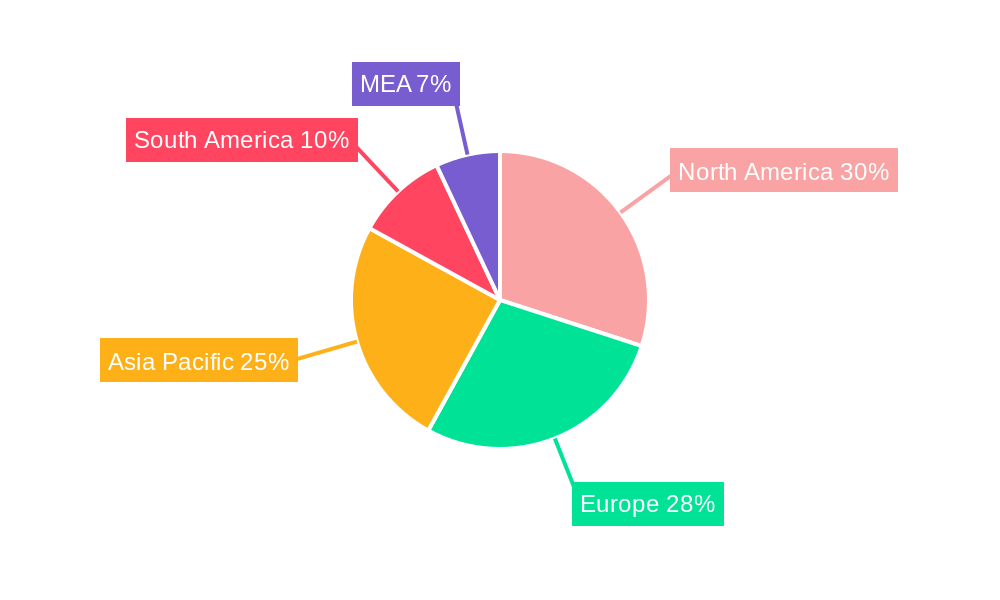
Cocoa Value Chain Industry Regional Market Share
Geographic Coverage of Cocoa Value Chain Industry
Cocoa Value Chain Industry REPORT HIGHLIGHTS
| Aspects | Details |
|---|---|
| Study Period | 2020-2034 |
| Base Year | 2025 |
| Estimated Year | 2026 |
| Forecast Period | 2026-2034 |
| Historical Period | 2020-2025 |
| Growth Rate | CAGR of 2.30% from 2020-2034 |
| Segmentation |
|
Table of Contents
- 1. Introduction
- 1.1. Research Scope
- 1.2. Market Segmentation
- 1.3. Research Methodology
- 1.4. Definitions and Assumptions
- 2. Executive Summary
- 2.1. Introduction
- 3. Market Dynamics
- 3.1. Introduction
- 3.2. Market Drivers
- 3.2.1. Rising Demand for Milled and Broken Rice; Growing Preference for Speciality Rice Variety; Government Initiatives Supports Rice Production
- 3.3. Market Restrains
- 3.3.1. Lack of Supply Chain for Rice; Growing Agricultural Labor Crisis
- 3.4. Market Trends
- 3.4.1. Sustainable Sourcing to Improve Economies for Stakeholders
- 4. Market Factor Analysis
- 4.1. Porters Five Forces
- 4.2. Supply/Value Chain
- 4.3. PESTEL analysis
- 4.4. Market Entropy
- 4.5. Patent/Trademark Analysis
- 5. Global Cocoa Value Chain Industry Analysis, Insights and Forecast, 2020-2032
- 5.1. Market Analysis, Insights and Forecast - by Production Analysis
- 5.2. Market Analysis, Insights and Forecast - by Consumption Analysis
- 5.3. Market Analysis, Insights and Forecast - by Import Market Analysis (Value & Volume)
- 5.4. Market Analysis, Insights and Forecast - by Export Market Analysis (Value & Volume)
- 5.5. Market Analysis, Insights and Forecast - by Price Trend Analysis
- 5.6. Market Analysis, Insights and Forecast - by Region
- 5.6.1. North America
- 5.6.2. South America
- 5.6.3. Europe
- 5.6.4. Middle East & Africa
- 5.6.5. Asia Pacific
- 5.1. Market Analysis, Insights and Forecast - by Production Analysis
- 6. North America Cocoa Value Chain Industry Analysis, Insights and Forecast, 2020-2032
- 6.1. Market Analysis, Insights and Forecast - by Production Analysis
- 6.2. Market Analysis, Insights and Forecast - by Consumption Analysis
- 6.3. Market Analysis, Insights and Forecast - by Import Market Analysis (Value & Volume)
- 6.4. Market Analysis, Insights and Forecast - by Export Market Analysis (Value & Volume)
- 6.5. Market Analysis, Insights and Forecast - by Price Trend Analysis
- 6.1. Market Analysis, Insights and Forecast - by Production Analysis
- 7. South America Cocoa Value Chain Industry Analysis, Insights and Forecast, 2020-2032
- 7.1. Market Analysis, Insights and Forecast - by Production Analysis
- 7.2. Market Analysis, Insights and Forecast - by Consumption Analysis
- 7.3. Market Analysis, Insights and Forecast - by Import Market Analysis (Value & Volume)
- 7.4. Market Analysis, Insights and Forecast - by Export Market Analysis (Value & Volume)
- 7.5. Market Analysis, Insights and Forecast - by Price Trend Analysis
- 7.1. Market Analysis, Insights and Forecast - by Production Analysis
- 8. Europe Cocoa Value Chain Industry Analysis, Insights and Forecast, 2020-2032
- 8.1. Market Analysis, Insights and Forecast - by Production Analysis
- 8.2. Market Analysis, Insights and Forecast - by Consumption Analysis
- 8.3. Market Analysis, Insights and Forecast - by Import Market Analysis (Value & Volume)
- 8.4. Market Analysis, Insights and Forecast - by Export Market Analysis (Value & Volume)
- 8.5. Market Analysis, Insights and Forecast - by Price Trend Analysis
- 8.1. Market Analysis, Insights and Forecast - by Production Analysis
- 9. Middle East & Africa Cocoa Value Chain Industry Analysis, Insights and Forecast, 2020-2032
- 9.1. Market Analysis, Insights and Forecast - by Production Analysis
- 9.2. Market Analysis, Insights and Forecast - by Consumption Analysis
- 9.3. Market Analysis, Insights and Forecast - by Import Market Analysis (Value & Volume)
- 9.4. Market Analysis, Insights and Forecast - by Export Market Analysis (Value & Volume)
- 9.5. Market Analysis, Insights and Forecast - by Price Trend Analysis
- 9.1. Market Analysis, Insights and Forecast - by Production Analysis
- 10. Asia Pacific Cocoa Value Chain Industry Analysis, Insights and Forecast, 2020-2032
- 10.1. Market Analysis, Insights and Forecast - by Production Analysis
- 10.2. Market Analysis, Insights and Forecast - by Consumption Analysis
- 10.3. Market Analysis, Insights and Forecast - by Import Market Analysis (Value & Volume)
- 10.4. Market Analysis, Insights and Forecast - by Export Market Analysis (Value & Volume)
- 10.5. Market Analysis, Insights and Forecast - by Price Trend Analysis
- 10.1. Market Analysis, Insights and Forecast - by Production Analysis
- 11. Competitive Analysis
- 11.1. Global Market Share Analysis 2025
- 11.2. Company Profiles
- 11.2.1 Lindt & Sprüngli
- 11.2.1.1. Overview
- 11.2.1.2. Products
- 11.2.1.3. SWOT Analysis
- 11.2.1.4. Recent Developments
- 11.2.1.5. Financials (Based on Availability)
- 11.2.2 Nestlé
- 11.2.2.1. Overview
- 11.2.2.2. Products
- 11.2.2.3. SWOT Analysis
- 11.2.2.4. Recent Developments
- 11.2.2.5. Financials (Based on Availability)
- 11.2.3 Mondelez International
- 11.2.3.1. Overview
- 11.2.3.2. Products
- 11.2.3.3. SWOT Analysis
- 11.2.3.4. Recent Developments
- 11.2.3.5. Financials (Based on Availability)
- 11.2.4 Cargill
- 11.2.4.1. Overview
- 11.2.4.2. Products
- 11.2.4.3. SWOT Analysis
- 11.2.4.4. Recent Developments
- 11.2.4.5. Financials (Based on Availability)
- 11.2.5 Blommer Chocolate Company
- 11.2.5.1. Overview
- 11.2.5.2. Products
- 11.2.5.3. SWOT Analysis
- 11.2.5.4. Recent Developments
- 11.2.5.5. Financials (Based on Availability)
- 11.2.6 Meiji Holdings Co. Ltd.
- 11.2.6.1. Overview
- 11.2.6.2. Products
- 11.2.6.3. SWOT Analysis
- 11.2.6.4. Recent Developments
- 11.2.6.5. Financials (Based on Availability)
- 11.2.7 Hershey's
- 11.2.7.1. Overview
- 11.2.7.2. Products
- 11.2.7.3. SWOT Analysis
- 11.2.7.4. Recent Developments
- 11.2.7.5. Financials (Based on Availability)
- 11.2.8 Mars
- 11.2.8.1. Overview
- 11.2.8.2. Products
- 11.2.8.3. SWOT Analysis
- 11.2.8.4. Recent Developments
- 11.2.8.5. Financials (Based on Availability)
- 11.2.9 Barry Callebaut
- 11.2.9.1. Overview
- 11.2.9.2. Products
- 11.2.9.3. SWOT Analysis
- 11.2.9.4. Recent Developments
- 11.2.9.5. Financials (Based on Availability)
- 11.2.10 Olam International
- 11.2.10.1. Overview
- 11.2.10.2. Products
- 11.2.10.3. SWOT Analysis
- 11.2.10.4. Recent Developments
- 11.2.10.5. Financials (Based on Availability)
- 11.2.1 Lindt & Sprüngli
List of Figures
- Figure 1: Global Cocoa Value Chain Industry Revenue Breakdown (Million, %) by Region 2025 & 2033
- Figure 2: North America Cocoa Value Chain Industry Revenue (Million), by Production Analysis 2025 & 2033
- Figure 3: North America Cocoa Value Chain Industry Revenue Share (%), by Production Analysis 2025 & 2033
- Figure 4: North America Cocoa Value Chain Industry Revenue (Million), by Consumption Analysis 2025 & 2033
- Figure 5: North America Cocoa Value Chain Industry Revenue Share (%), by Consumption Analysis 2025 & 2033
- Figure 6: North America Cocoa Value Chain Industry Revenue (Million), by Import Market Analysis (Value & Volume) 2025 & 2033
- Figure 7: North America Cocoa Value Chain Industry Revenue Share (%), by Import Market Analysis (Value & Volume) 2025 & 2033
- Figure 8: North America Cocoa Value Chain Industry Revenue (Million), by Export Market Analysis (Value & Volume) 2025 & 2033
- Figure 9: North America Cocoa Value Chain Industry Revenue Share (%), by Export Market Analysis (Value & Volume) 2025 & 2033
- Figure 10: North America Cocoa Value Chain Industry Revenue (Million), by Price Trend Analysis 2025 & 2033
- Figure 11: North America Cocoa Value Chain Industry Revenue Share (%), by Price Trend Analysis 2025 & 2033
- Figure 12: North America Cocoa Value Chain Industry Revenue (Million), by Country 2025 & 2033
- Figure 13: North America Cocoa Value Chain Industry Revenue Share (%), by Country 2025 & 2033
- Figure 14: South America Cocoa Value Chain Industry Revenue (Million), by Production Analysis 2025 & 2033
- Figure 15: South America Cocoa Value Chain Industry Revenue Share (%), by Production Analysis 2025 & 2033
- Figure 16: South America Cocoa Value Chain Industry Revenue (Million), by Consumption Analysis 2025 & 2033
- Figure 17: South America Cocoa Value Chain Industry Revenue Share (%), by Consumption Analysis 2025 & 2033
- Figure 18: South America Cocoa Value Chain Industry Revenue (Million), by Import Market Analysis (Value & Volume) 2025 & 2033
- Figure 19: South America Cocoa Value Chain Industry Revenue Share (%), by Import Market Analysis (Value & Volume) 2025 & 2033
- Figure 20: South America Cocoa Value Chain Industry Revenue (Million), by Export Market Analysis (Value & Volume) 2025 & 2033
- Figure 21: South America Cocoa Value Chain Industry Revenue Share (%), by Export Market Analysis (Value & Volume) 2025 & 2033
- Figure 22: South America Cocoa Value Chain Industry Revenue (Million), by Price Trend Analysis 2025 & 2033
- Figure 23: South America Cocoa Value Chain Industry Revenue Share (%), by Price Trend Analysis 2025 & 2033
- Figure 24: South America Cocoa Value Chain Industry Revenue (Million), by Country 2025 & 2033
- Figure 25: South America Cocoa Value Chain Industry Revenue Share (%), by Country 2025 & 2033
- Figure 26: Europe Cocoa Value Chain Industry Revenue (Million), by Production Analysis 2025 & 2033
- Figure 27: Europe Cocoa Value Chain Industry Revenue Share (%), by Production Analysis 2025 & 2033
- Figure 28: Europe Cocoa Value Chain Industry Revenue (Million), by Consumption Analysis 2025 & 2033
- Figure 29: Europe Cocoa Value Chain Industry Revenue Share (%), by Consumption Analysis 2025 & 2033
- Figure 30: Europe Cocoa Value Chain Industry Revenue (Million), by Import Market Analysis (Value & Volume) 2025 & 2033
- Figure 31: Europe Cocoa Value Chain Industry Revenue Share (%), by Import Market Analysis (Value & Volume) 2025 & 2033
- Figure 32: Europe Cocoa Value Chain Industry Revenue (Million), by Export Market Analysis (Value & Volume) 2025 & 2033
- Figure 33: Europe Cocoa Value Chain Industry Revenue Share (%), by Export Market Analysis (Value & Volume) 2025 & 2033
- Figure 34: Europe Cocoa Value Chain Industry Revenue (Million), by Price Trend Analysis 2025 & 2033
- Figure 35: Europe Cocoa Value Chain Industry Revenue Share (%), by Price Trend Analysis 2025 & 2033
- Figure 36: Europe Cocoa Value Chain Industry Revenue (Million), by Country 2025 & 2033
- Figure 37: Europe Cocoa Value Chain Industry Revenue Share (%), by Country 2025 & 2033
- Figure 38: Middle East & Africa Cocoa Value Chain Industry Revenue (Million), by Production Analysis 2025 & 2033
- Figure 39: Middle East & Africa Cocoa Value Chain Industry Revenue Share (%), by Production Analysis 2025 & 2033
- Figure 40: Middle East & Africa Cocoa Value Chain Industry Revenue (Million), by Consumption Analysis 2025 & 2033
- Figure 41: Middle East & Africa Cocoa Value Chain Industry Revenue Share (%), by Consumption Analysis 2025 & 2033
- Figure 42: Middle East & Africa Cocoa Value Chain Industry Revenue (Million), by Import Market Analysis (Value & Volume) 2025 & 2033
- Figure 43: Middle East & Africa Cocoa Value Chain Industry Revenue Share (%), by Import Market Analysis (Value & Volume) 2025 & 2033
- Figure 44: Middle East & Africa Cocoa Value Chain Industry Revenue (Million), by Export Market Analysis (Value & Volume) 2025 & 2033
- Figure 45: Middle East & Africa Cocoa Value Chain Industry Revenue Share (%), by Export Market Analysis (Value & Volume) 2025 & 2033
- Figure 46: Middle East & Africa Cocoa Value Chain Industry Revenue (Million), by Price Trend Analysis 2025 & 2033
- Figure 47: Middle East & Africa Cocoa Value Chain Industry Revenue Share (%), by Price Trend Analysis 2025 & 2033
- Figure 48: Middle East & Africa Cocoa Value Chain Industry Revenue (Million), by Country 2025 & 2033
- Figure 49: Middle East & Africa Cocoa Value Chain Industry Revenue Share (%), by Country 2025 & 2033
- Figure 50: Asia Pacific Cocoa Value Chain Industry Revenue (Million), by Production Analysis 2025 & 2033
- Figure 51: Asia Pacific Cocoa Value Chain Industry Revenue Share (%), by Production Analysis 2025 & 2033
- Figure 52: Asia Pacific Cocoa Value Chain Industry Revenue (Million), by Consumption Analysis 2025 & 2033
- Figure 53: Asia Pacific Cocoa Value Chain Industry Revenue Share (%), by Consumption Analysis 2025 & 2033
- Figure 54: Asia Pacific Cocoa Value Chain Industry Revenue (Million), by Import Market Analysis (Value & Volume) 2025 & 2033
- Figure 55: Asia Pacific Cocoa Value Chain Industry Revenue Share (%), by Import Market Analysis (Value & Volume) 2025 & 2033
- Figure 56: Asia Pacific Cocoa Value Chain Industry Revenue (Million), by Export Market Analysis (Value & Volume) 2025 & 2033
- Figure 57: Asia Pacific Cocoa Value Chain Industry Revenue Share (%), by Export Market Analysis (Value & Volume) 2025 & 2033
- Figure 58: Asia Pacific Cocoa Value Chain Industry Revenue (Million), by Price Trend Analysis 2025 & 2033
- Figure 59: Asia Pacific Cocoa Value Chain Industry Revenue Share (%), by Price Trend Analysis 2025 & 2033
- Figure 60: Asia Pacific Cocoa Value Chain Industry Revenue (Million), by Country 2025 & 2033
- Figure 61: Asia Pacific Cocoa Value Chain Industry Revenue Share (%), by Country 2025 & 2033
List of Tables
- Table 1: Global Cocoa Value Chain Industry Revenue Million Forecast, by Production Analysis 2020 & 2033
- Table 2: Global Cocoa Value Chain Industry Revenue Million Forecast, by Consumption Analysis 2020 & 2033
- Table 3: Global Cocoa Value Chain Industry Revenue Million Forecast, by Import Market Analysis (Value & Volume) 2020 & 2033
- Table 4: Global Cocoa Value Chain Industry Revenue Million Forecast, by Export Market Analysis (Value & Volume) 2020 & 2033
- Table 5: Global Cocoa Value Chain Industry Revenue Million Forecast, by Price Trend Analysis 2020 & 2033
- Table 6: Global Cocoa Value Chain Industry Revenue Million Forecast, by Region 2020 & 2033
- Table 7: Global Cocoa Value Chain Industry Revenue Million Forecast, by Production Analysis 2020 & 2033
- Table 8: Global Cocoa Value Chain Industry Revenue Million Forecast, by Consumption Analysis 2020 & 2033
- Table 9: Global Cocoa Value Chain Industry Revenue Million Forecast, by Import Market Analysis (Value & Volume) 2020 & 2033
- Table 10: Global Cocoa Value Chain Industry Revenue Million Forecast, by Export Market Analysis (Value & Volume) 2020 & 2033
- Table 11: Global Cocoa Value Chain Industry Revenue Million Forecast, by Price Trend Analysis 2020 & 2033
- Table 12: Global Cocoa Value Chain Industry Revenue Million Forecast, by Country 2020 & 2033
- Table 13: United States Cocoa Value Chain Industry Revenue (Million) Forecast, by Application 2020 & 2033
- Table 14: Canada Cocoa Value Chain Industry Revenue (Million) Forecast, by Application 2020 & 2033
- Table 15: Mexico Cocoa Value Chain Industry Revenue (Million) Forecast, by Application 2020 & 2033
- Table 16: Global Cocoa Value Chain Industry Revenue Million Forecast, by Production Analysis 2020 & 2033
- Table 17: Global Cocoa Value Chain Industry Revenue Million Forecast, by Consumption Analysis 2020 & 2033
- Table 18: Global Cocoa Value Chain Industry Revenue Million Forecast, by Import Market Analysis (Value & Volume) 2020 & 2033
- Table 19: Global Cocoa Value Chain Industry Revenue Million Forecast, by Export Market Analysis (Value & Volume) 2020 & 2033
- Table 20: Global Cocoa Value Chain Industry Revenue Million Forecast, by Price Trend Analysis 2020 & 2033
- Table 21: Global Cocoa Value Chain Industry Revenue Million Forecast, by Country 2020 & 2033
- Table 22: Brazil Cocoa Value Chain Industry Revenue (Million) Forecast, by Application 2020 & 2033
- Table 23: Argentina Cocoa Value Chain Industry Revenue (Million) Forecast, by Application 2020 & 2033
- Table 24: Rest of South America Cocoa Value Chain Industry Revenue (Million) Forecast, by Application 2020 & 2033
- Table 25: Global Cocoa Value Chain Industry Revenue Million Forecast, by Production Analysis 2020 & 2033
- Table 26: Global Cocoa Value Chain Industry Revenue Million Forecast, by Consumption Analysis 2020 & 2033
- Table 27: Global Cocoa Value Chain Industry Revenue Million Forecast, by Import Market Analysis (Value & Volume) 2020 & 2033
- Table 28: Global Cocoa Value Chain Industry Revenue Million Forecast, by Export Market Analysis (Value & Volume) 2020 & 2033
- Table 29: Global Cocoa Value Chain Industry Revenue Million Forecast, by Price Trend Analysis 2020 & 2033
- Table 30: Global Cocoa Value Chain Industry Revenue Million Forecast, by Country 2020 & 2033
- Table 31: United Kingdom Cocoa Value Chain Industry Revenue (Million) Forecast, by Application 2020 & 2033
- Table 32: Germany Cocoa Value Chain Industry Revenue (Million) Forecast, by Application 2020 & 2033
- Table 33: France Cocoa Value Chain Industry Revenue (Million) Forecast, by Application 2020 & 2033
- Table 34: Italy Cocoa Value Chain Industry Revenue (Million) Forecast, by Application 2020 & 2033
- Table 35: Spain Cocoa Value Chain Industry Revenue (Million) Forecast, by Application 2020 & 2033
- Table 36: Russia Cocoa Value Chain Industry Revenue (Million) Forecast, by Application 2020 & 2033
- Table 37: Benelux Cocoa Value Chain Industry Revenue (Million) Forecast, by Application 2020 & 2033
- Table 38: Nordics Cocoa Value Chain Industry Revenue (Million) Forecast, by Application 2020 & 2033
- Table 39: Rest of Europe Cocoa Value Chain Industry Revenue (Million) Forecast, by Application 2020 & 2033
- Table 40: Global Cocoa Value Chain Industry Revenue Million Forecast, by Production Analysis 2020 & 2033
- Table 41: Global Cocoa Value Chain Industry Revenue Million Forecast, by Consumption Analysis 2020 & 2033
- Table 42: Global Cocoa Value Chain Industry Revenue Million Forecast, by Import Market Analysis (Value & Volume) 2020 & 2033
- Table 43: Global Cocoa Value Chain Industry Revenue Million Forecast, by Export Market Analysis (Value & Volume) 2020 & 2033
- Table 44: Global Cocoa Value Chain Industry Revenue Million Forecast, by Price Trend Analysis 2020 & 2033
- Table 45: Global Cocoa Value Chain Industry Revenue Million Forecast, by Country 2020 & 2033
- Table 46: Turkey Cocoa Value Chain Industry Revenue (Million) Forecast, by Application 2020 & 2033
- Table 47: Israel Cocoa Value Chain Industry Revenue (Million) Forecast, by Application 2020 & 2033
- Table 48: GCC Cocoa Value Chain Industry Revenue (Million) Forecast, by Application 2020 & 2033
- Table 49: North Africa Cocoa Value Chain Industry Revenue (Million) Forecast, by Application 2020 & 2033
- Table 50: South Africa Cocoa Value Chain Industry Revenue (Million) Forecast, by Application 2020 & 2033
- Table 51: Rest of Middle East & Africa Cocoa Value Chain Industry Revenue (Million) Forecast, by Application 2020 & 2033
- Table 52: Global Cocoa Value Chain Industry Revenue Million Forecast, by Production Analysis 2020 & 2033
- Table 53: Global Cocoa Value Chain Industry Revenue Million Forecast, by Consumption Analysis 2020 & 2033
- Table 54: Global Cocoa Value Chain Industry Revenue Million Forecast, by Import Market Analysis (Value & Volume) 2020 & 2033
- Table 55: Global Cocoa Value Chain Industry Revenue Million Forecast, by Export Market Analysis (Value & Volume) 2020 & 2033
- Table 56: Global Cocoa Value Chain Industry Revenue Million Forecast, by Price Trend Analysis 2020 & 2033
- Table 57: Global Cocoa Value Chain Industry Revenue Million Forecast, by Country 2020 & 2033
- Table 58: China Cocoa Value Chain Industry Revenue (Million) Forecast, by Application 2020 & 2033
- Table 59: India Cocoa Value Chain Industry Revenue (Million) Forecast, by Application 2020 & 2033
- Table 60: Japan Cocoa Value Chain Industry Revenue (Million) Forecast, by Application 2020 & 2033
- Table 61: South Korea Cocoa Value Chain Industry Revenue (Million) Forecast, by Application 2020 & 2033
- Table 62: ASEAN Cocoa Value Chain Industry Revenue (Million) Forecast, by Application 2020 & 2033
- Table 63: Oceania Cocoa Value Chain Industry Revenue (Million) Forecast, by Application 2020 & 2033
- Table 64: Rest of Asia Pacific Cocoa Value Chain Industry Revenue (Million) Forecast, by Application 2020 & 2033
Frequently Asked Questions
1. What is the projected Compound Annual Growth Rate (CAGR) of the Cocoa Value Chain Industry?
The projected CAGR is approximately 2.30%.
2. Which companies are prominent players in the Cocoa Value Chain Industry?
Key companies in the market include Lindt & Sprüngli , Nestlé , Mondelez International , Cargill, Blommer Chocolate Company, Meiji Holdings Co., Ltd., Hershey's , Mars , Barry Callebaut, Olam International .
3. What are the main segments of the Cocoa Value Chain Industry?
The market segments include Production Analysis, Consumption Analysis, Import Market Analysis (Value & Volume), Export Market Analysis (Value & Volume), Price Trend Analysis.
4. Can you provide details about the market size?
The market size is estimated to be USD 14.70 Million as of 2022.
5. What are some drivers contributing to market growth?
Rising Demand for Milled and Broken Rice; Growing Preference for Speciality Rice Variety; Government Initiatives Supports Rice Production.
6. What are the notable trends driving market growth?
Sustainable Sourcing to Improve Economies for Stakeholders.
7. Are there any restraints impacting market growth?
Lack of Supply Chain for Rice; Growing Agricultural Labor Crisis.
8. Can you provide examples of recent developments in the market?
October 2022: A wholly-owned Ghanaian company, Niche Cocoa Industry, has collaborated with Omanhene Cocoa Bean Co., of Milwaukee, in a leased 44,000-square-foot cocoa processing plant in the Franklin Business Park, United States. It is the first United States facility for Niche, in which the largest cocoa processor in Ghana has entered the United States to strengthen the cocoa food and beverage industry.
9. What pricing options are available for accessing the report?
Pricing options include single-user, multi-user, and enterprise licenses priced at USD 3800, USD 4500, and USD 5800 respectively.
10. Is the market size provided in terms of value or volume?
The market size is provided in terms of value, measured in Million.
11. Are there any specific market keywords associated with the report?
Yes, the market keyword associated with the report is "Cocoa Value Chain Industry," which aids in identifying and referencing the specific market segment covered.
12. How do I determine which pricing option suits my needs best?
The pricing options vary based on user requirements and access needs. Individual users may opt for single-user licenses, while businesses requiring broader access may choose multi-user or enterprise licenses for cost-effective access to the report.
13. Are there any additional resources or data provided in the Cocoa Value Chain Industry report?
While the report offers comprehensive insights, it's advisable to review the specific contents or supplementary materials provided to ascertain if additional resources or data are available.
14. How can I stay updated on further developments or reports in the Cocoa Value Chain Industry?
To stay informed about further developments, trends, and reports in the Cocoa Value Chain Industry, consider subscribing to industry newsletters, following relevant companies and organizations, or regularly checking reputable industry news sources and publications.
Methodology
Step 1 - Identification of Relevant Samples Size from Population Database


Step 2 - Approaches for Defining Global Market Size (Value, Volume* & Price*)

Note*: In applicable scenarios
Step 3 - Data Sources
Primary Research
- Web Analytics
- Survey Reports
- Research Institute
- Latest Research Reports
- Opinion Leaders
Secondary Research
- Annual Reports
- White Paper
- Latest Press Release
- Industry Association
- Paid Database
- Investor Presentations

Step 4 - Data Triangulation
Involves using different sources of information in order to increase the validity of a study
These sources are likely to be stakeholders in a program - participants, other researchers, program staff, other community members, and so on.
Then we put all data in single framework & apply various statistical tools to find out the dynamic on the market.
During the analysis stage, feedback from the stakeholder groups would be compared to determine areas of agreement as well as areas of divergence