

Key Insights
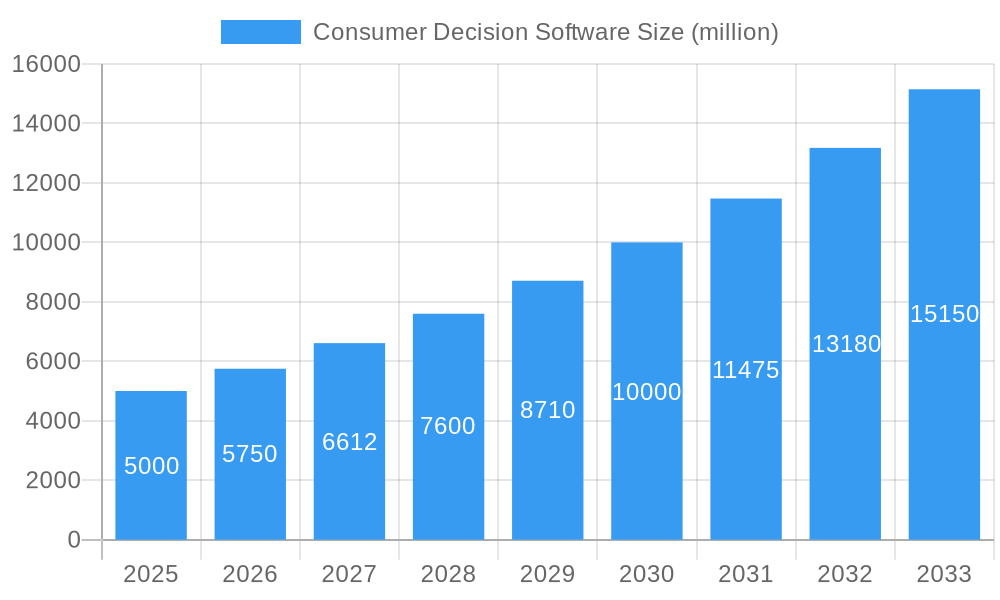
The consumer decision software market is experiencing robust growth, driven by the increasing need for businesses to understand and predict consumer behavior in an increasingly complex and data-rich environment. This market, estimated at $5 billion in 2025, is projected to achieve a Compound Annual Growth Rate (CAGR) of 15% from 2025 to 2033, reaching approximately $15 billion by 2033. This expansion is fueled by several key factors. The rising adoption of digital channels by consumers necessitates sophisticated software solutions for targeted marketing and personalized experiences. Furthermore, the growing availability of big data and advanced analytics provides businesses with unprecedented insights into consumer preferences, enabling more effective decision-making. The increasing complexity of regulatory environments in various sectors also contributes to the market's growth, as businesses require tools to ensure compliance and manage risk related to consumer data privacy and protection. Finally, the shift towards agile and data-driven decision-making within organizations is further bolstering the demand for consumer decision software.
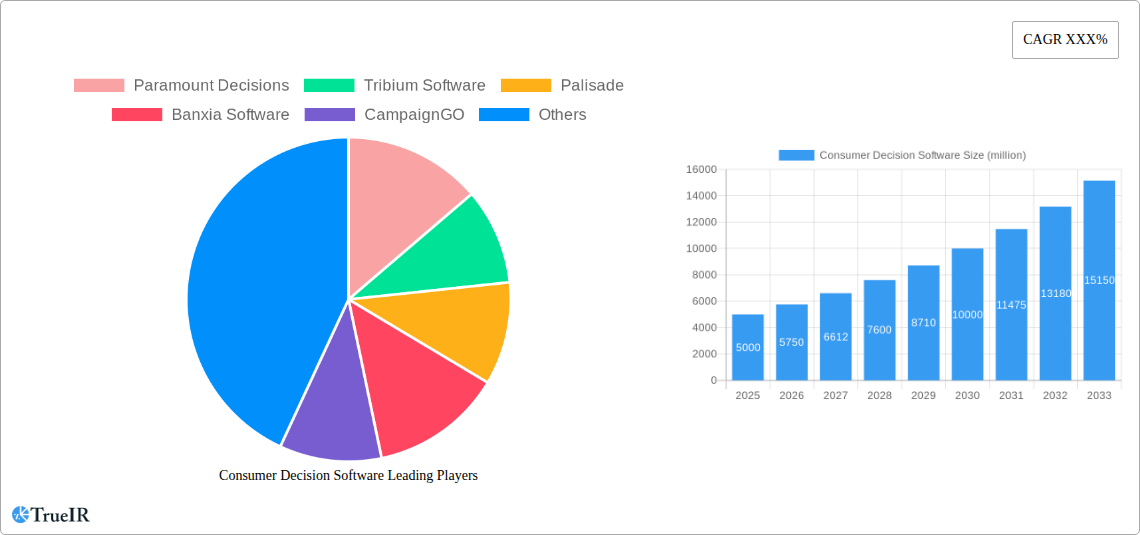
Consumer Decision Software Market Size (In Billion)
The market is segmented based on several factors including deployment (cloud vs. on-premise), functionality (predictive analytics, customer segmentation, etc.), and industry vertical. Leading players like Paramount Decisions, Tribium Software, Palisade, Banxia Software, CampaignGO, Defense Group, Dataland Software, SAP, Qlik, Information Builders, Parmenides, TIBCO Software, and Riskturn are vying for market share, with varying strategies around product innovation, partnerships, and geographic expansion. The competitive landscape is characterized by both established players with comprehensive offerings and niche players specializing in specific functionalities or industries. However, restraints such as the high initial investment cost and the need for skilled professionals to effectively utilize the software can hinder wider adoption, especially amongst smaller businesses. Future growth will depend on advancements in artificial intelligence (AI) and machine learning (ML), improving the accuracy and efficiency of consumer behavior predictions, coupled with user-friendly interfaces and accessible pricing models.
Consumer Decision Software Company Market Share
Dynamic Consumer Decision Software Market Report: 2019-2033
This comprehensive report provides a detailed analysis of the global Consumer Decision Software market, projecting a multi-million dollar valuation by 2033. Leveraging a robust methodology encompassing historical data (2019-2024), a base year of 2025, and a forecast period extending to 2033, this report offers invaluable insights for stakeholders across the value chain. Key players like Paramount Decisions, Tribium Software, Palisade, and SAP are profiled, alongside analysis of market trends, growth drivers, and challenges.
Consumer Decision Software Market Structure & Competitive Landscape
The Consumer Decision Software market exhibits a moderately concentrated structure, with a few major players commanding significant market share. The Herfindahl-Hirschman Index (HHI) for 2024 was estimated at xx, indicating a moderately concentrated market. However, the market is dynamic, with ongoing innovation driving competition and reshaping the competitive landscape. Regulatory changes, particularly concerning data privacy and security, significantly impact market players, demanding robust compliance strategies. Product substitution is a factor, as alternative decision-making tools emerge, but the sophisticated analytics and integrated functionalities of Consumer Decision Software maintain a competitive edge.
- Market Concentration: HHI (2024): xx; projected to decrease slightly by 2033 to xx due to increased market entry.
- Innovation Drivers: Advanced analytics, AI integration, and improved user interfaces are key drivers of innovation.
- Regulatory Impacts: GDPR, CCPA, and similar regulations significantly influence data handling and security practices.
- Product Substitutes: Simpler decision-making tools and spreadsheets pose some competitive pressure, but advanced analytics features of Consumer Decision Software provide differentiation.
- End-User Segmentation: The market caters to a diverse range of end-users, including businesses of all sizes, government agencies, and research institutions.
- M&A Trends: Over the historical period (2019-2024), xx major M&A transactions were recorded, totaling an estimated value of $xx million. This trend is expected to continue with an estimated xx deals projected by 2033.
Consumer Decision Software Market Trends & Opportunities
The global Consumer Decision Software market is experiencing robust growth, driven by the increasing adoption of data-driven decision-making across industries. The market size is projected to reach $xx million by 2025, expanding at a Compound Annual Growth Rate (CAGR) of xx% from 2025 to 2033. This growth is fueled by technological advancements, such as artificial intelligence (AI) and machine learning (ML), improving the accuracy and efficiency of decision-making processes. Consumer preferences are increasingly shifting towards intuitive, user-friendly software solutions that offer real-time insights and predictive analytics. Competitive dynamics are characterized by innovation, strategic partnerships, and acquisitions, leading to an ever-evolving landscape. Market penetration rates are expected to increase significantly within the forecast period, especially across sectors experiencing digital transformation.
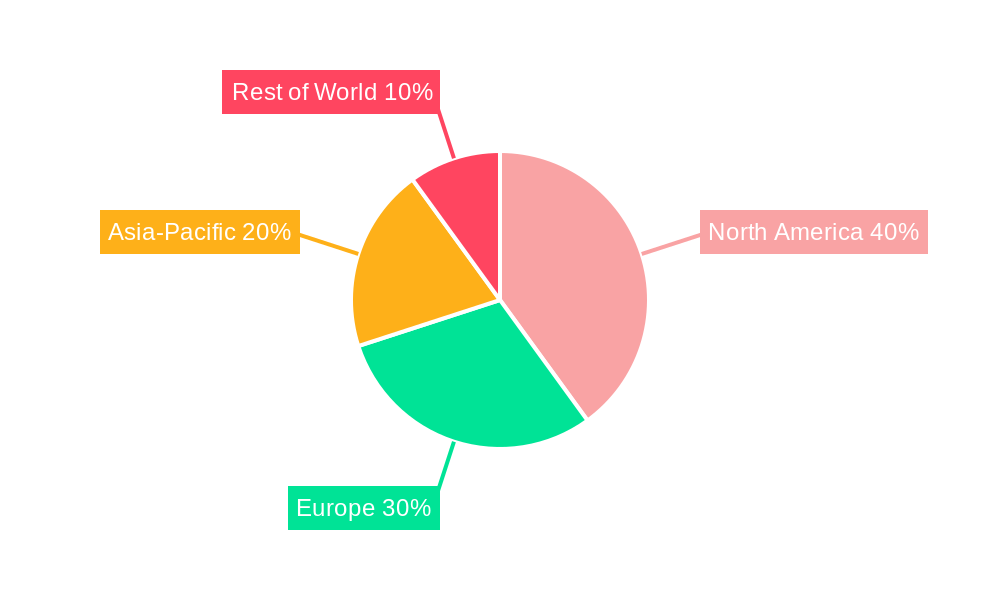
Dominant Markets & Segments in Consumer Decision Software
The North American region currently holds the largest market share in Consumer Decision Software, accounting for $xx million in 2025. This dominance is attributed to several factors:
- Advanced technological infrastructure: The region boasts robust technological infrastructure supporting the adoption of sophisticated software solutions.
- High technological adoption rates: Businesses and organizations in North America are early adopters of advanced technologies.
- Favorable regulatory environment: While regulations exist, they generally foster innovation and data-driven decision making.
- High disposable income: Economic factors support higher investment in business intelligence and analytics solutions.
However, the Asia-Pacific region is projected to witness the fastest growth rate in the forecast period, driven by rising digitalization and increasing investment in data analytics capabilities across emerging economies.
Consumer Decision Software Product Analysis
Consumer Decision Software products are evolving rapidly, integrating advanced analytics capabilities, AI-powered insights, and user-friendly interfaces. This evolution allows businesses to leverage large datasets for improved forecasting, risk assessment, and strategic planning. Key differentiators among products include the range of analytical capabilities, ease of use, integration with existing systems, and the level of customization offered. The market shows a strong inclination towards cloud-based solutions due to their scalability, cost-effectiveness, and accessibility.
Key Drivers, Barriers & Challenges in Consumer Decision Software
Key Drivers: The market is driven by the increasing demand for data-driven decision making, the rising adoption of cloud-based solutions, and the proliferation of big data analytics. Furthermore, government initiatives promoting digital transformation and the growing awareness of the value of data-driven insights are crucial drivers.
Challenges: Key challenges include the high cost of implementation and maintenance, the need for skilled professionals to manage and interpret the data, and the complexities of data security and privacy regulations. These challenges, coupled with intense competition and the rapid pace of technological change, present significant hurdles for market players. Supply chain disruptions can also impact the timely delivery and availability of software solutions, further hindering market growth. For instance, the semiconductor shortage in 2022-2023 negatively impacted the supply of hardware required for some software solutions leading to delays and increased costs.
Growth Drivers in the Consumer Decision Software Market
The primary growth drivers include the accelerating digital transformation across various industries, the increasing availability of large datasets, and the rising adoption of cloud computing. Government initiatives promoting data-driven decision-making also contribute to market growth. Advanced analytical capabilities embedded in these software solutions are pivotal to enabling rapid and informed decision-making that improves operational efficiency and profitability.
Challenges Impacting Consumer Decision Software Growth
Significant barriers to market growth include the high initial investment required for implementation and the need for specialized expertise in data analytics. Regulatory complexities surrounding data privacy and security, coupled with cybersecurity threats, create additional challenges. Competition from established players and emerging startups also impacts market growth. The global economic downturn or recession could also significantly influence spending on non-essential software in the coming years.
Key Players Shaping the Consumer Decision Software Market
- Paramount Decisions
- Tribium Software
- Palisade
- Banxia Software
- CampaignGO
- Defense Group
- Dataland Software
- SAP
- Qlik
- Information Builders
- Parmenides
- TIBCO Software
- Riskturn
Significant Consumer Decision Software Industry Milestones
- 2020, Q4: Paramount Decisions launched its AI-powered decision support tool.
- 2021, Q2: SAP acquired a smaller analytics firm, expanding its Consumer Decision Software portfolio.
- 2022, Q1: New data privacy regulations in Europe impacted the market significantly.
- 2023, Q3: Tribium Software released a major update to its flagship software, incorporating advanced machine learning capabilities.
Future Outlook for Consumer Decision Software Market
The Consumer Decision Software market is poised for continued growth, driven by technological advancements, increasing data availability, and the growing need for data-driven decision-making across industries. Strategic partnerships, acquisitions, and continuous product innovation will shape the competitive landscape. The market presents significant opportunities for companies that can offer innovative solutions that address the challenges of data management, analysis, and security while also providing user-friendly interfaces and accessible deployment options. The market is projected to reach $xx million by 2033, demonstrating substantial growth potential.
Consumer Decision Software Segmentation
-
1. Application
- 1.1. Enterprise
- 1.2. Municipal
-
2. Type
- 2.1. Group Decision Support System
- 2.2. Distributed Decision Support System
- 2.3. Intelligent Decision Support System
Consumer Decision Software Segmentation By Geography
-
1. North America
- 1.1. United States
- 1.2. Canada
- 1.3. Mexico
-
2. South America
- 2.1. Brazil
- 2.2. Argentina
- 2.3. Rest of South America
-
3. Europe
- 3.1. United Kingdom
- 3.2. Germany
- 3.3. France
- 3.4. Italy
- 3.5. Spain
- 3.6. Russia
- 3.7. Benelux
- 3.8. Nordics
- 3.9. Rest of Europe
-
4. Middle East & Africa
- 4.1. Turkey
- 4.2. Israel
- 4.3. GCC
- 4.4. North Africa
- 4.5. South Africa
- 4.6. Rest of Middle East & Africa
-
5. Asia Pacific
- 5.1. China
- 5.2. India
- 5.3. Japan
- 5.4. South Korea
- 5.5. ASEAN
- 5.6. Oceania
- 5.7. Rest of Asia Pacific
Consumer Decision Software Regional Market Share
Geographic Coverage of Consumer Decision Software
Consumer Decision Software REPORT HIGHLIGHTS
| Aspects | Details |
|---|---|
| Study Period | 2020-2034 |
| Base Year | 2025 |
| Estimated Year | 2026 |
| Forecast Period | 2026-2034 |
| Historical Period | 2020-2025 |
| Growth Rate | CAGR of 10.3% from 2020-2034 |
| Segmentation |
|
Table of Contents
- 1. Introduction
- 1.1. Research Scope
- 1.2. Market Segmentation
- 1.3. Research Objective
- 1.4. Definitions and Assumptions
- 2. Executive Summary
- 2.1. Market Snapshot
- 3. Market Dynamics
- 3.1. Market Drivers
- 3.2. Market Restrains
- 3.3. Market Trends
- 3.4. Market Opportunities
- 4. Market Factor Analysis
- 4.1. Porters Five Forces
- 4.1.1. Bargaining Power of Suppliers
- 4.1.2. Bargaining Power of Buyers
- 4.1.3. Threat of New Entrants
- 4.1.4. Threat of Substitutes
- 4.1.5. Competitive Rivalry
- 4.2. PESTEL analysis
- 4.3. BCG Analysis
- 4.3.1. Stars (High Growth, High Market Share)
- 4.3.2. Cash Cows (Low Growth, High Market Share)
- 4.3.3. Question Mark (High Growth, Low Market Share)
- 4.3.4. Dogs (Low Growth, Low Market Share)
- 4.4. Ansoff Matrix Analysis
- 4.5. Supply Chain Analysis
- 4.6. Regulatory Landscape
- 4.7. Current Market Potential and Opportunity Assessment (TAM–SAM–SOM Framework)
- 4.8. TIR Analyst Note
- 4.1. Porters Five Forces
- 5. Market Analysis, Insights and Forecast 2021-2033
- 5.1. Market Analysis, Insights and Forecast - by Application
- 5.1.1. Enterprise
- 5.1.2. Municipal
- 5.2. Market Analysis, Insights and Forecast - by Type
- 5.2.1. Group Decision Support System
- 5.2.2. Distributed Decision Support System
- 5.2.3. Intelligent Decision Support System
- 5.3. Market Analysis, Insights and Forecast - by Region
- 5.3.1. North America
- 5.3.2. South America
- 5.3.3. Europe
- 5.3.4. Middle East & Africa
- 5.3.5. Asia Pacific
- 5.1. Market Analysis, Insights and Forecast - by Application
- 6. Global Consumer Decision Software Analysis, Insights and Forecast, 2021-2033
- 6.1. Market Analysis, Insights and Forecast - by Application
- 6.1.1. Enterprise
- 6.1.2. Municipal
- 6.2. Market Analysis, Insights and Forecast - by Type
- 6.2.1. Group Decision Support System
- 6.2.2. Distributed Decision Support System
- 6.2.3. Intelligent Decision Support System
- 6.1. Market Analysis, Insights and Forecast - by Application
- 7. North America Consumer Decision Software Analysis, Insights and Forecast, 2020-2032
- 7.1. Market Analysis, Insights and Forecast - by Application
- 7.1.1. Enterprise
- 7.1.2. Municipal
- 7.2. Market Analysis, Insights and Forecast - by Type
- 7.2.1. Group Decision Support System
- 7.2.2. Distributed Decision Support System
- 7.2.3. Intelligent Decision Support System
- 7.1. Market Analysis, Insights and Forecast - by Application
- 8. South America Consumer Decision Software Analysis, Insights and Forecast, 2020-2032
- 8.1. Market Analysis, Insights and Forecast - by Application
- 8.1.1. Enterprise
- 8.1.2. Municipal
- 8.2. Market Analysis, Insights and Forecast - by Type
- 8.2.1. Group Decision Support System
- 8.2.2. Distributed Decision Support System
- 8.2.3. Intelligent Decision Support System
- 8.1. Market Analysis, Insights and Forecast - by Application
- 9. Europe Consumer Decision Software Analysis, Insights and Forecast, 2020-2032
- 9.1. Market Analysis, Insights and Forecast - by Application
- 9.1.1. Enterprise
- 9.1.2. Municipal
- 9.2. Market Analysis, Insights and Forecast - by Type
- 9.2.1. Group Decision Support System
- 9.2.2. Distributed Decision Support System
- 9.2.3. Intelligent Decision Support System
- 9.1. Market Analysis, Insights and Forecast - by Application
- 10. Middle East & Africa Consumer Decision Software Analysis, Insights and Forecast, 2020-2032
- 10.1. Market Analysis, Insights and Forecast - by Application
- 10.1.1. Enterprise
- 10.1.2. Municipal
- 10.2. Market Analysis, Insights and Forecast - by Type
- 10.2.1. Group Decision Support System
- 10.2.2. Distributed Decision Support System
- 10.2.3. Intelligent Decision Support System
- 10.1. Market Analysis, Insights and Forecast - by Application
- 11. Asia Pacific Consumer Decision Software Analysis, Insights and Forecast, 2020-2032
- 11.1. Market Analysis, Insights and Forecast - by Application
- 11.1.1. Enterprise
- 11.1.2. Municipal
- 11.2. Market Analysis, Insights and Forecast - by Type
- 11.2.1. Group Decision Support System
- 11.2.2. Distributed Decision Support System
- 11.2.3. Intelligent Decision Support System
- 11.1. Market Analysis, Insights and Forecast - by Application
- 12. Competitive Analysis
- 12.1. Company Profiles
- 12.1.1 Paramount Decisions
- 12.1.1.1. Company Overview
- 12.1.1.2. Products
- 12.1.1.3. Company Financials
- 12.1.1.4. SWOT Analysis
- 12.1.2 Tribium Software
- 12.1.2.1. Company Overview
- 12.1.2.2. Products
- 12.1.2.3. Company Financials
- 12.1.2.4. SWOT Analysis
- 12.1.3 Palisade
- 12.1.3.1. Company Overview
- 12.1.3.2. Products
- 12.1.3.3. Company Financials
- 12.1.3.4. SWOT Analysis
- 12.1.4 Banxia Software
- 12.1.4.1. Company Overview
- 12.1.4.2. Products
- 12.1.4.3. Company Financials
- 12.1.4.4. SWOT Analysis
- 12.1.5 CampaignGO
- 12.1.5.1. Company Overview
- 12.1.5.2. Products
- 12.1.5.3. Company Financials
- 12.1.5.4. SWOT Analysis
- 12.1.6 Defense Group
- 12.1.6.1. Company Overview
- 12.1.6.2. Products
- 12.1.6.3. Company Financials
- 12.1.6.4. SWOT Analysis
- 12.1.7 Dataland Software
- 12.1.7.1. Company Overview
- 12.1.7.2. Products
- 12.1.7.3. Company Financials
- 12.1.7.4. SWOT Analysis
- 12.1.8 SAP
- 12.1.8.1. Company Overview
- 12.1.8.2. Products
- 12.1.8.3. Company Financials
- 12.1.8.4. SWOT Analysis
- 12.1.9 Qlik
- 12.1.9.1. Company Overview
- 12.1.9.2. Products
- 12.1.9.3. Company Financials
- 12.1.9.4. SWOT Analysis
- 12.1.10 Information Builders
- 12.1.10.1. Company Overview
- 12.1.10.2. Products
- 12.1.10.3. Company Financials
- 12.1.10.4. SWOT Analysis
- 12.1.11 Parmenides
- 12.1.11.1. Company Overview
- 12.1.11.2. Products
- 12.1.11.3. Company Financials
- 12.1.11.4. SWOT Analysis
- 12.1.12 TIBCO Software
- 12.1.12.1. Company Overview
- 12.1.12.2. Products
- 12.1.12.3. Company Financials
- 12.1.12.4. SWOT Analysis
- 12.1.13 Riskturn
- 12.1.13.1. Company Overview
- 12.1.13.2. Products
- 12.1.13.3. Company Financials
- 12.1.13.4. SWOT Analysis
- 12.1.1 Paramount Decisions
- 12.2. Market Entropy
- 12.2.1 Company's Key Areas Served
- 12.2.2 Recent Developments
- 12.3. Company Market Share Analysis 2025
- 12.3.1 Top 5 Companies Market Share Analysis
- 12.3.2 Top 3 Companies Market Share Analysis
- 12.4. List of Potential Customers
- 13. Research Methodology
List of Figures
- Figure 1: Global Consumer Decision Software Revenue Breakdown (billion, %) by Region 2025 & 2033
- Figure 2: North America Consumer Decision Software Revenue (billion), by Application 2025 & 2033
- Figure 3: North America Consumer Decision Software Revenue Share (%), by Application 2025 & 2033
- Figure 4: North America Consumer Decision Software Revenue (billion), by Type 2025 & 2033
- Figure 5: North America Consumer Decision Software Revenue Share (%), by Type 2025 & 2033
- Figure 6: North America Consumer Decision Software Revenue (billion), by Country 2025 & 2033
- Figure 7: North America Consumer Decision Software Revenue Share (%), by Country 2025 & 2033
- Figure 8: South America Consumer Decision Software Revenue (billion), by Application 2025 & 2033
- Figure 9: South America Consumer Decision Software Revenue Share (%), by Application 2025 & 2033
- Figure 10: South America Consumer Decision Software Revenue (billion), by Type 2025 & 2033
- Figure 11: South America Consumer Decision Software Revenue Share (%), by Type 2025 & 2033
- Figure 12: South America Consumer Decision Software Revenue (billion), by Country 2025 & 2033
- Figure 13: South America Consumer Decision Software Revenue Share (%), by Country 2025 & 2033
- Figure 14: Europe Consumer Decision Software Revenue (billion), by Application 2025 & 2033
- Figure 15: Europe Consumer Decision Software Revenue Share (%), by Application 2025 & 2033
- Figure 16: Europe Consumer Decision Software Revenue (billion), by Type 2025 & 2033
- Figure 17: Europe Consumer Decision Software Revenue Share (%), by Type 2025 & 2033
- Figure 18: Europe Consumer Decision Software Revenue (billion), by Country 2025 & 2033
- Figure 19: Europe Consumer Decision Software Revenue Share (%), by Country 2025 & 2033
- Figure 20: Middle East & Africa Consumer Decision Software Revenue (billion), by Application 2025 & 2033
- Figure 21: Middle East & Africa Consumer Decision Software Revenue Share (%), by Application 2025 & 2033
- Figure 22: Middle East & Africa Consumer Decision Software Revenue (billion), by Type 2025 & 2033
- Figure 23: Middle East & Africa Consumer Decision Software Revenue Share (%), by Type 2025 & 2033
- Figure 24: Middle East & Africa Consumer Decision Software Revenue (billion), by Country 2025 & 2033
- Figure 25: Middle East & Africa Consumer Decision Software Revenue Share (%), by Country 2025 & 2033
- Figure 26: Asia Pacific Consumer Decision Software Revenue (billion), by Application 2025 & 2033
- Figure 27: Asia Pacific Consumer Decision Software Revenue Share (%), by Application 2025 & 2033
- Figure 28: Asia Pacific Consumer Decision Software Revenue (billion), by Type 2025 & 2033
- Figure 29: Asia Pacific Consumer Decision Software Revenue Share (%), by Type 2025 & 2033
- Figure 30: Asia Pacific Consumer Decision Software Revenue (billion), by Country 2025 & 2033
- Figure 31: Asia Pacific Consumer Decision Software Revenue Share (%), by Country 2025 & 2033
List of Tables
- Table 1: Global Consumer Decision Software Revenue billion Forecast, by Application 2020 & 2033
- Table 2: Global Consumer Decision Software Revenue billion Forecast, by Type 2020 & 2033
- Table 3: Global Consumer Decision Software Revenue billion Forecast, by Region 2020 & 2033
- Table 4: Global Consumer Decision Software Revenue billion Forecast, by Application 2020 & 2033
- Table 5: Global Consumer Decision Software Revenue billion Forecast, by Type 2020 & 2033
- Table 6: Global Consumer Decision Software Revenue billion Forecast, by Country 2020 & 2033
- Table 7: United States Consumer Decision Software Revenue (billion) Forecast, by Application 2020 & 2033
- Table 8: Canada Consumer Decision Software Revenue (billion) Forecast, by Application 2020 & 2033
- Table 9: Mexico Consumer Decision Software Revenue (billion) Forecast, by Application 2020 & 2033
- Table 10: Global Consumer Decision Software Revenue billion Forecast, by Application 2020 & 2033
- Table 11: Global Consumer Decision Software Revenue billion Forecast, by Type 2020 & 2033
- Table 12: Global Consumer Decision Software Revenue billion Forecast, by Country 2020 & 2033
- Table 13: Brazil Consumer Decision Software Revenue (billion) Forecast, by Application 2020 & 2033
- Table 14: Argentina Consumer Decision Software Revenue (billion) Forecast, by Application 2020 & 2033
- Table 15: Rest of South America Consumer Decision Software Revenue (billion) Forecast, by Application 2020 & 2033
- Table 16: Global Consumer Decision Software Revenue billion Forecast, by Application 2020 & 2033
- Table 17: Global Consumer Decision Software Revenue billion Forecast, by Type 2020 & 2033
- Table 18: Global Consumer Decision Software Revenue billion Forecast, by Country 2020 & 2033
- Table 19: United Kingdom Consumer Decision Software Revenue (billion) Forecast, by Application 2020 & 2033
- Table 20: Germany Consumer Decision Software Revenue (billion) Forecast, by Application 2020 & 2033
- Table 21: France Consumer Decision Software Revenue (billion) Forecast, by Application 2020 & 2033
- Table 22: Italy Consumer Decision Software Revenue (billion) Forecast, by Application 2020 & 2033
- Table 23: Spain Consumer Decision Software Revenue (billion) Forecast, by Application 2020 & 2033
- Table 24: Russia Consumer Decision Software Revenue (billion) Forecast, by Application 2020 & 2033
- Table 25: Benelux Consumer Decision Software Revenue (billion) Forecast, by Application 2020 & 2033
- Table 26: Nordics Consumer Decision Software Revenue (billion) Forecast, by Application 2020 & 2033
- Table 27: Rest of Europe Consumer Decision Software Revenue (billion) Forecast, by Application 2020 & 2033
- Table 28: Global Consumer Decision Software Revenue billion Forecast, by Application 2020 & 2033
- Table 29: Global Consumer Decision Software Revenue billion Forecast, by Type 2020 & 2033
- Table 30: Global Consumer Decision Software Revenue billion Forecast, by Country 2020 & 2033
- Table 31: Turkey Consumer Decision Software Revenue (billion) Forecast, by Application 2020 & 2033
- Table 32: Israel Consumer Decision Software Revenue (billion) Forecast, by Application 2020 & 2033
- Table 33: GCC Consumer Decision Software Revenue (billion) Forecast, by Application 2020 & 2033
- Table 34: North Africa Consumer Decision Software Revenue (billion) Forecast, by Application 2020 & 2033
- Table 35: South Africa Consumer Decision Software Revenue (billion) Forecast, by Application 2020 & 2033
- Table 36: Rest of Middle East & Africa Consumer Decision Software Revenue (billion) Forecast, by Application 2020 & 2033
- Table 37: Global Consumer Decision Software Revenue billion Forecast, by Application 2020 & 2033
- Table 38: Global Consumer Decision Software Revenue billion Forecast, by Type 2020 & 2033
- Table 39: Global Consumer Decision Software Revenue billion Forecast, by Country 2020 & 2033
- Table 40: China Consumer Decision Software Revenue (billion) Forecast, by Application 2020 & 2033
- Table 41: India Consumer Decision Software Revenue (billion) Forecast, by Application 2020 & 2033
- Table 42: Japan Consumer Decision Software Revenue (billion) Forecast, by Application 2020 & 2033
- Table 43: South Korea Consumer Decision Software Revenue (billion) Forecast, by Application 2020 & 2033
- Table 44: ASEAN Consumer Decision Software Revenue (billion) Forecast, by Application 2020 & 2033
- Table 45: Oceania Consumer Decision Software Revenue (billion) Forecast, by Application 2020 & 2033
- Table 46: Rest of Asia Pacific Consumer Decision Software Revenue (billion) Forecast, by Application 2020 & 2033
Frequently Asked Questions
1. What is the projected Compound Annual Growth Rate (CAGR) of the Consumer Decision Software?
The projected CAGR is approximately 10.3%.
2. Which companies are prominent players in the Consumer Decision Software?
Key companies in the market include Paramount Decisions, Tribium Software, Palisade, Banxia Software, CampaignGO, Defense Group, Dataland Software, SAP, Qlik, Information Builders, Parmenides, TIBCO Software, Riskturn.
3. What are the main segments of the Consumer Decision Software?
The market segments include Application, Type.
4. Can you provide details about the market size?
The market size is estimated to be USD 12.4 billion as of 2022.
5. What are some drivers contributing to market growth?
N/A
6. What are the notable trends driving market growth?
N/A
7. Are there any restraints impacting market growth?
N/A
8. Can you provide examples of recent developments in the market?
N/A
9. What pricing options are available for accessing the report?
Pricing options include single-user, multi-user, and enterprise licenses priced at USD 3950.00, USD 5925.00, and USD 7900.00 respectively.
10. Is the market size provided in terms of value or volume?
The market size is provided in terms of value, measured in billion.
11. Are there any specific market keywords associated with the report?
Yes, the market keyword associated with the report is "Consumer Decision Software," which aids in identifying and referencing the specific market segment covered.
12. How do I determine which pricing option suits my needs best?
The pricing options vary based on user requirements and access needs. Individual users may opt for single-user licenses, while businesses requiring broader access may choose multi-user or enterprise licenses for cost-effective access to the report.
13. Are there any additional resources or data provided in the Consumer Decision Software report?
While the report offers comprehensive insights, it's advisable to review the specific contents or supplementary materials provided to ascertain if additional resources or data are available.
14. How can I stay updated on further developments or reports in the Consumer Decision Software?
To stay informed about further developments, trends, and reports in the Consumer Decision Software, consider subscribing to industry newsletters, following relevant companies and organizations, or regularly checking reputable industry news sources and publications.
Methodology
Step 1 - Identification of Relevant Samples Size from Population Database


Step 2 - Approaches for Defining Global Market Size (Value, Volume* & Price*)

Note*: In applicable scenarios
Step 3 - Data Sources
Primary Research
- Web Analytics
- Survey Reports
- Research Institute
- Latest Research Reports
- Opinion Leaders
Secondary Research
- Annual Reports
- White Paper
- Latest Press Release
- Industry Association
- Paid Database
- Investor Presentations

Step 4 - Data Triangulation
Involves using different sources of information in order to increase the validity of a study
These sources are likely to be stakeholders in a program - participants, other researchers, program staff, other community members, and so on.
Then we put all data in single framework & apply various statistical tools to find out the dynamic on the market.
During the analysis stage, feedback from the stakeholder groups would be compared to determine areas of agreement as well as areas of divergence