

Key Insights
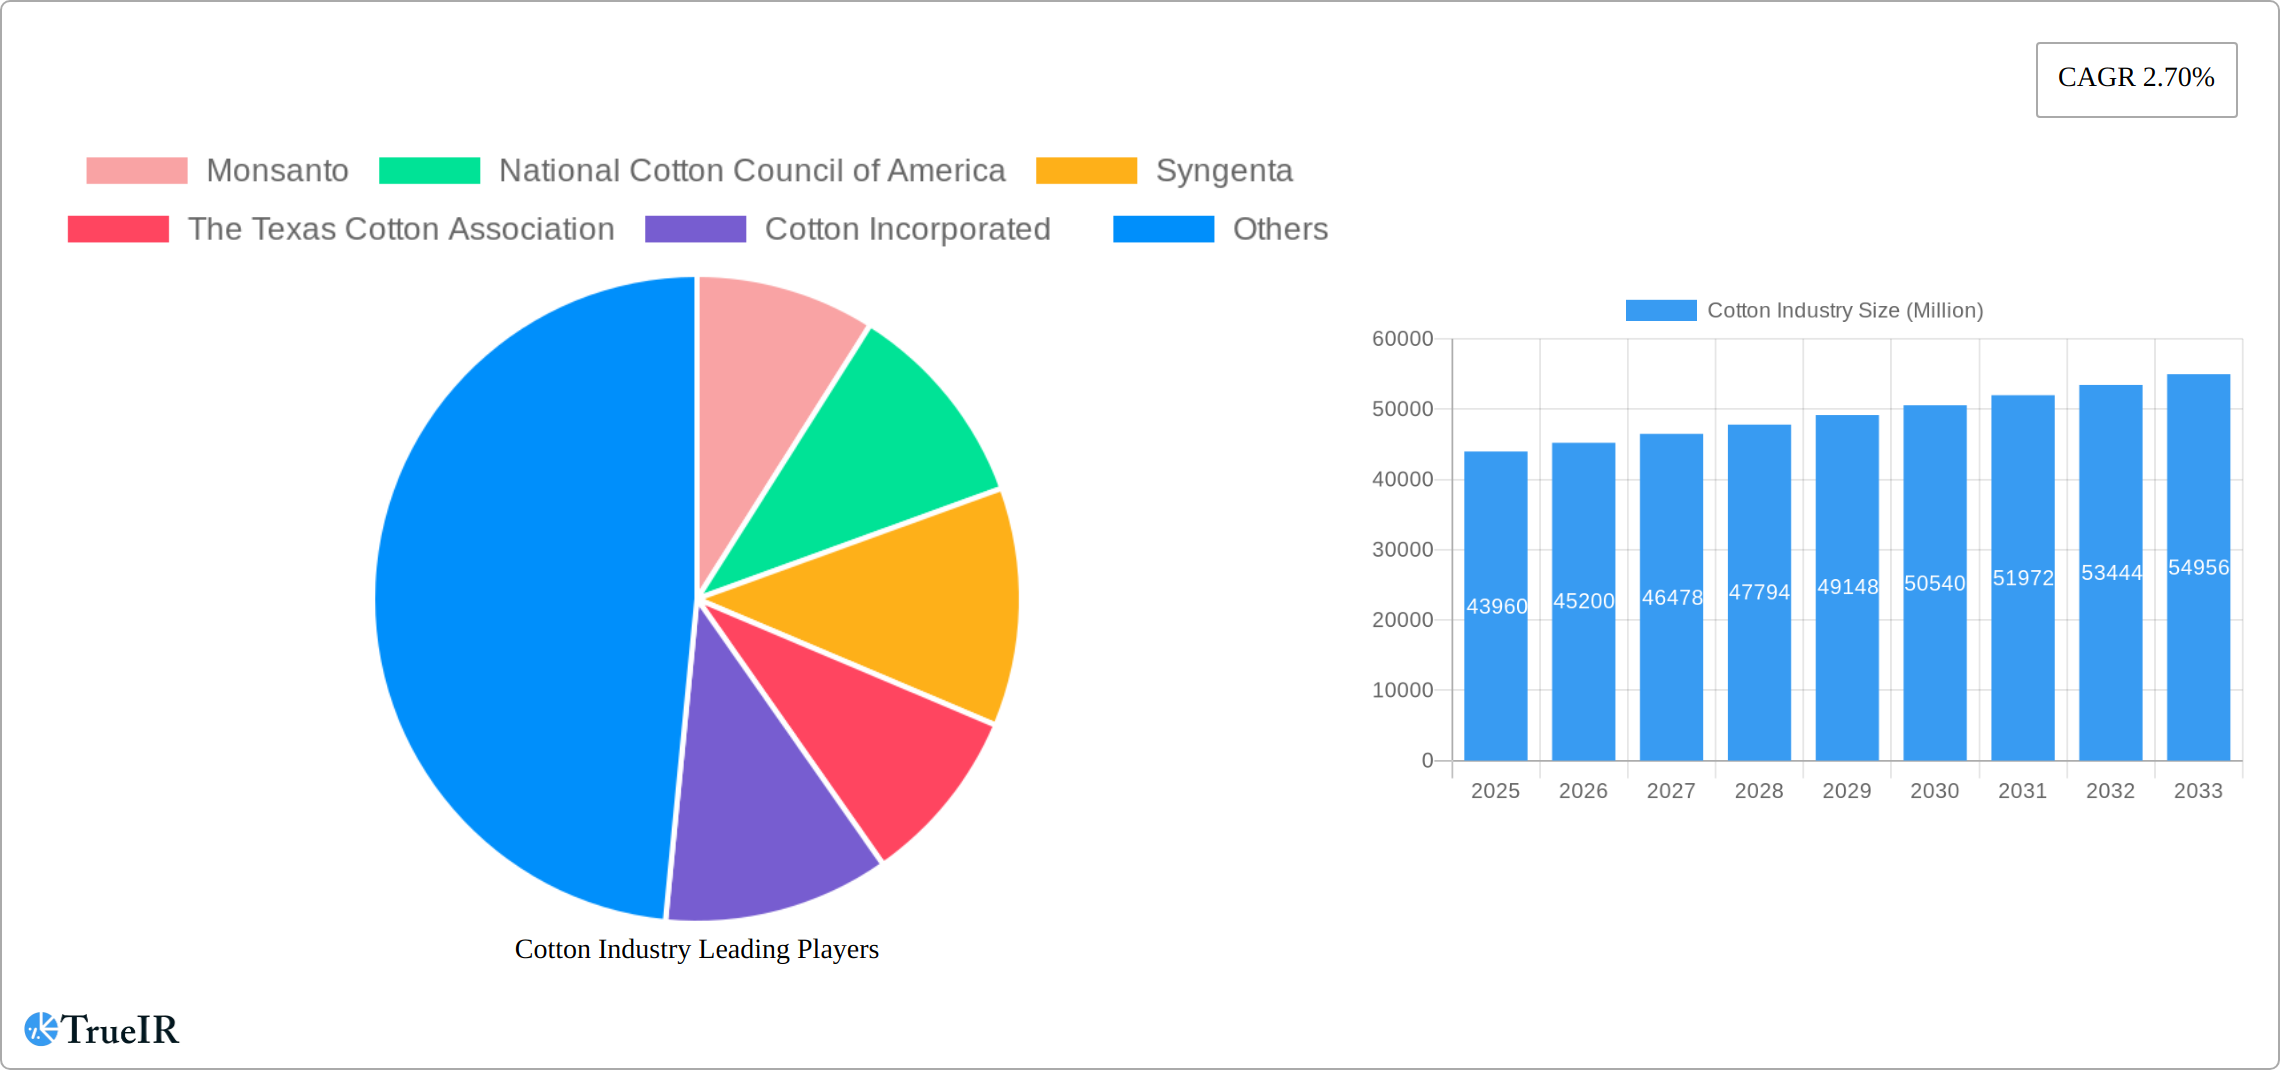
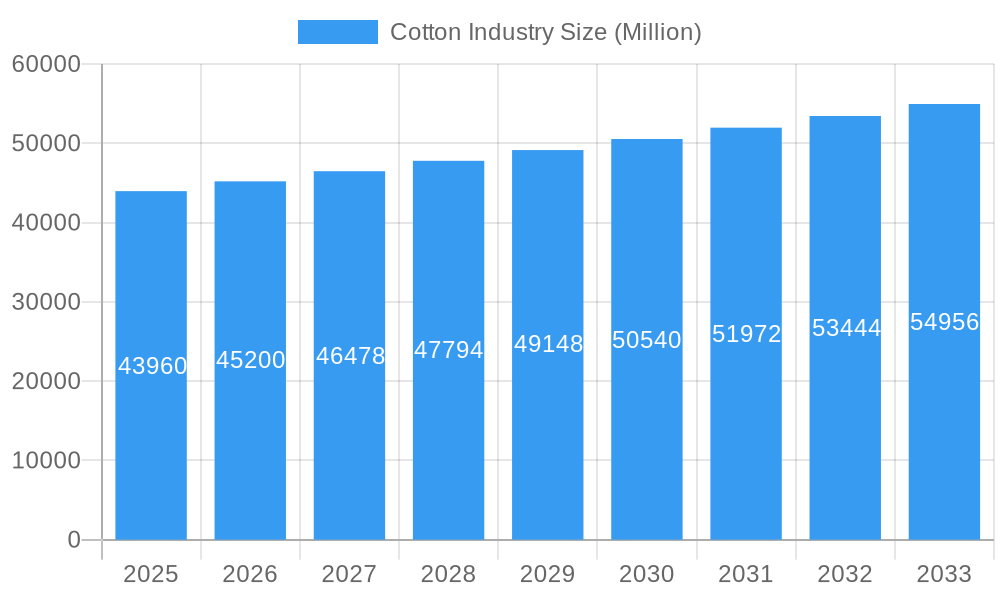
The global cotton industry, valued at $43.96 billion in 2025, is projected to experience steady growth, driven by increasing demand from the apparel and home textiles sectors. A compound annual growth rate (CAGR) of 2.70% from 2025 to 2033 indicates a consistent, albeit moderate, expansion of the market. Key drivers include rising global populations fueling clothing consumption, the growth of fast fashion, and the increasing popularity of cotton-based home furnishings. However, the industry faces challenges like fluctuating cotton prices due to weather patterns and global trade policies, as well as increasing competition from synthetic fibers like polyester. Market segmentation reveals that long-staple cotton, favored for its superior quality and strength, commands a premium price, while the Strict Middling (SM) grade represents a significant portion of overall volume due to its balance of quality and affordability. The white cotton segment dominates the color market, owing to its versatility and suitability for various applications. Geographically, Asia-Pacific, particularly China and India, represents the largest consumer market, driven by strong domestic textile industries and a large population base. North America and Europe also maintain significant market shares, though growth may be influenced by factors like regional economic conditions and consumer preferences. Major players like Monsanto, Syngenta, and Bayer CropScience are actively involved in research and development to enhance cotton yield, quality, and pest resistance, contributing to the industry's long-term sustainability.
Cotton Industry Market Size (In Billion)
The forecast period (2025-2033) anticipates continued expansion, albeit potentially at a slightly fluctuating rate depending on global economic conditions and evolving consumer trends. The ongoing shift toward sustainable and ethically sourced cotton is expected to influence market dynamics, favoring producers committed to environmentally friendly practices and fair labor standards. Furthermore, advancements in textile technology, including innovations in spinning and weaving processes, will shape the future of the cotton industry. This necessitates a strategic approach by industry players to adapt to evolving market demands and maintain competitiveness in the face of global uncertainties. Growth in specific segments, such as high-quality long-staple cotton for premium apparel, might outpace the overall market average.
Cotton Industry Company Market Share
Dynamic Cotton Industry Market Report: 2019-2033
This comprehensive report provides an in-depth analysis of the global cotton industry, encompassing market size, segmentation, competitive landscape, and future growth projections. The study period spans from 2019 to 2033, with a base year of 2025 and a forecast period of 2025-2033. Leveraging extensive data and insights, this report is an indispensable resource for industry stakeholders, investors, and researchers seeking to navigate the complexities and opportunities within this vital sector. The report uses data in Millions.
Cotton Industry Market Structure & Competitive Landscape
The global cotton industry is characterized by a moderately concentrated market structure, with several key players holding significant market share. Concentration ratios, while varying across segments, indicate a moderate level of competition. Innovation, driven by advancements in seed technology, genetic modification, and sustainable farming practices, plays a crucial role in shaping market dynamics. Regulatory impacts, including trade policies and environmental regulations, significantly influence production costs and market access. Product substitutes, such as synthetic fibers, pose a continuous competitive threat, requiring the cotton industry to adapt and innovate. End-user segmentation, predominantly apparel, home textiles, and industrial applications, shapes demand patterns. M&A activity (estimated at xx Million USD in value during the historical period) has been moderate, primarily focused on consolidating seed technology and enhancing supply chain efficiency. The landscape also features a substantial number of smaller-scale producers, particularly in developing countries.
- Key Players: Monsanto, National Cotton Council of America, Syngenta, The Texas Cotton Association, Cotton Incorporated, International Cotton Association, Bayer CropScience
- Concentration Ratio (CR4): xx% (Estimated)
- M&A Volume (2019-2024): xx Million USD (Estimated)
Cotton Industry Market Trends & Opportunities
The global cotton market demonstrates robust growth, driven by increasing global textile demand and continuous innovation in cotton production and processing. The Compound Annual Growth Rate (CAGR) for the forecast period (2025-2033) is estimated at xx%, fueled by the increasing popularity of sustainable and organic cotton. Technological advancements such as precision agriculture and improved irrigation techniques enhance yield and quality. Consumer preferences are increasingly shifting towards sustainably sourced and ethically produced cotton, creating new opportunities for organic and certified cotton. The market continues to face competitive pressures from synthetic fibers, but the inherent properties of cotton, such as breathability and comfort, maintain its strong position in various applications. Market penetration rates for organic cotton are steadily rising, indicating a growing consumer awareness. The total market size is predicted to reach xx Million USD by 2033.
Dominant Markets & Segments in Cotton Industry
The global cotton industry is a complex and dynamic market, with several key players and segments driving its growth. India and China remain the leading producers, accounting for a substantial portion of global output. However, other significant contributors include the USA, Brazil, Australia, and several African nations, each with unique production characteristics and market focuses. Within the fiber market, medium-staple cotton maintains its dominance due to its versatility and cost-effectiveness, particularly in the apparel sector. Strict Middling (SM) grade remains the most prevalent quality grade traded globally, striking a balance between quality and affordability. While white cotton continues to dominate the color segment, the demand for colored cotton is steadily rising, particularly in specialized niche markets like organic and sustainable apparel. Apparel manufacturing continues to be the largest end-use sector, although other significant applications include home furnishings, industrial textiles, and medical products.
- Leading Regions: India, China, USA, Brazil, Australia, key African nations
- Dominant Fiber Length: Medium-staple
- Dominant Grade: Strict Middling (SM)
- Dominant Color: White, with increasing demand for colored cotton
- Dominant End-Use: Apparel, followed by home furnishings, industrial textiles, and medical products.
Key Growth Drivers:
- India: Government initiatives focused on sustainable cotton production, farmer support programs, and technological advancements.
- China: Expansion of the domestic textile industry, rising disposable incomes, and increasing demand for high-quality cotton products.
- USA: Technological advancements in seed technology, irrigation, and precision agriculture, coupled with ongoing research into improved cotton varieties.
- Global Trends: Growing consumer demand for sustainable and ethically sourced cotton, driving innovation in organic and recycled cotton production.
Cotton Industry Product Analysis
The cotton industry is characterized by ongoing innovation aimed at improving fiber quality, yield, and sustainability. Genetically modified (GM) cotton varieties, offering enhanced pest resistance and improved fiber characteristics, hold a significant market share. However, there's a concurrent surge in demand for organic cotton and other sustainably produced alternatives, driven by increasing consumer awareness of environmental and social issues. These innovations are not only enhancing the quality of cotton but also bolstering its competitiveness against synthetic fibers. The development of new cotton varieties with superior properties, including longer fiber length, improved strength, and enhanced color retention, provides further competitive advantages in the global market. This ongoing focus on quality, sustainability, and innovation continues to shape the future of the cotton industry.
Key Drivers, Barriers & Challenges in Cotton Industry
Key Drivers:
- Technological advancements in seed technology and farming practices leading to increased yields and quality.
- Rising global demand for textiles, particularly in developing economies.
- Government initiatives and subsidies promoting cotton cultivation in several countries.
Challenges:
- Fluctuations in cotton prices due to weather patterns and global market dynamics. Estimated impact on market growth is xx% decrease in years with extreme weather events.
- The competition from synthetic fibers which are more cost-effective in some applications.
- Supply chain disruptions and logistical challenges impacting the timely delivery of raw cotton.
- Regulatory hurdles concerning the use of genetically modified cotton and environmental regulations on pesticide use.
Growth Drivers in the Cotton Industry Market
The cotton industry's growth is fueled by a confluence of factors, including technological advancements in farming practices and processing techniques; rising global disposable incomes, leading to increased demand for textiles and apparel; and sustained government support for cotton production and research in key cotton-producing regions. Furthermore, the growing consumer preference for sustainable and ethically produced cotton is a significant driver of innovation and market expansion.
Challenges Impacting Cotton Industry Growth
The cotton industry faces several challenges that impact its growth trajectory. Climate change poses a significant threat, impacting yields and production stability in vulnerable regions. Intense competition from synthetic fibers, offering lower costs and varied properties, necessitates continuous improvement in cotton's value proposition. The inherent volatility of global cotton prices creates uncertainty for producers and businesses across the supply chain, impacting investment decisions and profitability. Finally, ensuring ethical sourcing and fair labor practices throughout the supply chain remains a crucial challenge that needs to be addressed for long-term sustainability.
Key Players Shaping the Cotton Industry Market
- Bayer Crop Science (formerly Monsanto)
- National Cotton Council of America
- Syngenta
- The Texas Cotton Association
- Cotton Incorporated
- International Cotton Association
- Bayer CropScience
- Numerous other regional and international cotton producer associations and cooperatives.
Significant Cotton Industry Milestones
- September 2022: Two new organic cotton varieties are introduced to Indian farmers, boosting sustainable cotton production.
- August 2022: Several major apparel brands join the Organic Cotton Accelerator, supporting the growth of organic cotton.
- March 2022: Armor seed company launches two new cotton varieties with improved fiber quality and XtendFlex Technology.
Future Outlook for Cotton Industry Market
The cotton industry is poised for continued growth, driven by innovation, sustainability initiatives, and rising global demand. Strategic opportunities exist in developing organic and sustainable cotton solutions, improving supply chain efficiency, and enhancing the overall quality of cotton products. The market is expected to witness increased consolidation and further technological advancements, leading to a more efficient and sustainable industry.
Cotton Industry Segmentation
- 1. Production Analysis
- 2. Consumption Analysis
- 3. Import Market Analysis (Value & Volume)
- 4. Export Market Analysis (Value & Volume)
- 5. Price Trend Analysis
Cotton Industry Segmentation By Geography
-
1. North America
- 1.1. United States
- 1.2. Canada
- 1.3. Mexico
-
2. Europe
- 2.1. Germany
- 2.2. France
- 2.3. Russia
- 2.4. Greece
- 2.5. Italy
-
3. Asia Pacific
- 3.1. China
- 3.2. India
- 3.3. Australia
- 3.4. Pakistan
- 3.5. Bangladesh
-
4. South America
- 4.1. Brazil
- 4.2. Argentina
- 5. Middle East
-
6. South Africa
- 6.1. Turkey
- 6.2. Egypt
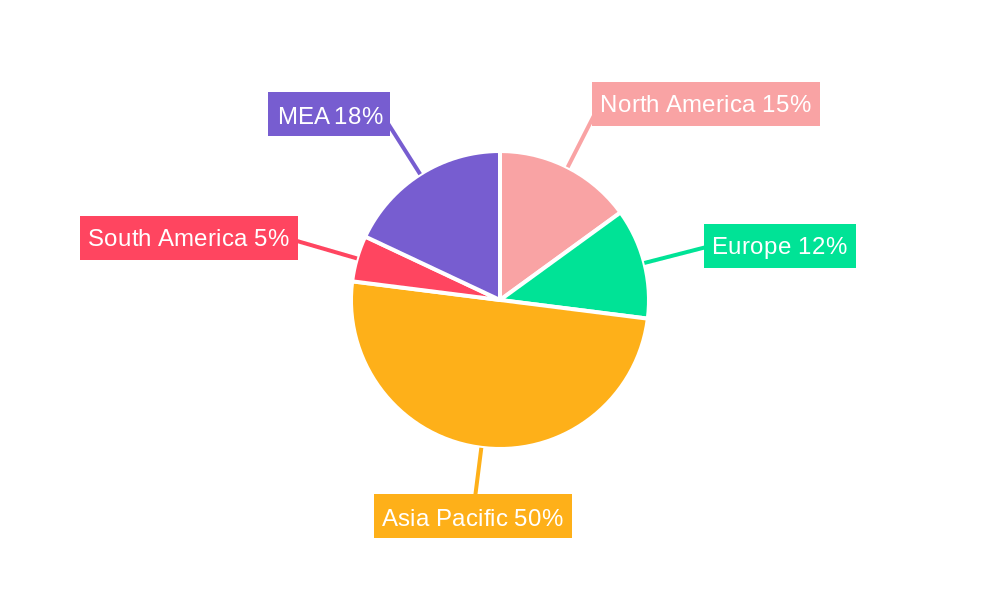
Cotton Industry Regional Market Share
Geographic Coverage of Cotton Industry
Cotton Industry REPORT HIGHLIGHTS
| Aspects | Details |
|---|---|
| Study Period | 2020-2034 |
| Base Year | 2025 |
| Estimated Year | 2026 |
| Forecast Period | 2026-2034 |
| Historical Period | 2020-2025 |
| Growth Rate | CAGR of 2.70% from 2020-2034 |
| Segmentation |
|
Table of Contents
- 1. Introduction
- 1.1. Research Scope
- 1.2. Market Segmentation
- 1.3. Research Methodology
- 1.4. Definitions and Assumptions
- 2. Executive Summary
- 2.1. Introduction
- 3. Market Dynamics
- 3.1. Introduction
- 3.2. Market Drivers
- 3.2.1. Rising Demand for Milled and Broken Rice; Growing Preference for Speciality Rice Variety; Government Initiatives Supports Rice Production
- 3.3. Market Restrains
- 3.3.1. Lack of Supply Chain for Rice; Growing Agricultural Labor Crisis
- 3.4. Market Trends
- 3.4.1. Increasing demand for the cotton exports
- 4. Market Factor Analysis
- 4.1. Porters Five Forces
- 4.2. Supply/Value Chain
- 4.3. PESTEL analysis
- 4.4. Market Entropy
- 4.5. Patent/Trademark Analysis
- 5. Global Cotton Industry Analysis, Insights and Forecast, 2020-2032
- 5.1. Market Analysis, Insights and Forecast - by Production Analysis
- 5.2. Market Analysis, Insights and Forecast - by Consumption Analysis
- 5.3. Market Analysis, Insights and Forecast - by Import Market Analysis (Value & Volume)
- 5.4. Market Analysis, Insights and Forecast - by Export Market Analysis (Value & Volume)
- 5.5. Market Analysis, Insights and Forecast - by Price Trend Analysis
- 5.6. Market Analysis, Insights and Forecast - by Region
- 5.6.1. North America
- 5.6.2. Europe
- 5.6.3. Asia Pacific
- 5.6.4. South America
- 5.6.5. Middle East
- 5.6.6. South Africa
- 5.1. Market Analysis, Insights and Forecast - by Production Analysis
- 6. North America Cotton Industry Analysis, Insights and Forecast, 2020-2032
- 6.1. Market Analysis, Insights and Forecast - by Production Analysis
- 6.2. Market Analysis, Insights and Forecast - by Consumption Analysis
- 6.3. Market Analysis, Insights and Forecast - by Import Market Analysis (Value & Volume)
- 6.4. Market Analysis, Insights and Forecast - by Export Market Analysis (Value & Volume)
- 6.5. Market Analysis, Insights and Forecast - by Price Trend Analysis
- 6.1. Market Analysis, Insights and Forecast - by Production Analysis
- 7. Europe Cotton Industry Analysis, Insights and Forecast, 2020-2032
- 7.1. Market Analysis, Insights and Forecast - by Production Analysis
- 7.2. Market Analysis, Insights and Forecast - by Consumption Analysis
- 7.3. Market Analysis, Insights and Forecast - by Import Market Analysis (Value & Volume)
- 7.4. Market Analysis, Insights and Forecast - by Export Market Analysis (Value & Volume)
- 7.5. Market Analysis, Insights and Forecast - by Price Trend Analysis
- 7.1. Market Analysis, Insights and Forecast - by Production Analysis
- 8. Asia Pacific Cotton Industry Analysis, Insights and Forecast, 2020-2032
- 8.1. Market Analysis, Insights and Forecast - by Production Analysis
- 8.2. Market Analysis, Insights and Forecast - by Consumption Analysis
- 8.3. Market Analysis, Insights and Forecast - by Import Market Analysis (Value & Volume)
- 8.4. Market Analysis, Insights and Forecast - by Export Market Analysis (Value & Volume)
- 8.5. Market Analysis, Insights and Forecast - by Price Trend Analysis
- 8.1. Market Analysis, Insights and Forecast - by Production Analysis
- 9. South America Cotton Industry Analysis, Insights and Forecast, 2020-2032
- 9.1. Market Analysis, Insights and Forecast - by Production Analysis
- 9.2. Market Analysis, Insights and Forecast - by Consumption Analysis
- 9.3. Market Analysis, Insights and Forecast - by Import Market Analysis (Value & Volume)
- 9.4. Market Analysis, Insights and Forecast - by Export Market Analysis (Value & Volume)
- 9.5. Market Analysis, Insights and Forecast - by Price Trend Analysis
- 9.1. Market Analysis, Insights and Forecast - by Production Analysis
- 10. Middle East Cotton Industry Analysis, Insights and Forecast, 2020-2032
- 10.1. Market Analysis, Insights and Forecast - by Production Analysis
- 10.2. Market Analysis, Insights and Forecast - by Consumption Analysis
- 10.3. Market Analysis, Insights and Forecast - by Import Market Analysis (Value & Volume)
- 10.4. Market Analysis, Insights and Forecast - by Export Market Analysis (Value & Volume)
- 10.5. Market Analysis, Insights and Forecast - by Price Trend Analysis
- 10.1. Market Analysis, Insights and Forecast - by Production Analysis
- 11. South Africa Cotton Industry Analysis, Insights and Forecast, 2020-2032
- 11.1. Market Analysis, Insights and Forecast - by Production Analysis
- 11.2. Market Analysis, Insights and Forecast - by Consumption Analysis
- 11.3. Market Analysis, Insights and Forecast - by Import Market Analysis (Value & Volume)
- 11.4. Market Analysis, Insights and Forecast - by Export Market Analysis (Value & Volume)
- 11.5. Market Analysis, Insights and Forecast - by Price Trend Analysis
- 11.1. Market Analysis, Insights and Forecast - by Production Analysis
- 12. Competitive Analysis
- 12.1. Global Market Share Analysis 2025
- 12.2. Company Profiles
- 12.2.1 Monsanto
- 12.2.1.1. Overview
- 12.2.1.2. Products
- 12.2.1.3. SWOT Analysis
- 12.2.1.4. Recent Developments
- 12.2.1.5. Financials (Based on Availability)
- 12.2.2 National Cotton Council of America
- 12.2.2.1. Overview
- 12.2.2.2. Products
- 12.2.2.3. SWOT Analysis
- 12.2.2.4. Recent Developments
- 12.2.2.5. Financials (Based on Availability)
- 12.2.3 Syngenta
- 12.2.3.1. Overview
- 12.2.3.2. Products
- 12.2.3.3. SWOT Analysis
- 12.2.3.4. Recent Developments
- 12.2.3.5. Financials (Based on Availability)
- 12.2.4 The Texas Cotton Association
- 12.2.4.1. Overview
- 12.2.4.2. Products
- 12.2.4.3. SWOT Analysis
- 12.2.4.4. Recent Developments
- 12.2.4.5. Financials (Based on Availability)
- 12.2.5 Cotton Incorporated
- 12.2.5.1. Overview
- 12.2.5.2. Products
- 12.2.5.3. SWOT Analysis
- 12.2.5.4. Recent Developments
- 12.2.5.5. Financials (Based on Availability)
- 12.2.6 International Cotton Association
- 12.2.6.1. Overview
- 12.2.6.2. Products
- 12.2.6.3. SWOT Analysis
- 12.2.6.4. Recent Developments
- 12.2.6.5. Financials (Based on Availability)
- 12.2.7 Bayer CropScience
- 12.2.7.1. Overview
- 12.2.7.2. Products
- 12.2.7.3. SWOT Analysis
- 12.2.7.4. Recent Developments
- 12.2.7.5. Financials (Based on Availability)
- 12.2.1 Monsanto
List of Figures
- Figure 1: Global Cotton Industry Revenue Breakdown (Million, %) by Region 2025 & 2033
- Figure 2: Global Cotton Industry Volume Breakdown (Kiloton, %) by Region 2025 & 2033
- Figure 3: North America Cotton Industry Revenue (Million), by Production Analysis 2025 & 2033
- Figure 4: North America Cotton Industry Volume (Kiloton), by Production Analysis 2025 & 2033
- Figure 5: North America Cotton Industry Revenue Share (%), by Production Analysis 2025 & 2033
- Figure 6: North America Cotton Industry Volume Share (%), by Production Analysis 2025 & 2033
- Figure 7: North America Cotton Industry Revenue (Million), by Consumption Analysis 2025 & 2033
- Figure 8: North America Cotton Industry Volume (Kiloton), by Consumption Analysis 2025 & 2033
- Figure 9: North America Cotton Industry Revenue Share (%), by Consumption Analysis 2025 & 2033
- Figure 10: North America Cotton Industry Volume Share (%), by Consumption Analysis 2025 & 2033
- Figure 11: North America Cotton Industry Revenue (Million), by Import Market Analysis (Value & Volume) 2025 & 2033
- Figure 12: North America Cotton Industry Volume (Kiloton), by Import Market Analysis (Value & Volume) 2025 & 2033
- Figure 13: North America Cotton Industry Revenue Share (%), by Import Market Analysis (Value & Volume) 2025 & 2033
- Figure 14: North America Cotton Industry Volume Share (%), by Import Market Analysis (Value & Volume) 2025 & 2033
- Figure 15: North America Cotton Industry Revenue (Million), by Export Market Analysis (Value & Volume) 2025 & 2033
- Figure 16: North America Cotton Industry Volume (Kiloton), by Export Market Analysis (Value & Volume) 2025 & 2033
- Figure 17: North America Cotton Industry Revenue Share (%), by Export Market Analysis (Value & Volume) 2025 & 2033
- Figure 18: North America Cotton Industry Volume Share (%), by Export Market Analysis (Value & Volume) 2025 & 2033
- Figure 19: North America Cotton Industry Revenue (Million), by Price Trend Analysis 2025 & 2033
- Figure 20: North America Cotton Industry Volume (Kiloton), by Price Trend Analysis 2025 & 2033
- Figure 21: North America Cotton Industry Revenue Share (%), by Price Trend Analysis 2025 & 2033
- Figure 22: North America Cotton Industry Volume Share (%), by Price Trend Analysis 2025 & 2033
- Figure 23: North America Cotton Industry Revenue (Million), by Country 2025 & 2033
- Figure 24: North America Cotton Industry Volume (Kiloton), by Country 2025 & 2033
- Figure 25: North America Cotton Industry Revenue Share (%), by Country 2025 & 2033
- Figure 26: North America Cotton Industry Volume Share (%), by Country 2025 & 2033
- Figure 27: Europe Cotton Industry Revenue (Million), by Production Analysis 2025 & 2033
- Figure 28: Europe Cotton Industry Volume (Kiloton), by Production Analysis 2025 & 2033
- Figure 29: Europe Cotton Industry Revenue Share (%), by Production Analysis 2025 & 2033
- Figure 30: Europe Cotton Industry Volume Share (%), by Production Analysis 2025 & 2033
- Figure 31: Europe Cotton Industry Revenue (Million), by Consumption Analysis 2025 & 2033
- Figure 32: Europe Cotton Industry Volume (Kiloton), by Consumption Analysis 2025 & 2033
- Figure 33: Europe Cotton Industry Revenue Share (%), by Consumption Analysis 2025 & 2033
- Figure 34: Europe Cotton Industry Volume Share (%), by Consumption Analysis 2025 & 2033
- Figure 35: Europe Cotton Industry Revenue (Million), by Import Market Analysis (Value & Volume) 2025 & 2033
- Figure 36: Europe Cotton Industry Volume (Kiloton), by Import Market Analysis (Value & Volume) 2025 & 2033
- Figure 37: Europe Cotton Industry Revenue Share (%), by Import Market Analysis (Value & Volume) 2025 & 2033
- Figure 38: Europe Cotton Industry Volume Share (%), by Import Market Analysis (Value & Volume) 2025 & 2033
- Figure 39: Europe Cotton Industry Revenue (Million), by Export Market Analysis (Value & Volume) 2025 & 2033
- Figure 40: Europe Cotton Industry Volume (Kiloton), by Export Market Analysis (Value & Volume) 2025 & 2033
- Figure 41: Europe Cotton Industry Revenue Share (%), by Export Market Analysis (Value & Volume) 2025 & 2033
- Figure 42: Europe Cotton Industry Volume Share (%), by Export Market Analysis (Value & Volume) 2025 & 2033
- Figure 43: Europe Cotton Industry Revenue (Million), by Price Trend Analysis 2025 & 2033
- Figure 44: Europe Cotton Industry Volume (Kiloton), by Price Trend Analysis 2025 & 2033
- Figure 45: Europe Cotton Industry Revenue Share (%), by Price Trend Analysis 2025 & 2033
- Figure 46: Europe Cotton Industry Volume Share (%), by Price Trend Analysis 2025 & 2033
- Figure 47: Europe Cotton Industry Revenue (Million), by Country 2025 & 2033
- Figure 48: Europe Cotton Industry Volume (Kiloton), by Country 2025 & 2033
- Figure 49: Europe Cotton Industry Revenue Share (%), by Country 2025 & 2033
- Figure 50: Europe Cotton Industry Volume Share (%), by Country 2025 & 2033
- Figure 51: Asia Pacific Cotton Industry Revenue (Million), by Production Analysis 2025 & 2033
- Figure 52: Asia Pacific Cotton Industry Volume (Kiloton), by Production Analysis 2025 & 2033
- Figure 53: Asia Pacific Cotton Industry Revenue Share (%), by Production Analysis 2025 & 2033
- Figure 54: Asia Pacific Cotton Industry Volume Share (%), by Production Analysis 2025 & 2033
- Figure 55: Asia Pacific Cotton Industry Revenue (Million), by Consumption Analysis 2025 & 2033
- Figure 56: Asia Pacific Cotton Industry Volume (Kiloton), by Consumption Analysis 2025 & 2033
- Figure 57: Asia Pacific Cotton Industry Revenue Share (%), by Consumption Analysis 2025 & 2033
- Figure 58: Asia Pacific Cotton Industry Volume Share (%), by Consumption Analysis 2025 & 2033
- Figure 59: Asia Pacific Cotton Industry Revenue (Million), by Import Market Analysis (Value & Volume) 2025 & 2033
- Figure 60: Asia Pacific Cotton Industry Volume (Kiloton), by Import Market Analysis (Value & Volume) 2025 & 2033
- Figure 61: Asia Pacific Cotton Industry Revenue Share (%), by Import Market Analysis (Value & Volume) 2025 & 2033
- Figure 62: Asia Pacific Cotton Industry Volume Share (%), by Import Market Analysis (Value & Volume) 2025 & 2033
- Figure 63: Asia Pacific Cotton Industry Revenue (Million), by Export Market Analysis (Value & Volume) 2025 & 2033
- Figure 64: Asia Pacific Cotton Industry Volume (Kiloton), by Export Market Analysis (Value & Volume) 2025 & 2033
- Figure 65: Asia Pacific Cotton Industry Revenue Share (%), by Export Market Analysis (Value & Volume) 2025 & 2033
- Figure 66: Asia Pacific Cotton Industry Volume Share (%), by Export Market Analysis (Value & Volume) 2025 & 2033
- Figure 67: Asia Pacific Cotton Industry Revenue (Million), by Price Trend Analysis 2025 & 2033
- Figure 68: Asia Pacific Cotton Industry Volume (Kiloton), by Price Trend Analysis 2025 & 2033
- Figure 69: Asia Pacific Cotton Industry Revenue Share (%), by Price Trend Analysis 2025 & 2033
- Figure 70: Asia Pacific Cotton Industry Volume Share (%), by Price Trend Analysis 2025 & 2033
- Figure 71: Asia Pacific Cotton Industry Revenue (Million), by Country 2025 & 2033
- Figure 72: Asia Pacific Cotton Industry Volume (Kiloton), by Country 2025 & 2033
- Figure 73: Asia Pacific Cotton Industry Revenue Share (%), by Country 2025 & 2033
- Figure 74: Asia Pacific Cotton Industry Volume Share (%), by Country 2025 & 2033
- Figure 75: South America Cotton Industry Revenue (Million), by Production Analysis 2025 & 2033
- Figure 76: South America Cotton Industry Volume (Kiloton), by Production Analysis 2025 & 2033
- Figure 77: South America Cotton Industry Revenue Share (%), by Production Analysis 2025 & 2033
- Figure 78: South America Cotton Industry Volume Share (%), by Production Analysis 2025 & 2033
- Figure 79: South America Cotton Industry Revenue (Million), by Consumption Analysis 2025 & 2033
- Figure 80: South America Cotton Industry Volume (Kiloton), by Consumption Analysis 2025 & 2033
- Figure 81: South America Cotton Industry Revenue Share (%), by Consumption Analysis 2025 & 2033
- Figure 82: South America Cotton Industry Volume Share (%), by Consumption Analysis 2025 & 2033
- Figure 83: South America Cotton Industry Revenue (Million), by Import Market Analysis (Value & Volume) 2025 & 2033
- Figure 84: South America Cotton Industry Volume (Kiloton), by Import Market Analysis (Value & Volume) 2025 & 2033
- Figure 85: South America Cotton Industry Revenue Share (%), by Import Market Analysis (Value & Volume) 2025 & 2033
- Figure 86: South America Cotton Industry Volume Share (%), by Import Market Analysis (Value & Volume) 2025 & 2033
- Figure 87: South America Cotton Industry Revenue (Million), by Export Market Analysis (Value & Volume) 2025 & 2033
- Figure 88: South America Cotton Industry Volume (Kiloton), by Export Market Analysis (Value & Volume) 2025 & 2033
- Figure 89: South America Cotton Industry Revenue Share (%), by Export Market Analysis (Value & Volume) 2025 & 2033
- Figure 90: South America Cotton Industry Volume Share (%), by Export Market Analysis (Value & Volume) 2025 & 2033
- Figure 91: South America Cotton Industry Revenue (Million), by Price Trend Analysis 2025 & 2033
- Figure 92: South America Cotton Industry Volume (Kiloton), by Price Trend Analysis 2025 & 2033
- Figure 93: South America Cotton Industry Revenue Share (%), by Price Trend Analysis 2025 & 2033
- Figure 94: South America Cotton Industry Volume Share (%), by Price Trend Analysis 2025 & 2033
- Figure 95: South America Cotton Industry Revenue (Million), by Country 2025 & 2033
- Figure 96: South America Cotton Industry Volume (Kiloton), by Country 2025 & 2033
- Figure 97: South America Cotton Industry Revenue Share (%), by Country 2025 & 2033
- Figure 98: South America Cotton Industry Volume Share (%), by Country 2025 & 2033
- Figure 99: Middle East Cotton Industry Revenue (Million), by Production Analysis 2025 & 2033
- Figure 100: Middle East Cotton Industry Volume (Kiloton), by Production Analysis 2025 & 2033
- Figure 101: Middle East Cotton Industry Revenue Share (%), by Production Analysis 2025 & 2033
- Figure 102: Middle East Cotton Industry Volume Share (%), by Production Analysis 2025 & 2033
- Figure 103: Middle East Cotton Industry Revenue (Million), by Consumption Analysis 2025 & 2033
- Figure 104: Middle East Cotton Industry Volume (Kiloton), by Consumption Analysis 2025 & 2033
- Figure 105: Middle East Cotton Industry Revenue Share (%), by Consumption Analysis 2025 & 2033
- Figure 106: Middle East Cotton Industry Volume Share (%), by Consumption Analysis 2025 & 2033
- Figure 107: Middle East Cotton Industry Revenue (Million), by Import Market Analysis (Value & Volume) 2025 & 2033
- Figure 108: Middle East Cotton Industry Volume (Kiloton), by Import Market Analysis (Value & Volume) 2025 & 2033
- Figure 109: Middle East Cotton Industry Revenue Share (%), by Import Market Analysis (Value & Volume) 2025 & 2033
- Figure 110: Middle East Cotton Industry Volume Share (%), by Import Market Analysis (Value & Volume) 2025 & 2033
- Figure 111: Middle East Cotton Industry Revenue (Million), by Export Market Analysis (Value & Volume) 2025 & 2033
- Figure 112: Middle East Cotton Industry Volume (Kiloton), by Export Market Analysis (Value & Volume) 2025 & 2033
- Figure 113: Middle East Cotton Industry Revenue Share (%), by Export Market Analysis (Value & Volume) 2025 & 2033
- Figure 114: Middle East Cotton Industry Volume Share (%), by Export Market Analysis (Value & Volume) 2025 & 2033
- Figure 115: Middle East Cotton Industry Revenue (Million), by Price Trend Analysis 2025 & 2033
- Figure 116: Middle East Cotton Industry Volume (Kiloton), by Price Trend Analysis 2025 & 2033
- Figure 117: Middle East Cotton Industry Revenue Share (%), by Price Trend Analysis 2025 & 2033
- Figure 118: Middle East Cotton Industry Volume Share (%), by Price Trend Analysis 2025 & 2033
- Figure 119: Middle East Cotton Industry Revenue (Million), by Country 2025 & 2033
- Figure 120: Middle East Cotton Industry Volume (Kiloton), by Country 2025 & 2033
- Figure 121: Middle East Cotton Industry Revenue Share (%), by Country 2025 & 2033
- Figure 122: Middle East Cotton Industry Volume Share (%), by Country 2025 & 2033
- Figure 123: South Africa Cotton Industry Revenue (Million), by Production Analysis 2025 & 2033
- Figure 124: South Africa Cotton Industry Volume (Kiloton), by Production Analysis 2025 & 2033
- Figure 125: South Africa Cotton Industry Revenue Share (%), by Production Analysis 2025 & 2033
- Figure 126: South Africa Cotton Industry Volume Share (%), by Production Analysis 2025 & 2033
- Figure 127: South Africa Cotton Industry Revenue (Million), by Consumption Analysis 2025 & 2033
- Figure 128: South Africa Cotton Industry Volume (Kiloton), by Consumption Analysis 2025 & 2033
- Figure 129: South Africa Cotton Industry Revenue Share (%), by Consumption Analysis 2025 & 2033
- Figure 130: South Africa Cotton Industry Volume Share (%), by Consumption Analysis 2025 & 2033
- Figure 131: South Africa Cotton Industry Revenue (Million), by Import Market Analysis (Value & Volume) 2025 & 2033
- Figure 132: South Africa Cotton Industry Volume (Kiloton), by Import Market Analysis (Value & Volume) 2025 & 2033
- Figure 133: South Africa Cotton Industry Revenue Share (%), by Import Market Analysis (Value & Volume) 2025 & 2033
- Figure 134: South Africa Cotton Industry Volume Share (%), by Import Market Analysis (Value & Volume) 2025 & 2033
- Figure 135: South Africa Cotton Industry Revenue (Million), by Export Market Analysis (Value & Volume) 2025 & 2033
- Figure 136: South Africa Cotton Industry Volume (Kiloton), by Export Market Analysis (Value & Volume) 2025 & 2033
- Figure 137: South Africa Cotton Industry Revenue Share (%), by Export Market Analysis (Value & Volume) 2025 & 2033
- Figure 138: South Africa Cotton Industry Volume Share (%), by Export Market Analysis (Value & Volume) 2025 & 2033
- Figure 139: South Africa Cotton Industry Revenue (Million), by Price Trend Analysis 2025 & 2033
- Figure 140: South Africa Cotton Industry Volume (Kiloton), by Price Trend Analysis 2025 & 2033
- Figure 141: South Africa Cotton Industry Revenue Share (%), by Price Trend Analysis 2025 & 2033
- Figure 142: South Africa Cotton Industry Volume Share (%), by Price Trend Analysis 2025 & 2033
- Figure 143: South Africa Cotton Industry Revenue (Million), by Country 2025 & 2033
- Figure 144: South Africa Cotton Industry Volume (Kiloton), by Country 2025 & 2033
- Figure 145: South Africa Cotton Industry Revenue Share (%), by Country 2025 & 2033
- Figure 146: South Africa Cotton Industry Volume Share (%), by Country 2025 & 2033
List of Tables
- Table 1: Global Cotton Industry Revenue Million Forecast, by Production Analysis 2020 & 2033
- Table 2: Global Cotton Industry Volume Kiloton Forecast, by Production Analysis 2020 & 2033
- Table 3: Global Cotton Industry Revenue Million Forecast, by Consumption Analysis 2020 & 2033
- Table 4: Global Cotton Industry Volume Kiloton Forecast, by Consumption Analysis 2020 & 2033
- Table 5: Global Cotton Industry Revenue Million Forecast, by Import Market Analysis (Value & Volume) 2020 & 2033
- Table 6: Global Cotton Industry Volume Kiloton Forecast, by Import Market Analysis (Value & Volume) 2020 & 2033
- Table 7: Global Cotton Industry Revenue Million Forecast, by Export Market Analysis (Value & Volume) 2020 & 2033
- Table 8: Global Cotton Industry Volume Kiloton Forecast, by Export Market Analysis (Value & Volume) 2020 & 2033
- Table 9: Global Cotton Industry Revenue Million Forecast, by Price Trend Analysis 2020 & 2033
- Table 10: Global Cotton Industry Volume Kiloton Forecast, by Price Trend Analysis 2020 & 2033
- Table 11: Global Cotton Industry Revenue Million Forecast, by Region 2020 & 2033
- Table 12: Global Cotton Industry Volume Kiloton Forecast, by Region 2020 & 2033
- Table 13: Global Cotton Industry Revenue Million Forecast, by Production Analysis 2020 & 2033
- Table 14: Global Cotton Industry Volume Kiloton Forecast, by Production Analysis 2020 & 2033
- Table 15: Global Cotton Industry Revenue Million Forecast, by Consumption Analysis 2020 & 2033
- Table 16: Global Cotton Industry Volume Kiloton Forecast, by Consumption Analysis 2020 & 2033
- Table 17: Global Cotton Industry Revenue Million Forecast, by Import Market Analysis (Value & Volume) 2020 & 2033
- Table 18: Global Cotton Industry Volume Kiloton Forecast, by Import Market Analysis (Value & Volume) 2020 & 2033
- Table 19: Global Cotton Industry Revenue Million Forecast, by Export Market Analysis (Value & Volume) 2020 & 2033
- Table 20: Global Cotton Industry Volume Kiloton Forecast, by Export Market Analysis (Value & Volume) 2020 & 2033
- Table 21: Global Cotton Industry Revenue Million Forecast, by Price Trend Analysis 2020 & 2033
- Table 22: Global Cotton Industry Volume Kiloton Forecast, by Price Trend Analysis 2020 & 2033
- Table 23: Global Cotton Industry Revenue Million Forecast, by Country 2020 & 2033
- Table 24: Global Cotton Industry Volume Kiloton Forecast, by Country 2020 & 2033
- Table 25: United States Cotton Industry Revenue (Million) Forecast, by Application 2020 & 2033
- Table 26: United States Cotton Industry Volume (Kiloton) Forecast, by Application 2020 & 2033
- Table 27: Canada Cotton Industry Revenue (Million) Forecast, by Application 2020 & 2033
- Table 28: Canada Cotton Industry Volume (Kiloton) Forecast, by Application 2020 & 2033
- Table 29: Mexico Cotton Industry Revenue (Million) Forecast, by Application 2020 & 2033
- Table 30: Mexico Cotton Industry Volume (Kiloton) Forecast, by Application 2020 & 2033
- Table 31: Global Cotton Industry Revenue Million Forecast, by Production Analysis 2020 & 2033
- Table 32: Global Cotton Industry Volume Kiloton Forecast, by Production Analysis 2020 & 2033
- Table 33: Global Cotton Industry Revenue Million Forecast, by Consumption Analysis 2020 & 2033
- Table 34: Global Cotton Industry Volume Kiloton Forecast, by Consumption Analysis 2020 & 2033
- Table 35: Global Cotton Industry Revenue Million Forecast, by Import Market Analysis (Value & Volume) 2020 & 2033
- Table 36: Global Cotton Industry Volume Kiloton Forecast, by Import Market Analysis (Value & Volume) 2020 & 2033
- Table 37: Global Cotton Industry Revenue Million Forecast, by Export Market Analysis (Value & Volume) 2020 & 2033
- Table 38: Global Cotton Industry Volume Kiloton Forecast, by Export Market Analysis (Value & Volume) 2020 & 2033
- Table 39: Global Cotton Industry Revenue Million Forecast, by Price Trend Analysis 2020 & 2033
- Table 40: Global Cotton Industry Volume Kiloton Forecast, by Price Trend Analysis 2020 & 2033
- Table 41: Global Cotton Industry Revenue Million Forecast, by Country 2020 & 2033
- Table 42: Global Cotton Industry Volume Kiloton Forecast, by Country 2020 & 2033
- Table 43: Germany Cotton Industry Revenue (Million) Forecast, by Application 2020 & 2033
- Table 44: Germany Cotton Industry Volume (Kiloton) Forecast, by Application 2020 & 2033
- Table 45: France Cotton Industry Revenue (Million) Forecast, by Application 2020 & 2033
- Table 46: France Cotton Industry Volume (Kiloton) Forecast, by Application 2020 & 2033
- Table 47: Russia Cotton Industry Revenue (Million) Forecast, by Application 2020 & 2033
- Table 48: Russia Cotton Industry Volume (Kiloton) Forecast, by Application 2020 & 2033
- Table 49: Greece Cotton Industry Revenue (Million) Forecast, by Application 2020 & 2033
- Table 50: Greece Cotton Industry Volume (Kiloton) Forecast, by Application 2020 & 2033
- Table 51: Italy Cotton Industry Revenue (Million) Forecast, by Application 2020 & 2033
- Table 52: Italy Cotton Industry Volume (Kiloton) Forecast, by Application 2020 & 2033
- Table 53: Global Cotton Industry Revenue Million Forecast, by Production Analysis 2020 & 2033
- Table 54: Global Cotton Industry Volume Kiloton Forecast, by Production Analysis 2020 & 2033
- Table 55: Global Cotton Industry Revenue Million Forecast, by Consumption Analysis 2020 & 2033
- Table 56: Global Cotton Industry Volume Kiloton Forecast, by Consumption Analysis 2020 & 2033
- Table 57: Global Cotton Industry Revenue Million Forecast, by Import Market Analysis (Value & Volume) 2020 & 2033
- Table 58: Global Cotton Industry Volume Kiloton Forecast, by Import Market Analysis (Value & Volume) 2020 & 2033
- Table 59: Global Cotton Industry Revenue Million Forecast, by Export Market Analysis (Value & Volume) 2020 & 2033
- Table 60: Global Cotton Industry Volume Kiloton Forecast, by Export Market Analysis (Value & Volume) 2020 & 2033
- Table 61: Global Cotton Industry Revenue Million Forecast, by Price Trend Analysis 2020 & 2033
- Table 62: Global Cotton Industry Volume Kiloton Forecast, by Price Trend Analysis 2020 & 2033
- Table 63: Global Cotton Industry Revenue Million Forecast, by Country 2020 & 2033
- Table 64: Global Cotton Industry Volume Kiloton Forecast, by Country 2020 & 2033
- Table 65: China Cotton Industry Revenue (Million) Forecast, by Application 2020 & 2033
- Table 66: China Cotton Industry Volume (Kiloton) Forecast, by Application 2020 & 2033
- Table 67: India Cotton Industry Revenue (Million) Forecast, by Application 2020 & 2033
- Table 68: India Cotton Industry Volume (Kiloton) Forecast, by Application 2020 & 2033
- Table 69: Australia Cotton Industry Revenue (Million) Forecast, by Application 2020 & 2033
- Table 70: Australia Cotton Industry Volume (Kiloton) Forecast, by Application 2020 & 2033
- Table 71: Pakistan Cotton Industry Revenue (Million) Forecast, by Application 2020 & 2033
- Table 72: Pakistan Cotton Industry Volume (Kiloton) Forecast, by Application 2020 & 2033
- Table 73: Bangladesh Cotton Industry Revenue (Million) Forecast, by Application 2020 & 2033
- Table 74: Bangladesh Cotton Industry Volume (Kiloton) Forecast, by Application 2020 & 2033
- Table 75: Global Cotton Industry Revenue Million Forecast, by Production Analysis 2020 & 2033
- Table 76: Global Cotton Industry Volume Kiloton Forecast, by Production Analysis 2020 & 2033
- Table 77: Global Cotton Industry Revenue Million Forecast, by Consumption Analysis 2020 & 2033
- Table 78: Global Cotton Industry Volume Kiloton Forecast, by Consumption Analysis 2020 & 2033
- Table 79: Global Cotton Industry Revenue Million Forecast, by Import Market Analysis (Value & Volume) 2020 & 2033
- Table 80: Global Cotton Industry Volume Kiloton Forecast, by Import Market Analysis (Value & Volume) 2020 & 2033
- Table 81: Global Cotton Industry Revenue Million Forecast, by Export Market Analysis (Value & Volume) 2020 & 2033
- Table 82: Global Cotton Industry Volume Kiloton Forecast, by Export Market Analysis (Value & Volume) 2020 & 2033
- Table 83: Global Cotton Industry Revenue Million Forecast, by Price Trend Analysis 2020 & 2033
- Table 84: Global Cotton Industry Volume Kiloton Forecast, by Price Trend Analysis 2020 & 2033
- Table 85: Global Cotton Industry Revenue Million Forecast, by Country 2020 & 2033
- Table 86: Global Cotton Industry Volume Kiloton Forecast, by Country 2020 & 2033
- Table 87: Brazil Cotton Industry Revenue (Million) Forecast, by Application 2020 & 2033
- Table 88: Brazil Cotton Industry Volume (Kiloton) Forecast, by Application 2020 & 2033
- Table 89: Argentina Cotton Industry Revenue (Million) Forecast, by Application 2020 & 2033
- Table 90: Argentina Cotton Industry Volume (Kiloton) Forecast, by Application 2020 & 2033
- Table 91: Global Cotton Industry Revenue Million Forecast, by Production Analysis 2020 & 2033
- Table 92: Global Cotton Industry Volume Kiloton Forecast, by Production Analysis 2020 & 2033
- Table 93: Global Cotton Industry Revenue Million Forecast, by Consumption Analysis 2020 & 2033
- Table 94: Global Cotton Industry Volume Kiloton Forecast, by Consumption Analysis 2020 & 2033
- Table 95: Global Cotton Industry Revenue Million Forecast, by Import Market Analysis (Value & Volume) 2020 & 2033
- Table 96: Global Cotton Industry Volume Kiloton Forecast, by Import Market Analysis (Value & Volume) 2020 & 2033
- Table 97: Global Cotton Industry Revenue Million Forecast, by Export Market Analysis (Value & Volume) 2020 & 2033
- Table 98: Global Cotton Industry Volume Kiloton Forecast, by Export Market Analysis (Value & Volume) 2020 & 2033
- Table 99: Global Cotton Industry Revenue Million Forecast, by Price Trend Analysis 2020 & 2033
- Table 100: Global Cotton Industry Volume Kiloton Forecast, by Price Trend Analysis 2020 & 2033
- Table 101: Global Cotton Industry Revenue Million Forecast, by Country 2020 & 2033
- Table 102: Global Cotton Industry Volume Kiloton Forecast, by Country 2020 & 2033
- Table 103: Global Cotton Industry Revenue Million Forecast, by Production Analysis 2020 & 2033
- Table 104: Global Cotton Industry Volume Kiloton Forecast, by Production Analysis 2020 & 2033
- Table 105: Global Cotton Industry Revenue Million Forecast, by Consumption Analysis 2020 & 2033
- Table 106: Global Cotton Industry Volume Kiloton Forecast, by Consumption Analysis 2020 & 2033
- Table 107: Global Cotton Industry Revenue Million Forecast, by Import Market Analysis (Value & Volume) 2020 & 2033
- Table 108: Global Cotton Industry Volume Kiloton Forecast, by Import Market Analysis (Value & Volume) 2020 & 2033
- Table 109: Global Cotton Industry Revenue Million Forecast, by Export Market Analysis (Value & Volume) 2020 & 2033
- Table 110: Global Cotton Industry Volume Kiloton Forecast, by Export Market Analysis (Value & Volume) 2020 & 2033
- Table 111: Global Cotton Industry Revenue Million Forecast, by Price Trend Analysis 2020 & 2033
- Table 112: Global Cotton Industry Volume Kiloton Forecast, by Price Trend Analysis 2020 & 2033
- Table 113: Global Cotton Industry Revenue Million Forecast, by Country 2020 & 2033
- Table 114: Global Cotton Industry Volume Kiloton Forecast, by Country 2020 & 2033
- Table 115: Turkey Cotton Industry Revenue (Million) Forecast, by Application 2020 & 2033
- Table 116: Turkey Cotton Industry Volume (Kiloton) Forecast, by Application 2020 & 2033
- Table 117: Egypt Cotton Industry Revenue (Million) Forecast, by Application 2020 & 2033
- Table 118: Egypt Cotton Industry Volume (Kiloton) Forecast, by Application 2020 & 2033
Frequently Asked Questions
1. What is the projected Compound Annual Growth Rate (CAGR) of the Cotton Industry?
The projected CAGR is approximately 2.70%.
2. Which companies are prominent players in the Cotton Industry?
Key companies in the market include Monsanto, National Cotton Council of America, Syngenta , The Texas Cotton Association, Cotton Incorporated , International Cotton Association , Bayer CropScience .
3. What are the main segments of the Cotton Industry?
The market segments include Production Analysis, Consumption Analysis, Import Market Analysis (Value & Volume), Export Market Analysis (Value & Volume), Price Trend Analysis.
4. Can you provide details about the market size?
The market size is estimated to be USD 43.96 Million as of 2022.
5. What are some drivers contributing to market growth?
Rising Demand for Milled and Broken Rice; Growing Preference for Speciality Rice Variety; Government Initiatives Supports Rice Production.
6. What are the notable trends driving market growth?
Increasing demand for the cotton exports.
7. Are there any restraints impacting market growth?
Lack of Supply Chain for Rice; Growing Agricultural Labor Crisis.
8. Can you provide examples of recent developments in the market?
September 2022: The two first-ever new organic cotton varieties have been made available to farmers in India. These varieties were developed through a decentralized organic participatory breeding program of FiBL Switzerland and their partners.
9. What pricing options are available for accessing the report?
Pricing options include single-user, multi-user, and enterprise licenses priced at USD 4750, USD 5250, and USD 8750 respectively.
10. Is the market size provided in terms of value or volume?
The market size is provided in terms of value, measured in Million and volume, measured in Kiloton.
11. Are there any specific market keywords associated with the report?
Yes, the market keyword associated with the report is "Cotton Industry," which aids in identifying and referencing the specific market segment covered.
12. How do I determine which pricing option suits my needs best?
The pricing options vary based on user requirements and access needs. Individual users may opt for single-user licenses, while businesses requiring broader access may choose multi-user or enterprise licenses for cost-effective access to the report.
13. Are there any additional resources or data provided in the Cotton Industry report?
While the report offers comprehensive insights, it's advisable to review the specific contents or supplementary materials provided to ascertain if additional resources or data are available.
14. How can I stay updated on further developments or reports in the Cotton Industry?
To stay informed about further developments, trends, and reports in the Cotton Industry, consider subscribing to industry newsletters, following relevant companies and organizations, or regularly checking reputable industry news sources and publications.
Methodology
Step 1 - Identification of Relevant Samples Size from Population Database


Step 2 - Approaches for Defining Global Market Size (Value, Volume* & Price*)

Note*: In applicable scenarios
Step 3 - Data Sources
Primary Research
- Web Analytics
- Survey Reports
- Research Institute
- Latest Research Reports
- Opinion Leaders
Secondary Research
- Annual Reports
- White Paper
- Latest Press Release
- Industry Association
- Paid Database
- Investor Presentations

Step 4 - Data Triangulation
Involves using different sources of information in order to increase the validity of a study
These sources are likely to be stakeholders in a program - participants, other researchers, program staff, other community members, and so on.
Then we put all data in single framework & apply various statistical tools to find out the dynamic on the market.
During the analysis stage, feedback from the stakeholder groups would be compared to determine areas of agreement as well as areas of divergence