

Key Insights
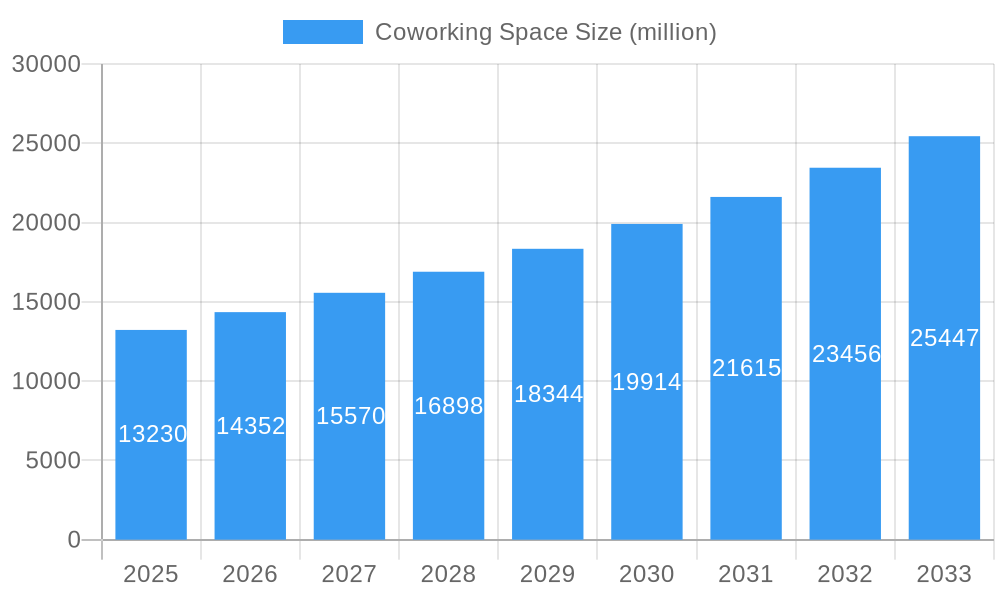
The coworking space market, valued at $13.23 billion in 2025, is experiencing robust growth, projected to expand at a compound annual growth rate (CAGR) of 8.5% from 2025 to 2033. This expansion is driven by several key factors. The increasing preference for flexible work arrangements among startups, freelancers, and small-to-medium-sized enterprises (SMEs) is a major catalyst. Coworking spaces offer cost-effective solutions compared to traditional office rentals, providing access to shared amenities, networking opportunities, and a vibrant professional environment. Technological advancements, such as improved booking platforms and virtual office solutions, are further enhancing the appeal and accessibility of these spaces. Furthermore, a growing emphasis on work-life balance and the rise of the gig economy are contributing to the market's upward trajectory. The diverse range of offerings, from basic hot-desking to fully serviced private offices, caters to a broad spectrum of user needs and budgets.
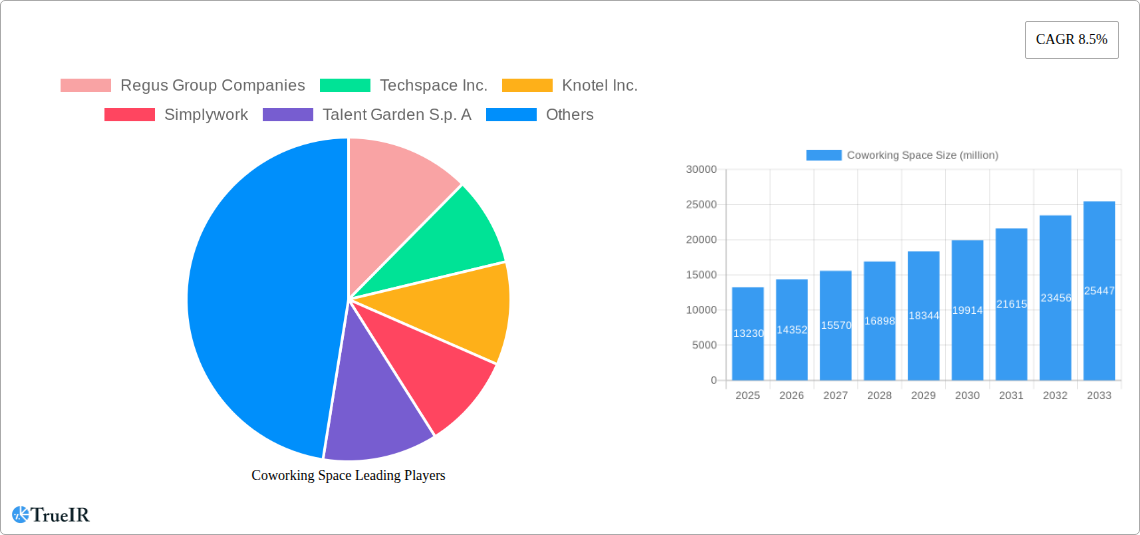
Coworking Space Market Size (In Billion)
Competition in the coworking space market is intense, with established players like Regus, WeWork, and IWG vying for market share alongside numerous smaller, regional operators. The market is segmented by service type (hot desks, dedicated desks, private offices), size of business (startups, SMEs, large corporations), and location (urban centers versus suburban areas). While the market enjoys significant growth potential, challenges remain. Economic downturns can impact demand, and the need to maintain high occupancy rates to ensure profitability presents a continuous operational hurdle for providers. The successful players will likely be those who adapt to evolving technological advancements, offer tailored services to specific market segments, and strategically manage operational costs while delivering an exceptional member experience. The forecast period suggests continued market expansion fueled by ongoing trends towards flexible work arrangements and the increasing demand for collaborative work environments.
Coworking Space Company Market Share
This dynamic report provides a comprehensive analysis of the global coworking space market, projecting a market value exceeding $XX million by 2033. Leveraging extensive research across the historical period (2019-2024), base year (2025), and forecast period (2025-2033), this report offers invaluable insights for investors, entrepreneurs, and industry professionals. The study covers key market segments, competitive landscapes, and future growth projections, incorporating data from leading players like WeWork, Regus, and IWG, among others. This report is essential for navigating the ever-evolving coworking space landscape and making informed business decisions.
Coworking Space Market Structure & Competitive Landscape
The global coworking space market exhibits a moderately concentrated structure, with a few major players commanding significant market share. The Herfindahl-Hirschman Index (HHI) is estimated at xx in 2025, indicating a relatively competitive yet consolidated environment. Several factors influence this structure:
- Innovation Drivers: Technological advancements, such as flexible booking platforms and smart office solutions, continuously drive innovation and reshape the competitive landscape.
- Regulatory Impacts: Varying zoning regulations and building codes across different regions create unique challenges and opportunities for market entrants. Tax incentives and government support programs in certain areas also influence market growth.
- Product Substitutes: Traditional office spaces and virtual offices remain viable alternatives, exerting competitive pressure on the coworking sector. However, the increasing demand for flexible work arrangements continues to favor coworking spaces.
- End-User Segmentation: The market caters to a diverse range of users, including freelancers, startups, small and medium-sized enterprises (SMEs), and large corporations, each with specific needs and preferences.
- M&A Trends: The past five years have witnessed numerous mergers and acquisitions (M&A) within the coworking industry, with an estimated xx million transactions valued at over $xx million. This consolidation trend is likely to continue, further shaping the market's structure. Companies like IWG have actively pursued acquisitions to expand their global footprint and increase market share.
Coworking Space Market Trends & Opportunities
The global coworking space market is experiencing robust growth, with a projected Compound Annual Growth Rate (CAGR) of xx% during the forecast period (2025-2033). This growth is driven by several key trends:
- Market Size Growth: The market size is estimated to reach $xx million in 2025 and is projected to exceed $xx million by 2033.
- Technological Shifts: The integration of smart technology, including IoT-enabled spaces and advanced booking systems, is enhancing user experience and operational efficiency.
- Consumer Preferences: The increasing demand for flexible work arrangements, community-driven environments, and cost-effective solutions is fueling the growth of coworking spaces.
- Competitive Dynamics: While the market is competitive, differentiation through unique services, amenities, and community building initiatives is key to success. The focus is shifting toward specialized spaces catering to specific industry needs.
- Market Penetration Rates: Market penetration is expected to increase significantly, particularly in emerging markets with growing urban populations and a rising entrepreneurial spirit.
Dominant Markets & Segments in Coworking Space
The North American market currently holds the largest share of the global coworking space market, driven by factors such as:
- Key Growth Drivers:
- Robust entrepreneurial ecosystem: North America boasts a thriving startup culture, creating significant demand for flexible workspaces.
- Advanced infrastructure: Well-developed infrastructure, including high-speed internet and reliable transportation, supports the growth of coworking spaces.
- Favorable regulatory environment: Relatively flexible zoning regulations and government support programs encourage the expansion of the industry.
- Detailed Analysis: The US and Canada lead the North American market, with major cities such as New York, San Francisco, Toronto, and Montreal attracting a high concentration of coworking spaces. The presence of major players like WeWork and Regus contributes to this dominance.
Coworking Space Product Analysis
Coworking spaces are increasingly offering a range of value-added services beyond basic desk rentals. This includes dedicated meeting rooms, event spaces, networking opportunities, and specialized amenities tailored to specific industry needs. The integration of technology enhances the user experience, with features such as online booking systems, smart office solutions, and virtual assistant services becoming increasingly common. The success of these spaces hinges on their ability to curate a strong sense of community and provide a productive and inspiring work environment.
Key Drivers, Barriers & Challenges in Coworking Space
Key Drivers:
- Technological advancements: Automation, digital connectivity, and smart building technologies are enhancing the efficiency and appeal of coworking spaces.
- Economic factors: The rise of the gig economy and the increasing preference for flexible work arrangements are boosting demand.
- Government policies: Supportive policies promoting entrepreneurship and flexible work models are further fueling market growth.
Challenges:
- High operating costs: Maintaining high-quality spaces and providing value-added services involves considerable expenses.
- Competition: The market is increasingly competitive, necessitating continuous innovation and adaptation.
- Economic downturns: Economic recessions can significantly impact the demand for coworking spaces, particularly among startups and SMEs.
Growth Drivers in the Coworking Space Market
The coworking space market is propelled by several key factors: the rise of remote work and the gig economy, the demand for flexible and collaborative workspaces, technological advancements leading to improved operational efficiency and enhanced user experience, and supportive government policies promoting entrepreneurship and flexible work models.
Challenges Impacting Coworking Space Growth
Significant challenges include intense competition, fluctuations in economic conditions impacting demand, varying regulatory environments across different locations, and the need for continuous innovation to maintain a competitive edge.
Key Players Shaping the Coworking Space Market
- Regus Group Companies
- Techspace Inc.
- Knotel Inc.
- Simplywork
- Talent Garden S.p. A
- Premier Workspaces
- Kr Space
- Convene
- Servcorp Limited
- Wework Management Llc
- UCOMMUNE
- Workbar
- Hera Hub
- Impact Hub
- Venture X
- Cowork at District
- Serendipity Labs
- IWG
- Industrious
- Membership Collective Group (MCG)
- The Hive Jinnan
- Shenzhen Cfg Business Services
- JustCo
- Awfis
- Distrii
- Studio
- Galvanize
- ATLAS Workplace
- Greendesk
- IC Coworking
Significant Coworking Space Industry Milestones
- 2020: Increased adoption of virtual coworking solutions due to the COVID-19 pandemic.
- 2021: Many coworking spaces reopened with enhanced safety measures.
- 2022: Continued growth in the market, with a focus on hybrid work models.
- 2023: Expansion of specialized coworking spaces catering to niche industries.
Future Outlook for Coworking Space Market
The coworking space market is poised for continued growth, driven by ongoing technological advancements, evolving work styles, and a growing demand for flexible and collaborative work environments. The industry will likely witness further consolidation, with larger players acquiring smaller firms, and a focus on developing specialized spaces to cater to the specific needs of different industries. The market's future growth will also hinge on successfully navigating economic uncertainties and adapting to evolving regulations.
Coworking Space Segmentation
-
1. Application
- 1.1. Personal User
- 1.2. Small Scale Company
- 1.3. Large Scale Company
-
2. Type
- 2.1. Open-Conventional Coworking Spaces
- 2.2. Corporate-Professional Coworking Spaces
Coworking Space Segmentation By Geography
-
1. North America
- 1.1. United States
- 1.2. Canada
- 1.3. Mexico
-
2. South America
- 2.1. Brazil
- 2.2. Argentina
- 2.3. Rest of South America
-
3. Europe
- 3.1. United Kingdom
- 3.2. Germany
- 3.3. France
- 3.4. Italy
- 3.5. Spain
- 3.6. Russia
- 3.7. Benelux
- 3.8. Nordics
- 3.9. Rest of Europe
-
4. Middle East & Africa
- 4.1. Turkey
- 4.2. Israel
- 4.3. GCC
- 4.4. North Africa
- 4.5. South Africa
- 4.6. Rest of Middle East & Africa
-
5. Asia Pacific
- 5.1. China
- 5.2. India
- 5.3. Japan
- 5.4. South Korea
- 5.5. ASEAN
- 5.6. Oceania
- 5.7. Rest of Asia Pacific
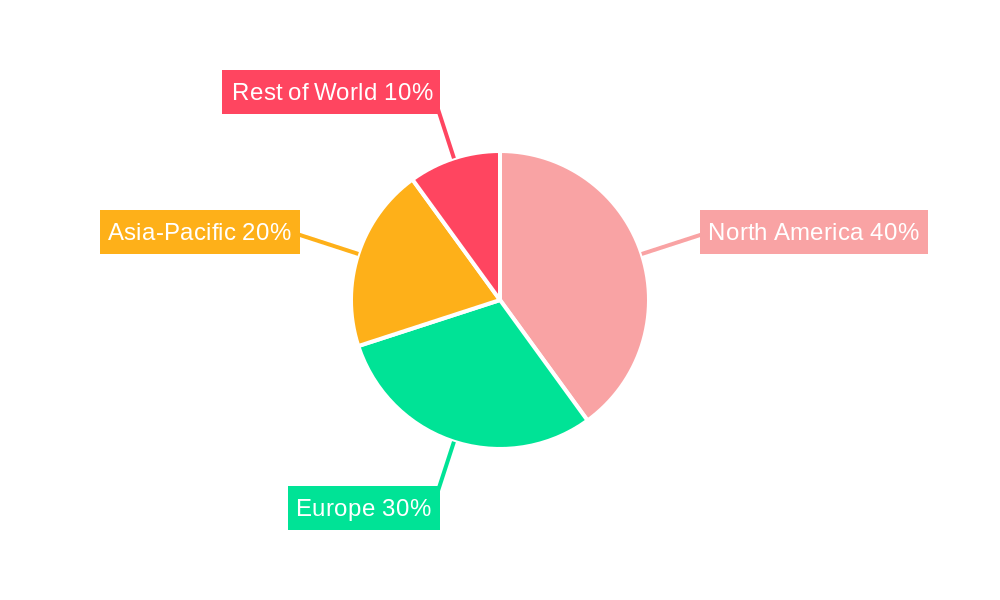
Coworking Space Regional Market Share
Geographic Coverage of Coworking Space
Coworking Space REPORT HIGHLIGHTS
| Aspects | Details |
|---|---|
| Study Period | 2020-2034 |
| Base Year | 2025 |
| Estimated Year | 2026 |
| Forecast Period | 2026-2034 |
| Historical Period | 2020-2025 |
| Growth Rate | CAGR of 8.5% from 2020-2034 |
| Segmentation |
|
Table of Contents
- 1. Introduction
- 1.1. Research Scope
- 1.2. Market Segmentation
- 1.3. Research Objective
- 1.4. Definitions and Assumptions
- 2. Executive Summary
- 2.1. Market Snapshot
- 3. Market Dynamics
- 3.1. Market Drivers
- 3.2. Market Restrains
- 3.3. Market Trends
- 3.4. Market Opportunities
- 4. Market Factor Analysis
- 4.1. Porters Five Forces
- 4.1.1. Bargaining Power of Suppliers
- 4.1.2. Bargaining Power of Buyers
- 4.1.3. Threat of New Entrants
- 4.1.4. Threat of Substitutes
- 4.1.5. Competitive Rivalry
- 4.2. PESTEL analysis
- 4.3. BCG Analysis
- 4.3.1. Stars (High Growth, High Market Share)
- 4.3.2. Cash Cows (Low Growth, High Market Share)
- 4.3.3. Question Mark (High Growth, Low Market Share)
- 4.3.4. Dogs (Low Growth, Low Market Share)
- 4.4. Ansoff Matrix Analysis
- 4.5. Supply Chain Analysis
- 4.6. Regulatory Landscape
- 4.7. Current Market Potential and Opportunity Assessment (TAM–SAM–SOM Framework)
- 4.8. TIR Analyst Note
- 4.1. Porters Five Forces
- 5. Market Analysis, Insights and Forecast 2021-2033
- 5.1. Market Analysis, Insights and Forecast - by Application
- 5.1.1. Personal User
- 5.1.2. Small Scale Company
- 5.1.3. Large Scale Company
- 5.2. Market Analysis, Insights and Forecast - by Type
- 5.2.1. Open-Conventional Coworking Spaces
- 5.2.2. Corporate-Professional Coworking Spaces
- 5.3. Market Analysis, Insights and Forecast - by Region
- 5.3.1. North America
- 5.3.2. South America
- 5.3.3. Europe
- 5.3.4. Middle East & Africa
- 5.3.5. Asia Pacific
- 5.1. Market Analysis, Insights and Forecast - by Application
- 6. Global Coworking Space Analysis, Insights and Forecast, 2021-2033
- 6.1. Market Analysis, Insights and Forecast - by Application
- 6.1.1. Personal User
- 6.1.2. Small Scale Company
- 6.1.3. Large Scale Company
- 6.2. Market Analysis, Insights and Forecast - by Type
- 6.2.1. Open-Conventional Coworking Spaces
- 6.2.2. Corporate-Professional Coworking Spaces
- 6.1. Market Analysis, Insights and Forecast - by Application
- 7. North America Coworking Space Analysis, Insights and Forecast, 2020-2032
- 7.1. Market Analysis, Insights and Forecast - by Application
- 7.1.1. Personal User
- 7.1.2. Small Scale Company
- 7.1.3. Large Scale Company
- 7.2. Market Analysis, Insights and Forecast - by Type
- 7.2.1. Open-Conventional Coworking Spaces
- 7.2.2. Corporate-Professional Coworking Spaces
- 7.1. Market Analysis, Insights and Forecast - by Application
- 8. South America Coworking Space Analysis, Insights and Forecast, 2020-2032
- 8.1. Market Analysis, Insights and Forecast - by Application
- 8.1.1. Personal User
- 8.1.2. Small Scale Company
- 8.1.3. Large Scale Company
- 8.2. Market Analysis, Insights and Forecast - by Type
- 8.2.1. Open-Conventional Coworking Spaces
- 8.2.2. Corporate-Professional Coworking Spaces
- 8.1. Market Analysis, Insights and Forecast - by Application
- 9. Europe Coworking Space Analysis, Insights and Forecast, 2020-2032
- 9.1. Market Analysis, Insights and Forecast - by Application
- 9.1.1. Personal User
- 9.1.2. Small Scale Company
- 9.1.3. Large Scale Company
- 9.2. Market Analysis, Insights and Forecast - by Type
- 9.2.1. Open-Conventional Coworking Spaces
- 9.2.2. Corporate-Professional Coworking Spaces
- 9.1. Market Analysis, Insights and Forecast - by Application
- 10. Middle East & Africa Coworking Space Analysis, Insights and Forecast, 2020-2032
- 10.1. Market Analysis, Insights and Forecast - by Application
- 10.1.1. Personal User
- 10.1.2. Small Scale Company
- 10.1.3. Large Scale Company
- 10.2. Market Analysis, Insights and Forecast - by Type
- 10.2.1. Open-Conventional Coworking Spaces
- 10.2.2. Corporate-Professional Coworking Spaces
- 10.1. Market Analysis, Insights and Forecast - by Application
- 11. Asia Pacific Coworking Space Analysis, Insights and Forecast, 2020-2032
- 11.1. Market Analysis, Insights and Forecast - by Application
- 11.1.1. Personal User
- 11.1.2. Small Scale Company
- 11.1.3. Large Scale Company
- 11.2. Market Analysis, Insights and Forecast - by Type
- 11.2.1. Open-Conventional Coworking Spaces
- 11.2.2. Corporate-Professional Coworking Spaces
- 11.1. Market Analysis, Insights and Forecast - by Application
- 12. Competitive Analysis
- 12.1. Company Profiles
- 12.1.1 Regus Group Companies
- 12.1.1.1. Company Overview
- 12.1.1.2. Products
- 12.1.1.3. Company Financials
- 12.1.1.4. SWOT Analysis
- 12.1.2 Techspace Inc.
- 12.1.2.1. Company Overview
- 12.1.2.2. Products
- 12.1.2.3. Company Financials
- 12.1.2.4. SWOT Analysis
- 12.1.3 Knotel Inc.
- 12.1.3.1. Company Overview
- 12.1.3.2. Products
- 12.1.3.3. Company Financials
- 12.1.3.4. SWOT Analysis
- 12.1.4 Simplywork
- 12.1.4.1. Company Overview
- 12.1.4.2. Products
- 12.1.4.3. Company Financials
- 12.1.4.4. SWOT Analysis
- 12.1.5 Talent Garden S.p. A
- 12.1.5.1. Company Overview
- 12.1.5.2. Products
- 12.1.5.3. Company Financials
- 12.1.5.4. SWOT Analysis
- 12.1.6 Premier Workspaces
- 12.1.6.1. Company Overview
- 12.1.6.2. Products
- 12.1.6.3. Company Financials
- 12.1.6.4. SWOT Analysis
- 12.1.7 Kr Space
- 12.1.7.1. Company Overview
- 12.1.7.2. Products
- 12.1.7.3. Company Financials
- 12.1.7.4. SWOT Analysis
- 12.1.8 Convene
- 12.1.8.1. Company Overview
- 12.1.8.2. Products
- 12.1.8.3. Company Financials
- 12.1.8.4. SWOT Analysis
- 12.1.9 Servcorp Limited
- 12.1.9.1. Company Overview
- 12.1.9.2. Products
- 12.1.9.3. Company Financials
- 12.1.9.4. SWOT Analysis
- 12.1.10 Wework Management Llc
- 12.1.10.1. Company Overview
- 12.1.10.2. Products
- 12.1.10.3. Company Financials
- 12.1.10.4. SWOT Analysis
- 12.1.11 UCOMMUNE
- 12.1.11.1. Company Overview
- 12.1.11.2. Products
- 12.1.11.3. Company Financials
- 12.1.11.4. SWOT Analysis
- 12.1.12 Workbar
- 12.1.12.1. Company Overview
- 12.1.12.2. Products
- 12.1.12.3. Company Financials
- 12.1.12.4. SWOT Analysis
- 12.1.13 Hera Hub
- 12.1.13.1. Company Overview
- 12.1.13.2. Products
- 12.1.13.3. Company Financials
- 12.1.13.4. SWOT Analysis
- 12.1.14 Impact Hub
- 12.1.14.1. Company Overview
- 12.1.14.2. Products
- 12.1.14.3. Company Financials
- 12.1.14.4. SWOT Analysis
- 12.1.15 Venture X
- 12.1.15.1. Company Overview
- 12.1.15.2. Products
- 12.1.15.3. Company Financials
- 12.1.15.4. SWOT Analysis
- 12.1.16 Cowork at District
- 12.1.16.1. Company Overview
- 12.1.16.2. Products
- 12.1.16.3. Company Financials
- 12.1.16.4. SWOT Analysis
- 12.1.17 Serendipity Labs
- 12.1.17.1. Company Overview
- 12.1.17.2. Products
- 12.1.17.3. Company Financials
- 12.1.17.4. SWOT Analysis
- 12.1.18 IWG
- 12.1.18.1. Company Overview
- 12.1.18.2. Products
- 12.1.18.3. Company Financials
- 12.1.18.4. SWOT Analysis
- 12.1.19 Industrious
- 12.1.19.1. Company Overview
- 12.1.19.2. Products
- 12.1.19.3. Company Financials
- 12.1.19.4. SWOT Analysis
- 12.1.20 Membership Collective Group (MCG)
- 12.1.20.1. Company Overview
- 12.1.20.2. Products
- 12.1.20.3. Company Financials
- 12.1.20.4. SWOT Analysis
- 12.1.21 The Hive Jinnan
- 12.1.21.1. Company Overview
- 12.1.21.2. Products
- 12.1.21.3. Company Financials
- 12.1.21.4. SWOT Analysis
- 12.1.22 Shenzhen Cfg Business Services
- 12.1.22.1. Company Overview
- 12.1.22.2. Products
- 12.1.22.3. Company Financials
- 12.1.22.4. SWOT Analysis
- 12.1.23 JustCo
- 12.1.23.1. Company Overview
- 12.1.23.2. Products
- 12.1.23.3. Company Financials
- 12.1.23.4. SWOT Analysis
- 12.1.24 Awfis
- 12.1.24.1. Company Overview
- 12.1.24.2. Products
- 12.1.24.3. Company Financials
- 12.1.24.4. SWOT Analysis
- 12.1.25 Distrii
- 12.1.25.1. Company Overview
- 12.1.25.2. Products
- 12.1.25.3. Company Financials
- 12.1.25.4. SWOT Analysis
- 12.1.26 Studio
- 12.1.26.1. Company Overview
- 12.1.26.2. Products
- 12.1.26.3. Company Financials
- 12.1.26.4. SWOT Analysis
- 12.1.27 Galvanize
- 12.1.27.1. Company Overview
- 12.1.27.2. Products
- 12.1.27.3. Company Financials
- 12.1.27.4. SWOT Analysis
- 12.1.28 ATLAS Workplace
- 12.1.28.1. Company Overview
- 12.1.28.2. Products
- 12.1.28.3. Company Financials
- 12.1.28.4. SWOT Analysis
- 12.1.29 Greendesk
- 12.1.29.1. Company Overview
- 12.1.29.2. Products
- 12.1.29.3. Company Financials
- 12.1.29.4. SWOT Analysis
- 12.1.30 IC Coworking
- 12.1.30.1. Company Overview
- 12.1.30.2. Products
- 12.1.30.3. Company Financials
- 12.1.30.4. SWOT Analysis
- 12.1.1 Regus Group Companies
- 12.2. Market Entropy
- 12.2.1 Company's Key Areas Served
- 12.2.2 Recent Developments
- 12.3. Company Market Share Analysis 2025
- 12.3.1 Top 5 Companies Market Share Analysis
- 12.3.2 Top 3 Companies Market Share Analysis
- 12.4. List of Potential Customers
- 13. Research Methodology
List of Figures
- Figure 1: Global Coworking Space Revenue Breakdown (million, %) by Region 2025 & 2033
- Figure 2: North America Coworking Space Revenue (million), by Application 2025 & 2033
- Figure 3: North America Coworking Space Revenue Share (%), by Application 2025 & 2033
- Figure 4: North America Coworking Space Revenue (million), by Type 2025 & 2033
- Figure 5: North America Coworking Space Revenue Share (%), by Type 2025 & 2033
- Figure 6: North America Coworking Space Revenue (million), by Country 2025 & 2033
- Figure 7: North America Coworking Space Revenue Share (%), by Country 2025 & 2033
- Figure 8: South America Coworking Space Revenue (million), by Application 2025 & 2033
- Figure 9: South America Coworking Space Revenue Share (%), by Application 2025 & 2033
- Figure 10: South America Coworking Space Revenue (million), by Type 2025 & 2033
- Figure 11: South America Coworking Space Revenue Share (%), by Type 2025 & 2033
- Figure 12: South America Coworking Space Revenue (million), by Country 2025 & 2033
- Figure 13: South America Coworking Space Revenue Share (%), by Country 2025 & 2033
- Figure 14: Europe Coworking Space Revenue (million), by Application 2025 & 2033
- Figure 15: Europe Coworking Space Revenue Share (%), by Application 2025 & 2033
- Figure 16: Europe Coworking Space Revenue (million), by Type 2025 & 2033
- Figure 17: Europe Coworking Space Revenue Share (%), by Type 2025 & 2033
- Figure 18: Europe Coworking Space Revenue (million), by Country 2025 & 2033
- Figure 19: Europe Coworking Space Revenue Share (%), by Country 2025 & 2033
- Figure 20: Middle East & Africa Coworking Space Revenue (million), by Application 2025 & 2033
- Figure 21: Middle East & Africa Coworking Space Revenue Share (%), by Application 2025 & 2033
- Figure 22: Middle East & Africa Coworking Space Revenue (million), by Type 2025 & 2033
- Figure 23: Middle East & Africa Coworking Space Revenue Share (%), by Type 2025 & 2033
- Figure 24: Middle East & Africa Coworking Space Revenue (million), by Country 2025 & 2033
- Figure 25: Middle East & Africa Coworking Space Revenue Share (%), by Country 2025 & 2033
- Figure 26: Asia Pacific Coworking Space Revenue (million), by Application 2025 & 2033
- Figure 27: Asia Pacific Coworking Space Revenue Share (%), by Application 2025 & 2033
- Figure 28: Asia Pacific Coworking Space Revenue (million), by Type 2025 & 2033
- Figure 29: Asia Pacific Coworking Space Revenue Share (%), by Type 2025 & 2033
- Figure 30: Asia Pacific Coworking Space Revenue (million), by Country 2025 & 2033
- Figure 31: Asia Pacific Coworking Space Revenue Share (%), by Country 2025 & 2033
List of Tables
- Table 1: Global Coworking Space Revenue million Forecast, by Application 2020 & 2033
- Table 2: Global Coworking Space Revenue million Forecast, by Type 2020 & 2033
- Table 3: Global Coworking Space Revenue million Forecast, by Region 2020 & 2033
- Table 4: Global Coworking Space Revenue million Forecast, by Application 2020 & 2033
- Table 5: Global Coworking Space Revenue million Forecast, by Type 2020 & 2033
- Table 6: Global Coworking Space Revenue million Forecast, by Country 2020 & 2033
- Table 7: United States Coworking Space Revenue (million) Forecast, by Application 2020 & 2033
- Table 8: Canada Coworking Space Revenue (million) Forecast, by Application 2020 & 2033
- Table 9: Mexico Coworking Space Revenue (million) Forecast, by Application 2020 & 2033
- Table 10: Global Coworking Space Revenue million Forecast, by Application 2020 & 2033
- Table 11: Global Coworking Space Revenue million Forecast, by Type 2020 & 2033
- Table 12: Global Coworking Space Revenue million Forecast, by Country 2020 & 2033
- Table 13: Brazil Coworking Space Revenue (million) Forecast, by Application 2020 & 2033
- Table 14: Argentina Coworking Space Revenue (million) Forecast, by Application 2020 & 2033
- Table 15: Rest of South America Coworking Space Revenue (million) Forecast, by Application 2020 & 2033
- Table 16: Global Coworking Space Revenue million Forecast, by Application 2020 & 2033
- Table 17: Global Coworking Space Revenue million Forecast, by Type 2020 & 2033
- Table 18: Global Coworking Space Revenue million Forecast, by Country 2020 & 2033
- Table 19: United Kingdom Coworking Space Revenue (million) Forecast, by Application 2020 & 2033
- Table 20: Germany Coworking Space Revenue (million) Forecast, by Application 2020 & 2033
- Table 21: France Coworking Space Revenue (million) Forecast, by Application 2020 & 2033
- Table 22: Italy Coworking Space Revenue (million) Forecast, by Application 2020 & 2033
- Table 23: Spain Coworking Space Revenue (million) Forecast, by Application 2020 & 2033
- Table 24: Russia Coworking Space Revenue (million) Forecast, by Application 2020 & 2033
- Table 25: Benelux Coworking Space Revenue (million) Forecast, by Application 2020 & 2033
- Table 26: Nordics Coworking Space Revenue (million) Forecast, by Application 2020 & 2033
- Table 27: Rest of Europe Coworking Space Revenue (million) Forecast, by Application 2020 & 2033
- Table 28: Global Coworking Space Revenue million Forecast, by Application 2020 & 2033
- Table 29: Global Coworking Space Revenue million Forecast, by Type 2020 & 2033
- Table 30: Global Coworking Space Revenue million Forecast, by Country 2020 & 2033
- Table 31: Turkey Coworking Space Revenue (million) Forecast, by Application 2020 & 2033
- Table 32: Israel Coworking Space Revenue (million) Forecast, by Application 2020 & 2033
- Table 33: GCC Coworking Space Revenue (million) Forecast, by Application 2020 & 2033
- Table 34: North Africa Coworking Space Revenue (million) Forecast, by Application 2020 & 2033
- Table 35: South Africa Coworking Space Revenue (million) Forecast, by Application 2020 & 2033
- Table 36: Rest of Middle East & Africa Coworking Space Revenue (million) Forecast, by Application 2020 & 2033
- Table 37: Global Coworking Space Revenue million Forecast, by Application 2020 & 2033
- Table 38: Global Coworking Space Revenue million Forecast, by Type 2020 & 2033
- Table 39: Global Coworking Space Revenue million Forecast, by Country 2020 & 2033
- Table 40: China Coworking Space Revenue (million) Forecast, by Application 2020 & 2033
- Table 41: India Coworking Space Revenue (million) Forecast, by Application 2020 & 2033
- Table 42: Japan Coworking Space Revenue (million) Forecast, by Application 2020 & 2033
- Table 43: South Korea Coworking Space Revenue (million) Forecast, by Application 2020 & 2033
- Table 44: ASEAN Coworking Space Revenue (million) Forecast, by Application 2020 & 2033
- Table 45: Oceania Coworking Space Revenue (million) Forecast, by Application 2020 & 2033
- Table 46: Rest of Asia Pacific Coworking Space Revenue (million) Forecast, by Application 2020 & 2033
Frequently Asked Questions
1. What is the projected Compound Annual Growth Rate (CAGR) of the Coworking Space?
The projected CAGR is approximately 8.5%.
2. Which companies are prominent players in the Coworking Space?
Key companies in the market include Regus Group Companies, Techspace Inc., Knotel Inc., Simplywork, Talent Garden S.p. A, Premier Workspaces, Kr Space, Convene, Servcorp Limited, Wework Management Llc, UCOMMUNE, Workbar, Hera Hub, Impact Hub, Venture X, Cowork at District, Serendipity Labs, IWG, Industrious, Membership Collective Group (MCG), The Hive Jinnan, Shenzhen Cfg Business Services, JustCo, Awfis, Distrii, Studio, Galvanize, ATLAS Workplace, Greendesk, IC Coworking.
3. What are the main segments of the Coworking Space?
The market segments include Application, Type.
4. Can you provide details about the market size?
The market size is estimated to be USD 13230 million as of 2022.
5. What are some drivers contributing to market growth?
N/A
6. What are the notable trends driving market growth?
N/A
7. Are there any restraints impacting market growth?
N/A
8. Can you provide examples of recent developments in the market?
N/A
9. What pricing options are available for accessing the report?
Pricing options include single-user, multi-user, and enterprise licenses priced at USD 2900.00, USD 4350.00, and USD 5800.00 respectively.
10. Is the market size provided in terms of value or volume?
The market size is provided in terms of value, measured in million.
11. Are there any specific market keywords associated with the report?
Yes, the market keyword associated with the report is "Coworking Space," which aids in identifying and referencing the specific market segment covered.
12. How do I determine which pricing option suits my needs best?
The pricing options vary based on user requirements and access needs. Individual users may opt for single-user licenses, while businesses requiring broader access may choose multi-user or enterprise licenses for cost-effective access to the report.
13. Are there any additional resources or data provided in the Coworking Space report?
While the report offers comprehensive insights, it's advisable to review the specific contents or supplementary materials provided to ascertain if additional resources or data are available.
14. How can I stay updated on further developments or reports in the Coworking Space?
To stay informed about further developments, trends, and reports in the Coworking Space, consider subscribing to industry newsletters, following relevant companies and organizations, or regularly checking reputable industry news sources and publications.
Methodology
Step 1 - Identification of Relevant Samples Size from Population Database


Step 2 - Approaches for Defining Global Market Size (Value, Volume* & Price*)

Note*: In applicable scenarios
Step 3 - Data Sources
Primary Research
- Web Analytics
- Survey Reports
- Research Institute
- Latest Research Reports
- Opinion Leaders
Secondary Research
- Annual Reports
- White Paper
- Latest Press Release
- Industry Association
- Paid Database
- Investor Presentations

Step 4 - Data Triangulation
Involves using different sources of information in order to increase the validity of a study
These sources are likely to be stakeholders in a program - participants, other researchers, program staff, other community members, and so on.
Then we put all data in single framework & apply various statistical tools to find out the dynamic on the market.
During the analysis stage, feedback from the stakeholder groups would be compared to determine areas of agreement as well as areas of divergence