

Key Insights
The global cranberry market, valued at approximately $2.9 billion in 2025, is projected to achieve a robust compound annual growth rate (CAGR) of 4.2% from 2025 to 2033. This expansion is propelled by heightened consumer awareness of cranberry's significant health benefits, including urinary tract support and potent antioxidant properties. Consequently, demand is rising for fresh, processed, and value-added cranberry products such as juices, sauces, and dietary supplements. Growth in the food and beverage sector, where cranberries are a popular ingredient, further stimulates market expansion. Additionally, the burgeoning health and wellness industry's focus on natural and functional foods is increasing the demand for cranberry-based supplements and pharmaceutical applications. Despite challenges like seasonal production and price volatility, the market outlook remains positive, supported by continuous product innovation and expanding global reach.
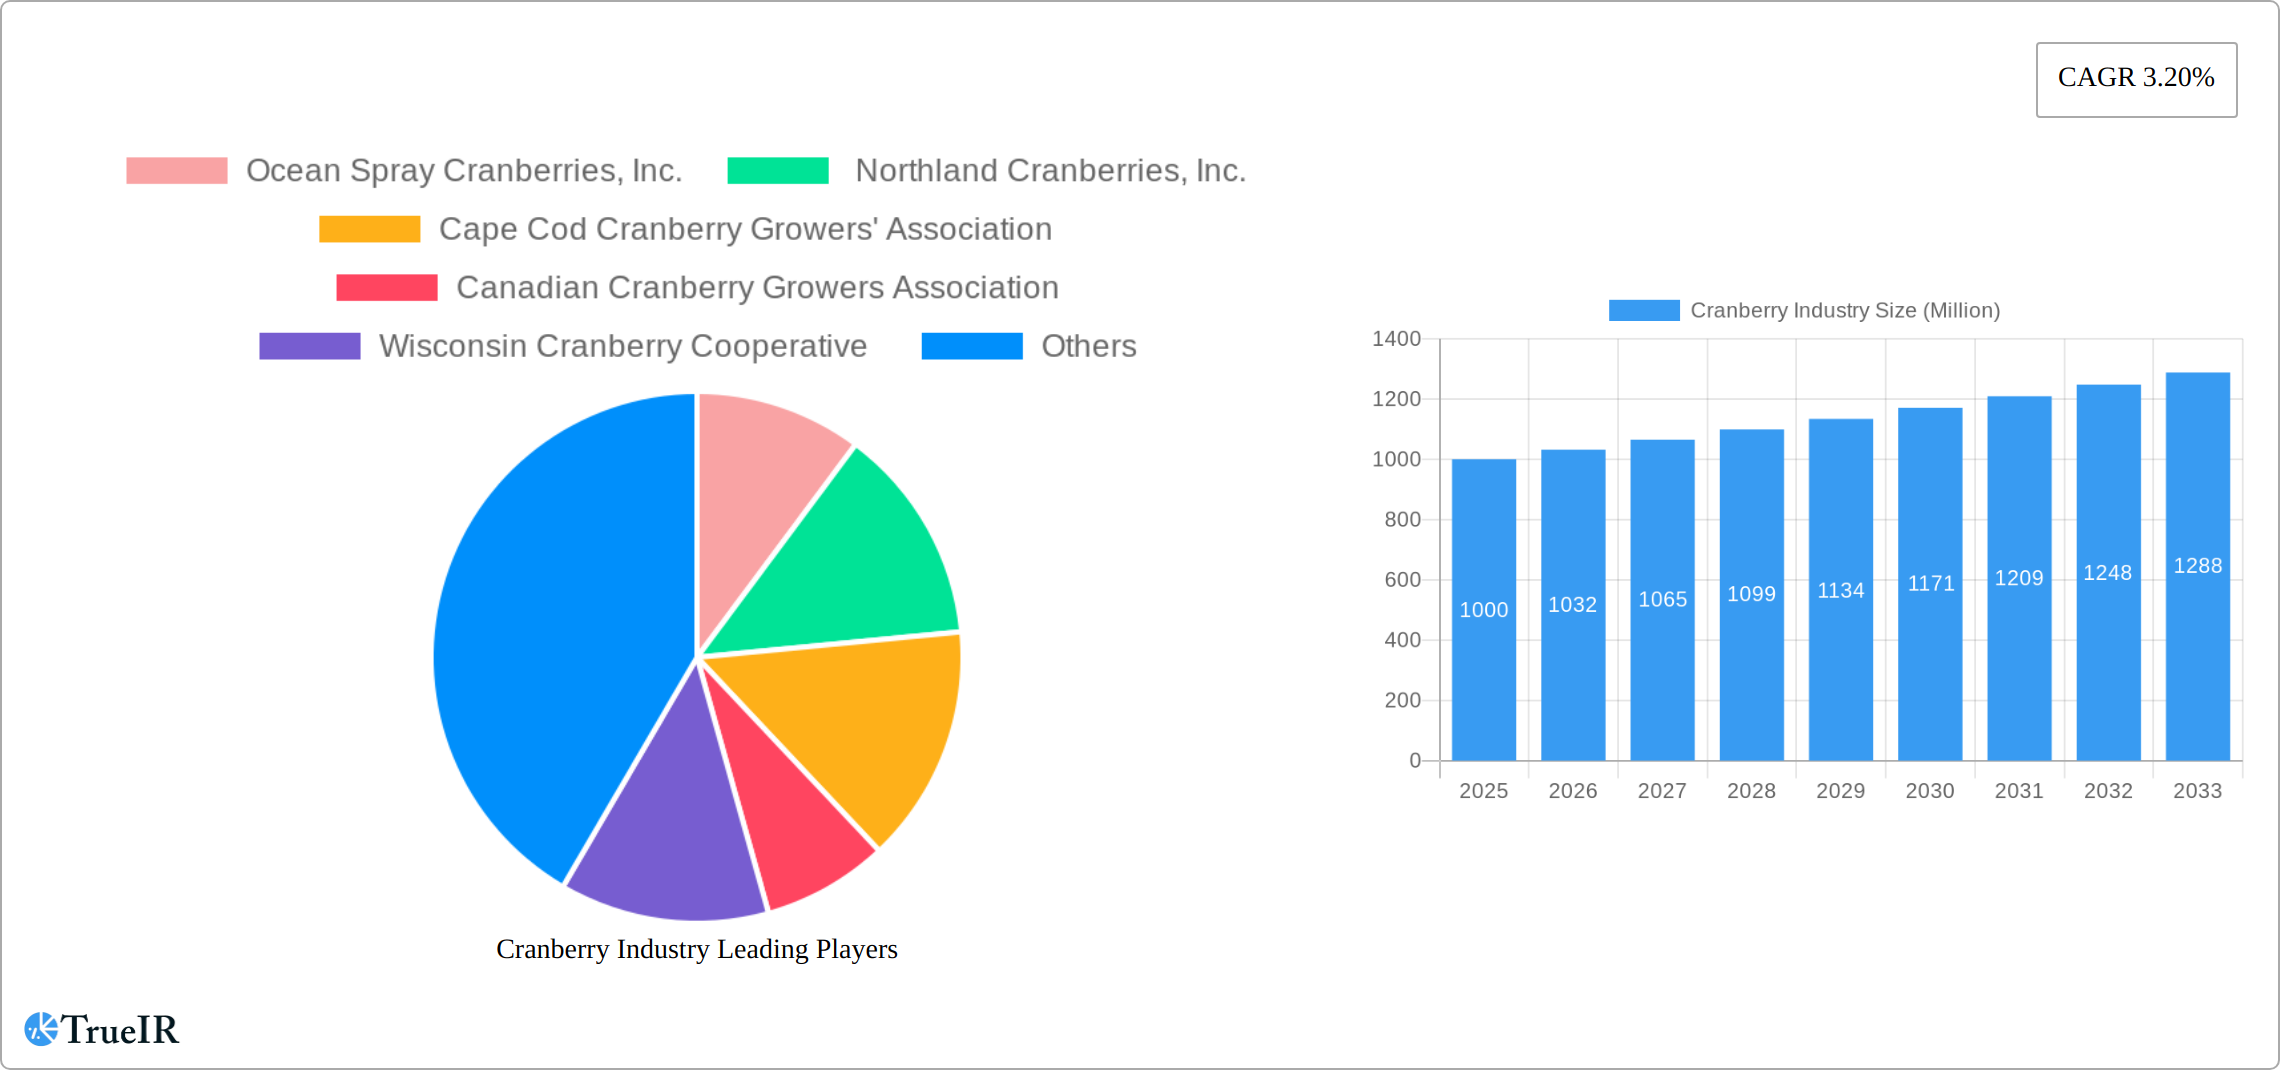
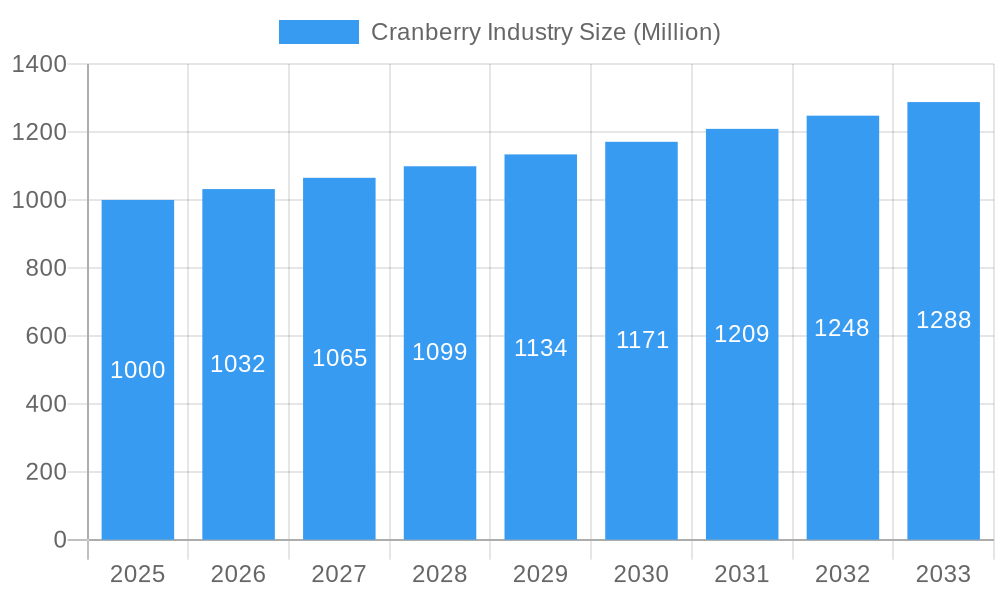
Cranberry Industry Market Size (In Billion)
North America, led by the United States, Canada, and Mexico, represents a primary hub for cranberry production and consumption. However, increasing health consciousness and market penetration in Asia-Pacific and Europe are driving significant growth in these regions. The market is segmented, with fresh cranberries holding a substantial share; however, the processed cranberry segment is experiencing accelerated growth due to its extended shelf life and convenience. Major industry players like Ocean Spray Cranberries, Inc. indicate a consolidated market structure, though smaller regional entities and cooperatives also play a vital role. Future growth will be significantly influenced by effective marketing campaigns emphasizing health advantages, product diversification, and strategic alliances for enhanced global distribution. Continued research into cranberry's therapeutic potential is expected to further boost its appeal in the pharmaceutical sector, ensuring sustained market expansion.
Cranberry Industry Company Market Share
Dynamic Cranberry Industry Report: 2019-2033
This comprehensive report delivers an in-depth analysis of the global cranberry industry, projecting a market valued at $XX Million by 2033. It provides crucial insights into market trends, competitive dynamics, and future growth potential, leveraging data from the historical period (2019-2024), base year (2025), and forecast period (2025-2033). This report is essential for businesses, investors, and researchers seeking to understand and capitalize on opportunities within this dynamic sector.
Cranberry Industry Market Structure & Competitive Landscape
The cranberry industry presents a moderately concentrated market structure, dominated by key players like Ocean Spray Cranberries, Inc., and Northland Cranberries, Inc., alongside various cooperative organizations controlling a substantial market share. While a four-firm concentration ratio of [Insert Updated Percentage]% indicates considerable market dominance, opportunities remain for smaller, agile competitors. Innovation is paramount, with companies investing heavily in value-added products and leveraging technological advancements for optimized processing and innovative product development. The industry is significantly impacted by regulatory frameworks, particularly stringent food safety and labeling regulations. Competitive pressure stems from readily available substitutes such as other berries and fruit juices. The market is segmented by product type (fresh, processed, value-added) and application (food & beverage, dietary supplements, pharmaceuticals, and even emerging uses in cosmetics and personal care). While mergers and acquisitions (M&A) activity remains moderate, strategic partnerships are increasingly favored for expansion, with an estimated annual M&A volume of [Insert Updated Amount] Million USD. This reflects a strategic shift towards collaborative growth rather than solely acquisitive expansion.
- Market Concentration: Moderately concentrated, with a four-firm concentration ratio of [Insert Updated Percentage]%.
- Innovation Drivers: Value-added products, technological advancements in processing, packaging, and extraction techniques.
- Regulatory Impacts: Stringent food safety regulations and evolving labeling requirements, including considerations for sustainability and ethical sourcing.
- Product Substitutes: Other berries, fruit juices, and an expanding range of dietary supplements and functional beverages.
- End-User Segmentation: Food & beverage, dietary supplements, pharmaceuticals, cosmetics, and personal care products.
- M&A Trends: Moderate activity, with strategic partnerships and joint ventures playing a significantly larger role than outright acquisitions.
Cranberry Industry Market Trends & Opportunities
The global cranberry market is experiencing robust growth, projected at a Compound Annual Growth Rate (CAGR) of [Insert Updated Percentage]% during the forecast period (2025-2033). This expansion is driven by several key factors: increasing consumer demand for healthy and functional foods, the surging popularity of dietary supplements and functional foods, and the continuous expansion of the food and beverage industry, particularly in health-conscious segments. Technological advancements in cranberry processing and extraction are enhancing product quality and efficiency, while a growing preference for natural and organic products further fuels demand. Competition is intensifying, with both established players and innovative startups vying for market share. North America retains the highest market penetration, followed by Europe and the rapidly expanding Asia-Pacific region. The integration of AI and data analytics is creating exciting opportunities for better understanding consumer preferences and optimizing product development. By 2033, the market size is projected to reach [Insert Updated Amount] Million USD.
Dominant Markets & Segments in Cranberry Industry
The North American region, particularly the United States and Canada, remains the dominant market for cranberries, owing to established production capacity, a strong consumer base, and supportive infrastructure. Within product types, processed cranberries contribute the largest share of the market, driven by their versatility in applications. However, value-added products are experiencing the fastest growth due to increasing consumer demand for convenience and premium products. Within applications, the food and beverage sector continues to be the major driver of market demand, followed by dietary supplements.
- Key Growth Drivers (North America): Established production infrastructure, strong consumer base, favorable regulatory environment.
- Processed Cranberries: Dominant product type due to its versatility and extensive use in various food and beverage applications.
- Value-Added Products: Fastest-growing segment owing to growing demand for convenience and premium products.
- Food & Beverage Application: Largest application segment, representing a significant portion of total market demand.
Cranberry Industry Product Analysis
Cranberry product innovation is focused on developing unique value-added products, including highly concentrated cranberry extracts and specialized dietary supplements. Concurrent improvements in processing and packaging technologies ensure the preservation of nutritional value and extend shelf life, enhancing product quality and consumer appeal. A competitive edge lies in delivering superior quality, sustainably sourced cranberries with distinctive flavor profiles and scientifically substantiated health benefits. Key technological advancements encompass improved extraction techniques to maximize the yield of beneficial compounds (like proanthocyanidins), and innovative packaging solutions that prolong shelf life and enhance product aesthetics and convenience.
Key Drivers, Barriers & Challenges in Cranberry Industry
Key Drivers: Growing consumer awareness of health benefits, increasing demand for functional foods and dietary supplements, technological advancements in processing and extraction, and supportive government policies promoting agricultural development.
Challenges: Fluctuating raw material prices, intense competition, stringent regulatory requirements impacting production and labeling, and potential supply chain disruptions due to climate change and weather patterns. These challenges could collectively reduce market growth by approximately xx% by 2033.
Growth Drivers in the Cranberry Industry Market
The cranberry market is fueled by the growing demand for healthy and functional foods, technological innovations enhancing product quality and efficiency, supportive government policies promoting agricultural development, and the increasing popularity of dietary supplements which feature cranberry compounds.
Challenges Impacting Cranberry Industry Growth
Key challenges include fluctuating raw material prices, intense competition from substitute products, stringent regulatory requirements impacting production and labeling, and potential supply chain disruptions due to climate change and weather patterns.
Key Players Shaping the Cranberry Industry Market
- Ocean Spray Cranberries, Inc.
- Northland Cranberries, Inc.
- Cape Cod Cranberry Growers' Association
- Canadian Cranberry Growers Association
- Wisconsin Cranberry Cooperative
Significant Cranberry Industry Milestones
- November 2021: Ocean Spray Cranberries, Inc. partners with Brightseed, an AI-driven bioscience company, to explore the health benefits of cranberries using AI. This collaboration aims to discover new compounds and health benefits.
- March 2022: Ocean Spray Cranberries, Inc. partners with Canomiks to leverage AI to test and certify the biological efficacy of cranberries, further validating their health benefits.
Future Outlook for Cranberry Industry Market
The cranberry industry is poised for continued growth, fueled by ongoing innovation, expanding consumer awareness of health benefits, and successful expansion into new and emerging markets globally. Strategic partnerships, product diversification, and the adoption of advanced technologies will be instrumental in shaping the future of this dynamic industry. Further research into the comprehensive health benefits of cranberries and continuous new product development will be key to sustaining this positive growth trajectory.
Cranberry Industry Segmentation
- 1. Production Analysis
- 2. Consumption Analysis
- 3. Import Market Analysis (Value & Volume)
- 4. Export Market Analysis (Value & Volume)
- 5. Price Trend Analysis
Cranberry Industry Segmentation By Geography
-
1. North America
- 1.1. United States
-
2. Europe
- 2.1. Germany
-
3. Asia Pacific
- 3.1. China
-
4. South America
- 4.1. Chile
-
5. Africa
- 5.1. South Africa
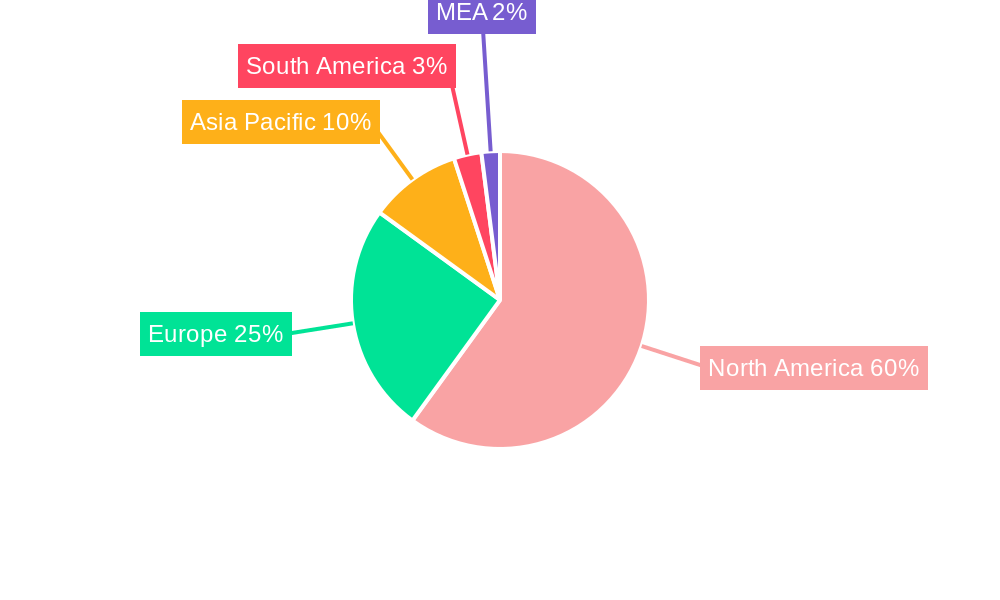
Cranberry Industry Regional Market Share
Geographic Coverage of Cranberry Industry
Cranberry Industry REPORT HIGHLIGHTS
| Aspects | Details |
|---|---|
| Study Period | 2020-2034 |
| Base Year | 2025 |
| Estimated Year | 2026 |
| Forecast Period | 2026-2034 |
| Historical Period | 2020-2025 |
| Growth Rate | CAGR of 4.2% from 2020-2034 |
| Segmentation |
|
Table of Contents
- 1. Introduction
- 1.1. Research Scope
- 1.2. Market Segmentation
- 1.3. Research Methodology
- 1.4. Definitions and Assumptions
- 2. Executive Summary
- 2.1. Introduction
- 3. Market Dynamics
- 3.1. Introduction
- 3.2. Market Drivers
- 3.2.1. Rise in Percentage of Area Harvested Under Almond Cultivation; Demand for Healthy Snacking Options
- 3.3. Market Restrains
- 3.3.1. Water Scarcity in Almond Producing Regions; Drop in the Prices of Almonds
- 3.4. Market Trends
- 3.4.1. Increasing Demand from Processing Industry
- 4. Market Factor Analysis
- 4.1. Porters Five Forces
- 4.2. Supply/Value Chain
- 4.3. PESTEL analysis
- 4.4. Market Entropy
- 4.5. Patent/Trademark Analysis
- 5. Global Cranberry Industry Analysis, Insights and Forecast, 2020-2032
- 5.1. Market Analysis, Insights and Forecast - by Production Analysis
- 5.2. Market Analysis, Insights and Forecast - by Consumption Analysis
- 5.3. Market Analysis, Insights and Forecast - by Import Market Analysis (Value & Volume)
- 5.4. Market Analysis, Insights and Forecast - by Export Market Analysis (Value & Volume)
- 5.5. Market Analysis, Insights and Forecast - by Price Trend Analysis
- 5.6. Market Analysis, Insights and Forecast - by Region
- 5.6.1. North America
- 5.6.2. Europe
- 5.6.3. Asia Pacific
- 5.6.4. South America
- 5.6.5. Africa
- 5.1. Market Analysis, Insights and Forecast - by Production Analysis
- 6. North America Cranberry Industry Analysis, Insights and Forecast, 2020-2032
- 6.1. Market Analysis, Insights and Forecast - by Production Analysis
- 6.2. Market Analysis, Insights and Forecast - by Consumption Analysis
- 6.3. Market Analysis, Insights and Forecast - by Import Market Analysis (Value & Volume)
- 6.4. Market Analysis, Insights and Forecast - by Export Market Analysis (Value & Volume)
- 6.5. Market Analysis, Insights and Forecast - by Price Trend Analysis
- 6.1. Market Analysis, Insights and Forecast - by Production Analysis
- 7. Europe Cranberry Industry Analysis, Insights and Forecast, 2020-2032
- 7.1. Market Analysis, Insights and Forecast - by Production Analysis
- 7.2. Market Analysis, Insights and Forecast - by Consumption Analysis
- 7.3. Market Analysis, Insights and Forecast - by Import Market Analysis (Value & Volume)
- 7.4. Market Analysis, Insights and Forecast - by Export Market Analysis (Value & Volume)
- 7.5. Market Analysis, Insights and Forecast - by Price Trend Analysis
- 7.1. Market Analysis, Insights and Forecast - by Production Analysis
- 8. Asia Pacific Cranberry Industry Analysis, Insights and Forecast, 2020-2032
- 8.1. Market Analysis, Insights and Forecast - by Production Analysis
- 8.2. Market Analysis, Insights and Forecast - by Consumption Analysis
- 8.3. Market Analysis, Insights and Forecast - by Import Market Analysis (Value & Volume)
- 8.4. Market Analysis, Insights and Forecast - by Export Market Analysis (Value & Volume)
- 8.5. Market Analysis, Insights and Forecast - by Price Trend Analysis
- 8.1. Market Analysis, Insights and Forecast - by Production Analysis
- 9. South America Cranberry Industry Analysis, Insights and Forecast, 2020-2032
- 9.1. Market Analysis, Insights and Forecast - by Production Analysis
- 9.2. Market Analysis, Insights and Forecast - by Consumption Analysis
- 9.3. Market Analysis, Insights and Forecast - by Import Market Analysis (Value & Volume)
- 9.4. Market Analysis, Insights and Forecast - by Export Market Analysis (Value & Volume)
- 9.5. Market Analysis, Insights and Forecast - by Price Trend Analysis
- 9.1. Market Analysis, Insights and Forecast - by Production Analysis
- 10. Africa Cranberry Industry Analysis, Insights and Forecast, 2020-2032
- 10.1. Market Analysis, Insights and Forecast - by Production Analysis
- 10.2. Market Analysis, Insights and Forecast - by Consumption Analysis
- 10.3. Market Analysis, Insights and Forecast - by Import Market Analysis (Value & Volume)
- 10.4. Market Analysis, Insights and Forecast - by Export Market Analysis (Value & Volume)
- 10.5. Market Analysis, Insights and Forecast - by Price Trend Analysis
- 10.1. Market Analysis, Insights and Forecast - by Production Analysis
- 11. Competitive Analysis
- 11.1. Global Market Share Analysis 2025
- 11.2. Company Profiles
- 11.2.1 Ocean Spray Cranberries Inc.
- 11.2.1.1. Overview
- 11.2.1.2. Products
- 11.2.1.3. SWOT Analysis
- 11.2.1.4. Recent Developments
- 11.2.1.5. Financials (Based on Availability)
- 11.2.2 Northland Cranberries Inc.
- 11.2.2.1. Overview
- 11.2.2.2. Products
- 11.2.2.3. SWOT Analysis
- 11.2.2.4. Recent Developments
- 11.2.2.5. Financials (Based on Availability)
- 11.2.3 Cape Cod Cranberry Growers' Association
- 11.2.3.1. Overview
- 11.2.3.2. Products
- 11.2.3.3. SWOT Analysis
- 11.2.3.4. Recent Developments
- 11.2.3.5. Financials (Based on Availability)
- 11.2.4 Canadian Cranberry Growers Association
- 11.2.4.1. Overview
- 11.2.4.2. Products
- 11.2.4.3. SWOT Analysis
- 11.2.4.4. Recent Developments
- 11.2.4.5. Financials (Based on Availability)
- 11.2.5 Wisconsin Cranberry Cooperative
- 11.2.5.1. Overview
- 11.2.5.2. Products
- 11.2.5.3. SWOT Analysis
- 11.2.5.4. Recent Developments
- 11.2.5.5. Financials (Based on Availability)
- 11.2.1 Ocean Spray Cranberries Inc.
List of Figures
- Figure 1: Global Cranberry Industry Revenue Breakdown (billion, %) by Region 2025 & 2033
- Figure 2: North America Cranberry Industry Revenue (billion), by Production Analysis 2025 & 2033
- Figure 3: North America Cranberry Industry Revenue Share (%), by Production Analysis 2025 & 2033
- Figure 4: North America Cranberry Industry Revenue (billion), by Consumption Analysis 2025 & 2033
- Figure 5: North America Cranberry Industry Revenue Share (%), by Consumption Analysis 2025 & 2033
- Figure 6: North America Cranberry Industry Revenue (billion), by Import Market Analysis (Value & Volume) 2025 & 2033
- Figure 7: North America Cranberry Industry Revenue Share (%), by Import Market Analysis (Value & Volume) 2025 & 2033
- Figure 8: North America Cranberry Industry Revenue (billion), by Export Market Analysis (Value & Volume) 2025 & 2033
- Figure 9: North America Cranberry Industry Revenue Share (%), by Export Market Analysis (Value & Volume) 2025 & 2033
- Figure 10: North America Cranberry Industry Revenue (billion), by Price Trend Analysis 2025 & 2033
- Figure 11: North America Cranberry Industry Revenue Share (%), by Price Trend Analysis 2025 & 2033
- Figure 12: North America Cranberry Industry Revenue (billion), by Country 2025 & 2033
- Figure 13: North America Cranberry Industry Revenue Share (%), by Country 2025 & 2033
- Figure 14: Europe Cranberry Industry Revenue (billion), by Production Analysis 2025 & 2033
- Figure 15: Europe Cranberry Industry Revenue Share (%), by Production Analysis 2025 & 2033
- Figure 16: Europe Cranberry Industry Revenue (billion), by Consumption Analysis 2025 & 2033
- Figure 17: Europe Cranberry Industry Revenue Share (%), by Consumption Analysis 2025 & 2033
- Figure 18: Europe Cranberry Industry Revenue (billion), by Import Market Analysis (Value & Volume) 2025 & 2033
- Figure 19: Europe Cranberry Industry Revenue Share (%), by Import Market Analysis (Value & Volume) 2025 & 2033
- Figure 20: Europe Cranberry Industry Revenue (billion), by Export Market Analysis (Value & Volume) 2025 & 2033
- Figure 21: Europe Cranberry Industry Revenue Share (%), by Export Market Analysis (Value & Volume) 2025 & 2033
- Figure 22: Europe Cranberry Industry Revenue (billion), by Price Trend Analysis 2025 & 2033
- Figure 23: Europe Cranberry Industry Revenue Share (%), by Price Trend Analysis 2025 & 2033
- Figure 24: Europe Cranberry Industry Revenue (billion), by Country 2025 & 2033
- Figure 25: Europe Cranberry Industry Revenue Share (%), by Country 2025 & 2033
- Figure 26: Asia Pacific Cranberry Industry Revenue (billion), by Production Analysis 2025 & 2033
- Figure 27: Asia Pacific Cranberry Industry Revenue Share (%), by Production Analysis 2025 & 2033
- Figure 28: Asia Pacific Cranberry Industry Revenue (billion), by Consumption Analysis 2025 & 2033
- Figure 29: Asia Pacific Cranberry Industry Revenue Share (%), by Consumption Analysis 2025 & 2033
- Figure 30: Asia Pacific Cranberry Industry Revenue (billion), by Import Market Analysis (Value & Volume) 2025 & 2033
- Figure 31: Asia Pacific Cranberry Industry Revenue Share (%), by Import Market Analysis (Value & Volume) 2025 & 2033
- Figure 32: Asia Pacific Cranberry Industry Revenue (billion), by Export Market Analysis (Value & Volume) 2025 & 2033
- Figure 33: Asia Pacific Cranberry Industry Revenue Share (%), by Export Market Analysis (Value & Volume) 2025 & 2033
- Figure 34: Asia Pacific Cranberry Industry Revenue (billion), by Price Trend Analysis 2025 & 2033
- Figure 35: Asia Pacific Cranberry Industry Revenue Share (%), by Price Trend Analysis 2025 & 2033
- Figure 36: Asia Pacific Cranberry Industry Revenue (billion), by Country 2025 & 2033
- Figure 37: Asia Pacific Cranberry Industry Revenue Share (%), by Country 2025 & 2033
- Figure 38: South America Cranberry Industry Revenue (billion), by Production Analysis 2025 & 2033
- Figure 39: South America Cranberry Industry Revenue Share (%), by Production Analysis 2025 & 2033
- Figure 40: South America Cranberry Industry Revenue (billion), by Consumption Analysis 2025 & 2033
- Figure 41: South America Cranberry Industry Revenue Share (%), by Consumption Analysis 2025 & 2033
- Figure 42: South America Cranberry Industry Revenue (billion), by Import Market Analysis (Value & Volume) 2025 & 2033
- Figure 43: South America Cranberry Industry Revenue Share (%), by Import Market Analysis (Value & Volume) 2025 & 2033
- Figure 44: South America Cranberry Industry Revenue (billion), by Export Market Analysis (Value & Volume) 2025 & 2033
- Figure 45: South America Cranberry Industry Revenue Share (%), by Export Market Analysis (Value & Volume) 2025 & 2033
- Figure 46: South America Cranberry Industry Revenue (billion), by Price Trend Analysis 2025 & 2033
- Figure 47: South America Cranberry Industry Revenue Share (%), by Price Trend Analysis 2025 & 2033
- Figure 48: South America Cranberry Industry Revenue (billion), by Country 2025 & 2033
- Figure 49: South America Cranberry Industry Revenue Share (%), by Country 2025 & 2033
- Figure 50: Africa Cranberry Industry Revenue (billion), by Production Analysis 2025 & 2033
- Figure 51: Africa Cranberry Industry Revenue Share (%), by Production Analysis 2025 & 2033
- Figure 52: Africa Cranberry Industry Revenue (billion), by Consumption Analysis 2025 & 2033
- Figure 53: Africa Cranberry Industry Revenue Share (%), by Consumption Analysis 2025 & 2033
- Figure 54: Africa Cranberry Industry Revenue (billion), by Import Market Analysis (Value & Volume) 2025 & 2033
- Figure 55: Africa Cranberry Industry Revenue Share (%), by Import Market Analysis (Value & Volume) 2025 & 2033
- Figure 56: Africa Cranberry Industry Revenue (billion), by Export Market Analysis (Value & Volume) 2025 & 2033
- Figure 57: Africa Cranberry Industry Revenue Share (%), by Export Market Analysis (Value & Volume) 2025 & 2033
- Figure 58: Africa Cranberry Industry Revenue (billion), by Price Trend Analysis 2025 & 2033
- Figure 59: Africa Cranberry Industry Revenue Share (%), by Price Trend Analysis 2025 & 2033
- Figure 60: Africa Cranberry Industry Revenue (billion), by Country 2025 & 2033
- Figure 61: Africa Cranberry Industry Revenue Share (%), by Country 2025 & 2033
List of Tables
- Table 1: Global Cranberry Industry Revenue billion Forecast, by Production Analysis 2020 & 2033
- Table 2: Global Cranberry Industry Revenue billion Forecast, by Consumption Analysis 2020 & 2033
- Table 3: Global Cranberry Industry Revenue billion Forecast, by Import Market Analysis (Value & Volume) 2020 & 2033
- Table 4: Global Cranberry Industry Revenue billion Forecast, by Export Market Analysis (Value & Volume) 2020 & 2033
- Table 5: Global Cranberry Industry Revenue billion Forecast, by Price Trend Analysis 2020 & 2033
- Table 6: Global Cranberry Industry Revenue billion Forecast, by Region 2020 & 2033
- Table 7: Global Cranberry Industry Revenue billion Forecast, by Production Analysis 2020 & 2033
- Table 8: Global Cranberry Industry Revenue billion Forecast, by Consumption Analysis 2020 & 2033
- Table 9: Global Cranberry Industry Revenue billion Forecast, by Import Market Analysis (Value & Volume) 2020 & 2033
- Table 10: Global Cranberry Industry Revenue billion Forecast, by Export Market Analysis (Value & Volume) 2020 & 2033
- Table 11: Global Cranberry Industry Revenue billion Forecast, by Price Trend Analysis 2020 & 2033
- Table 12: Global Cranberry Industry Revenue billion Forecast, by Country 2020 & 2033
- Table 13: United States Cranberry Industry Revenue (billion) Forecast, by Application 2020 & 2033
- Table 14: Global Cranberry Industry Revenue billion Forecast, by Production Analysis 2020 & 2033
- Table 15: Global Cranberry Industry Revenue billion Forecast, by Consumption Analysis 2020 & 2033
- Table 16: Global Cranberry Industry Revenue billion Forecast, by Import Market Analysis (Value & Volume) 2020 & 2033
- Table 17: Global Cranberry Industry Revenue billion Forecast, by Export Market Analysis (Value & Volume) 2020 & 2033
- Table 18: Global Cranberry Industry Revenue billion Forecast, by Price Trend Analysis 2020 & 2033
- Table 19: Global Cranberry Industry Revenue billion Forecast, by Country 2020 & 2033
- Table 20: Germany Cranberry Industry Revenue (billion) Forecast, by Application 2020 & 2033
- Table 21: Global Cranberry Industry Revenue billion Forecast, by Production Analysis 2020 & 2033
- Table 22: Global Cranberry Industry Revenue billion Forecast, by Consumption Analysis 2020 & 2033
- Table 23: Global Cranberry Industry Revenue billion Forecast, by Import Market Analysis (Value & Volume) 2020 & 2033
- Table 24: Global Cranberry Industry Revenue billion Forecast, by Export Market Analysis (Value & Volume) 2020 & 2033
- Table 25: Global Cranberry Industry Revenue billion Forecast, by Price Trend Analysis 2020 & 2033
- Table 26: Global Cranberry Industry Revenue billion Forecast, by Country 2020 & 2033
- Table 27: China Cranberry Industry Revenue (billion) Forecast, by Application 2020 & 2033
- Table 28: Global Cranberry Industry Revenue billion Forecast, by Production Analysis 2020 & 2033
- Table 29: Global Cranberry Industry Revenue billion Forecast, by Consumption Analysis 2020 & 2033
- Table 30: Global Cranberry Industry Revenue billion Forecast, by Import Market Analysis (Value & Volume) 2020 & 2033
- Table 31: Global Cranberry Industry Revenue billion Forecast, by Export Market Analysis (Value & Volume) 2020 & 2033
- Table 32: Global Cranberry Industry Revenue billion Forecast, by Price Trend Analysis 2020 & 2033
- Table 33: Global Cranberry Industry Revenue billion Forecast, by Country 2020 & 2033
- Table 34: Chile Cranberry Industry Revenue (billion) Forecast, by Application 2020 & 2033
- Table 35: Global Cranberry Industry Revenue billion Forecast, by Production Analysis 2020 & 2033
- Table 36: Global Cranberry Industry Revenue billion Forecast, by Consumption Analysis 2020 & 2033
- Table 37: Global Cranberry Industry Revenue billion Forecast, by Import Market Analysis (Value & Volume) 2020 & 2033
- Table 38: Global Cranberry Industry Revenue billion Forecast, by Export Market Analysis (Value & Volume) 2020 & 2033
- Table 39: Global Cranberry Industry Revenue billion Forecast, by Price Trend Analysis 2020 & 2033
- Table 40: Global Cranberry Industry Revenue billion Forecast, by Country 2020 & 2033
- Table 41: South Africa Cranberry Industry Revenue (billion) Forecast, by Application 2020 & 2033
Frequently Asked Questions
1. What is the projected Compound Annual Growth Rate (CAGR) of the Cranberry Industry?
The projected CAGR is approximately 4.2%.
2. Which companies are prominent players in the Cranberry Industry?
Key companies in the market include Ocean Spray Cranberries, Inc. , Northland Cranberries, Inc. , Cape Cod Cranberry Growers' Association , Canadian Cranberry Growers Association, Wisconsin Cranberry Cooperative .
3. What are the main segments of the Cranberry Industry?
The market segments include Production Analysis, Consumption Analysis, Import Market Analysis (Value & Volume), Export Market Analysis (Value & Volume), Price Trend Analysis.
4. Can you provide details about the market size?
The market size is estimated to be USD 2.9 billion as of 2022.
5. What are some drivers contributing to market growth?
Rise in Percentage of Area Harvested Under Almond Cultivation; Demand for Healthy Snacking Options.
6. What are the notable trends driving market growth?
Increasing Demand from Processing Industry.
7. Are there any restraints impacting market growth?
Water Scarcity in Almond Producing Regions; Drop in the Prices of Almonds.
8. Can you provide examples of recent developments in the market?
March 2022: Ocean Spray Cranberries, Inc., the agricultural cooperative owned by more than 700 farmer families, and Canomiks, a startup technology company transforming the functional food and beverage industry, announced research leveraging Canomiks' A.I. based technology platform to test and certify the biological efficacy of the cranberry. The relationship with Canomiks, through Ocean Spray's existing partnership with the incubator Plug and Play, enables the company further to validate the superfruit nature of cranberry's biological efficacy.
9. What pricing options are available for accessing the report?
Pricing options include single-user, multi-user, and enterprise licenses priced at USD 4750, USD 5250, and USD 8750 respectively.
10. Is the market size provided in terms of value or volume?
The market size is provided in terms of value, measured in billion.
11. Are there any specific market keywords associated with the report?
Yes, the market keyword associated with the report is "Cranberry Industry," which aids in identifying and referencing the specific market segment covered.
12. How do I determine which pricing option suits my needs best?
The pricing options vary based on user requirements and access needs. Individual users may opt for single-user licenses, while businesses requiring broader access may choose multi-user or enterprise licenses for cost-effective access to the report.
13. Are there any additional resources or data provided in the Cranberry Industry report?
While the report offers comprehensive insights, it's advisable to review the specific contents or supplementary materials provided to ascertain if additional resources or data are available.
14. How can I stay updated on further developments or reports in the Cranberry Industry?
To stay informed about further developments, trends, and reports in the Cranberry Industry, consider subscribing to industry newsletters, following relevant companies and organizations, or regularly checking reputable industry news sources and publications.
Methodology
Step 1 - Identification of Relevant Samples Size from Population Database


Step 2 - Approaches for Defining Global Market Size (Value, Volume* & Price*)

Note*: In applicable scenarios
Step 3 - Data Sources
Primary Research
- Web Analytics
- Survey Reports
- Research Institute
- Latest Research Reports
- Opinion Leaders
Secondary Research
- Annual Reports
- White Paper
- Latest Press Release
- Industry Association
- Paid Database
- Investor Presentations

Step 4 - Data Triangulation
Involves using different sources of information in order to increase the validity of a study
These sources are likely to be stakeholders in a program - participants, other researchers, program staff, other community members, and so on.
Then we put all data in single framework & apply various statistical tools to find out the dynamic on the market.
During the analysis stage, feedback from the stakeholder groups would be compared to determine areas of agreement as well as areas of divergence