

Key Insights
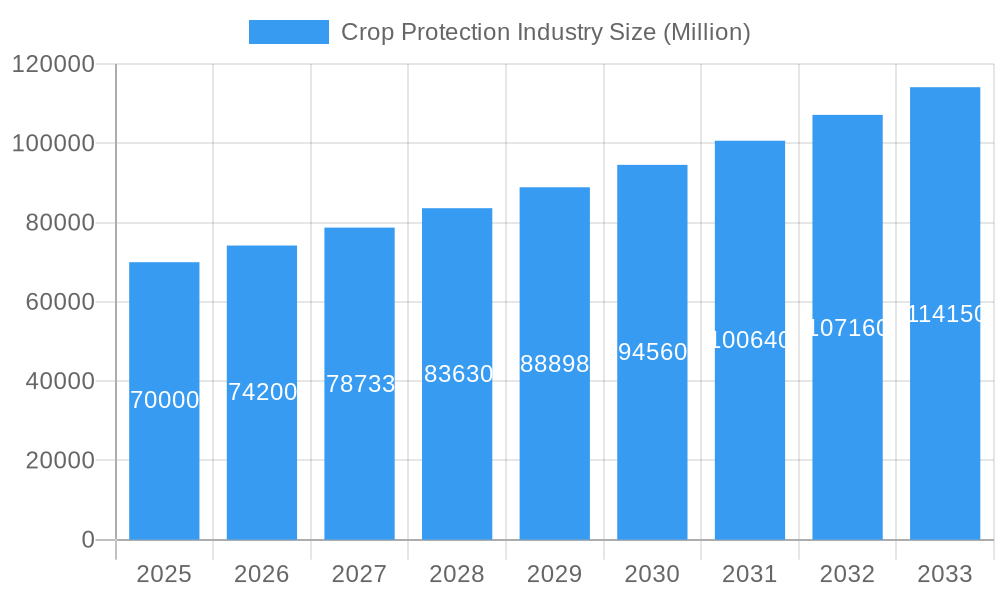
The global crop protection market, valued at approximately $70 billion in 2025, is experiencing robust growth, projected to reach $100 billion by 2033, exhibiting a Compound Annual Growth Rate (CAGR) of 5.60%. This expansion is driven by several key factors. Increasing global population necessitates higher agricultural yields to meet food demands, fueling the demand for effective crop protection solutions. Simultaneously, climate change is intensifying pest and disease outbreaks, necessitating more sophisticated and targeted crop protection strategies. The shift towards high-value crops, like fruits and vegetables, further contributes to market growth due to their increased susceptibility to pests and diseases, demanding higher protection investment. Technological advancements in formulation and application methods, such as targeted delivery systems and biological control agents, are also shaping the market landscape. Growth is observed across various segments, including insecticides, fungicides, and herbicides, alongside application methods like foliar spraying, seed treatment, and chemigation. Leading players like FMC Corporation, Syngenta, and Bayer are driving innovation and market consolidation through mergers, acquisitions, and R&D investments.
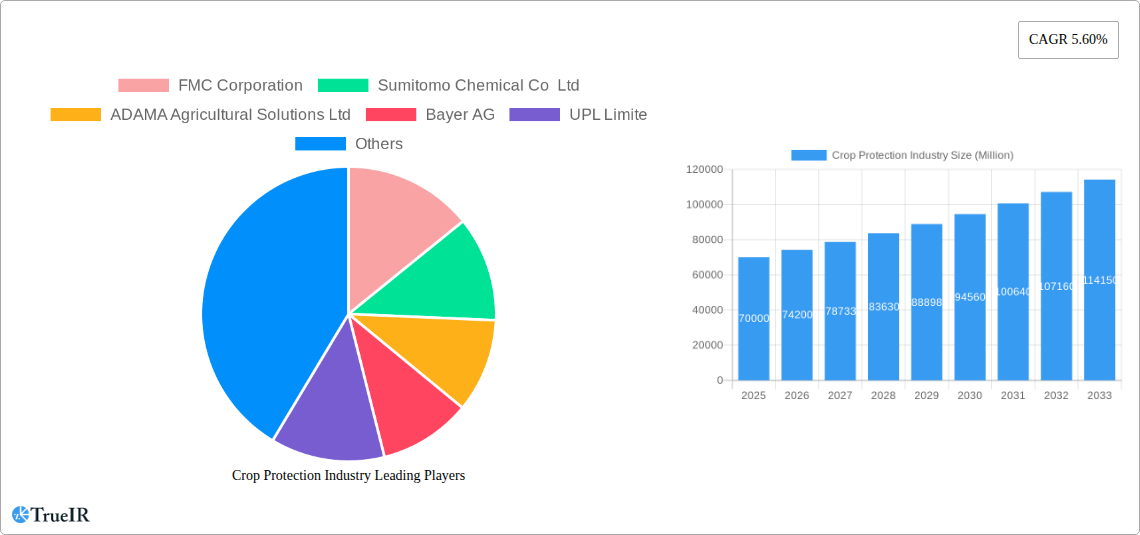
Crop Protection Industry Market Size (In Billion)
However, the market faces certain restraints. Stringent regulatory frameworks regarding pesticide use, particularly concerning environmental safety and human health, pose significant challenges. The growing consumer awareness of the environmental impact of synthetic pesticides is driving demand for organic and bio-based alternatives, presenting both opportunities and challenges for manufacturers. Fluctuations in agricultural commodity prices and economic downturns can impact farmer spending on crop protection solutions, creating market volatility. Furthermore, the development of pesticide resistance in pests demands continuous innovation and the development of new active ingredients, increasing R&D costs. Despite these challenges, the overall market outlook remains positive, driven by the imperative to enhance food security and address the increasing threats posed by pests and diseases to global agriculture. Regional variations in market growth will be influenced by factors like agricultural practices, regulatory environments, and economic conditions.
Crop Protection Industry Company Market Share
Crop Protection Industry Market Report: 2019-2033
This comprehensive report provides an in-depth analysis of the global crop protection industry, encompassing market size, segmentation, competitive landscape, and future growth projections. The study period covers 2019-2033, with a base year of 2025 and a forecast period of 2025-2033. The report leverages extensive primary and secondary research to offer invaluable insights for industry stakeholders, investors, and policymakers. The market is projected to reach $XX Million by 2033, exhibiting a CAGR of XX% during the forecast period.
Crop Protection Industry Market Structure & Competitive Landscape
The global crop protection market is characterized by a moderately concentrated structure, with a few multinational corporations holding significant market share. The Herfindahl-Hirschman Index (HHI) for the market is estimated to be around XX, indicating moderate concentration. Key players such as FMC Corporation, Sumitomo Chemical Co Ltd, ADAMA Agricultural Solutions Ltd, Bayer AG, UPL Limited, Syngenta Group, Jiangsu Yangnong Chemical Co Ltd, Corteva Agriscience, Nufarm Ltd, and BASF SE are driving innovation and shaping market dynamics. The industry is witnessing significant mergers and acquisitions (M&A) activity, with a total M&A volume exceeding $XX Million in the historical period (2019-2024).
- Market Concentration: Moderate, with top 10 players accounting for approximately XX% of the market share.
- Innovation Drivers: Growing demand for high-yielding crops, increasing pest and disease resistance, and the need for sustainable agricultural practices.
- Regulatory Impacts: Stringent regulations regarding pesticide use and environmental protection are impacting market dynamics. Compliance costs and approval processes are significant factors.
- Product Substitutes: Biological control agents and integrated pest management (IPM) strategies are emerging as alternatives to traditional chemical pesticides.
- End-User Segmentation: The market is segmented by crop type (grains & cereals, fruits & vegetables, pulses & oilseeds, commercial crops, turf & ornamental) and application mode (foliar, soil treatment, seed treatment, chemigation, fumigation).
- M&A Trends: Consolidation through mergers and acquisitions is a significant trend, aiming for increased market share and access to new technologies.
Crop Protection Industry Market Trends & Opportunities
The global crop protection market is experiencing robust growth, driven by several factors. The increasing global population necessitates higher agricultural output, increasing the demand for crop protection solutions. Technological advancements, such as the development of targeted pesticides and precision agriculture technologies, are also boosting market expansion. Changing consumer preferences towards pesticide-free or organically grown produce are creating opportunities for biopesticides and sustainable crop protection methods. However, stringent regulations and environmental concerns are presenting significant challenges. The market is expected to witness a significant shift towards sustainable and environmentally friendly crop protection solutions. The CAGR for the period 2025-2033 is projected to be XX%, with a market penetration rate for new technologies estimated at XX% by 2033. Significant opportunities lie in developing innovative products catering to specific crop needs and addressing the growing concerns about pesticide residues.
Dominant Markets & Segments in Crop Protection Industry
The dominant segment within the crop protection industry varies depending on the region and specific criteria. Based on current trends and projections:
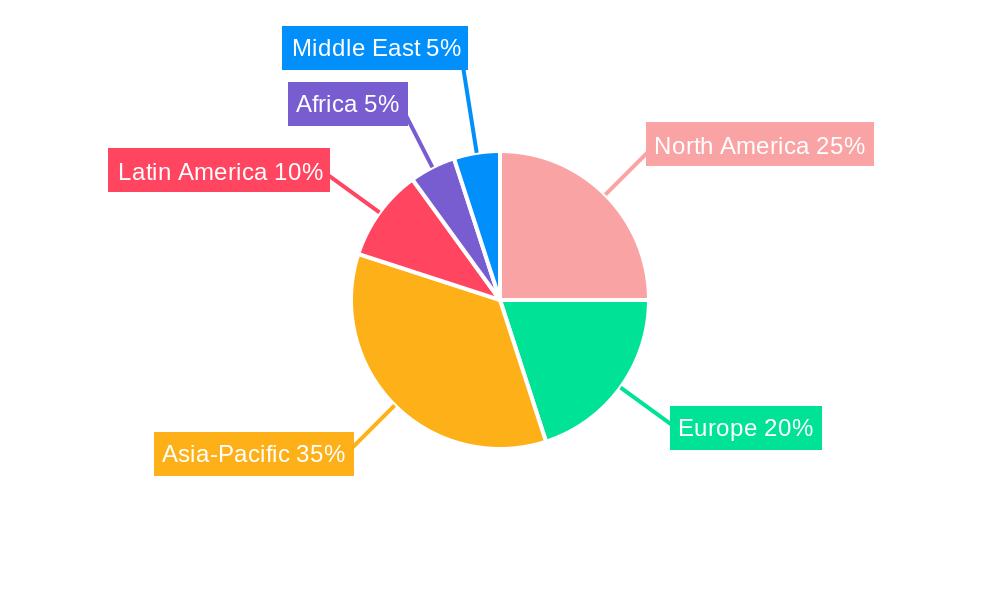
Leading Region: North America and Asia-Pacific are currently leading the market due to large agricultural land and high crop production. Europe is also a significant market, although facing tighter regulations.
Leading Country: The United States holds a strong position due to its expansive agricultural sector and high adoption of crop protection technologies. China and India show significant growth potential.
Dominant Segments:
- Function: Herbicides represent the largest segment, followed by insecticides and fungicides. The demand for herbicides is predominantly high in large-scale commercial crop production.
- Application Mode: Foliar application currently holds the largest market share, followed by soil treatment and seed treatment. The growth of chemigation and precision agriculture technologies is expected to increase the adoption rate of chemigation.
- Crop Type: Grains & cereals currently represent the largest segment due to their extensive cultivation area. Fruits & vegetables and pulses & oilseeds also show significant demand for crop protection solutions. The turf and ornamental sector is witnessing increasing demand for specialized crop protection products.
Key Growth Drivers:
- Technological advancements: Development of targeted pesticides and precision agriculture technologies.
- Government support: Policies and subsidies aimed at boosting agricultural productivity.
- Increasing awareness: Growing understanding of crop diseases and pest management.
- Favorable climate: Suitable weather conditions in key agricultural regions.
Crop Protection Industry Product Analysis
The crop protection industry is witnessing a wave of innovation, focusing on developing more targeted, effective, and environmentally friendly products. Advancements in formulation technologies are resulting in improved efficacy, reduced environmental impact, and enhanced application methods. Companies are increasingly focusing on biopesticides and integrated pest management strategies to meet growing consumer demand for sustainable agriculture. The development of new formulations and targeted delivery systems is a major aspect of product innovation.
Key Drivers, Barriers & Challenges in Crop Protection Industry
Key Drivers:
- Increasing global population and rising food demand.
- Growing awareness of crop diseases and pest management.
- Technological advancements in crop protection products.
- Government support and policies promoting agricultural productivity.
Challenges and Restraints:
- Stringent regulations and environmental concerns leading to longer approval processes and higher compliance costs. The estimated cost for regulatory compliance is approximately $XX Million annually.
- Supply chain disruptions, impacting raw material availability and product distribution.
- Intense competition among industry players, particularly within the established segments.
Growth Drivers in the Crop Protection Industry Market
Several factors are driving growth in the crop protection market. The rising global population and the consequent demand for food security are key factors. Technological advancements, leading to the development of more effective and targeted pesticides, are also significant drivers. Favorable government policies and subsidies aimed at boosting agricultural productivity contribute to market expansion. Furthermore, increasing awareness among farmers about pest management and crop diseases fuels demand for crop protection solutions.
Challenges Impacting Crop Protection Industry Growth
The crop protection industry faces several challenges. Stringent regulatory frameworks and environmental concerns lead to lengthy approval processes and higher compliance costs. Supply chain disruptions can hinder the availability of raw materials and affect product distribution. Intense competition among major players makes the industry highly competitive, putting pressure on margins. These factors significantly impact overall market growth and profitability.
Key Players Shaping the Crop Protection Industry Market
- FMC Corporation
- Sumitomo Chemical Co Ltd
- ADAMA Agricultural Solutions Ltd
- Bayer AG
- UPL Limited
- Syngenta Group
- Jiangsu Yangnong Chemical Co Ltd
- Corteva Agriscience
- Nufarm Ltd
- BASF SE
Significant Crop Protection Industry Milestones
- December 2023: ADAMA introduced Kampai, a cross-spectrum herbicide for grain crops, offering a broad application window for weed control.
- July 2023: ADAMA launched Davai A Plus and Clearfield Broad-Spectrum Herbicide Solutions for imidazolinone-tolerant legumes.
- April 2023: Nufarm launched Tourney EZ, a liquid fungicide for turf and ornamental crops, strengthening its position in this segment.
Future Outlook for Crop Protection Industry Market
The crop protection industry is poised for continued growth, driven by factors such as increasing global food demand, technological advancements, and supportive government policies. Strategic opportunities exist in developing innovative, sustainable, and targeted crop protection solutions to meet the evolving needs of the agricultural sector. The market is likely to see increased focus on biopesticides and integrated pest management strategies. The market's future prospects are strong, with considerable growth potential.
Crop Protection Industry Segmentation
-
1. Function
- 1.1. Fungicide
- 1.2. Herbicide
- 1.3. Insecticide
- 1.4. Molluscicide
- 1.5. Nematicide
-
2. Application Mode
- 2.1. Chemigation
- 2.2. Foliar
- 2.3. Fumigation
- 2.4. Seed Treatment
- 2.5. Soil Treatment
-
3. Crop Type
- 3.1. Commercial Crops
- 3.2. Fruits & Vegetables
- 3.3. Grains & Cereals
- 3.4. Pulses & Oilseeds
- 3.5. Turf & Ornamental
-
4. Function
- 4.1. Fungicide
- 4.2. Herbicide
- 4.3. Insecticide
- 4.4. Molluscicide
- 4.5. Nematicide
-
5. Application Mode
- 5.1. Chemigation
- 5.2. Foliar
- 5.3. Fumigation
- 5.4. Seed Treatment
- 5.5. Soil Treatment
-
6. Crop Type
- 6.1. Commercial Crops
- 6.2. Fruits & Vegetables
- 6.3. Grains & Cereals
- 6.4. Pulses & Oilseeds
- 6.5. Turf & Ornamental
Crop Protection Industry Segmentation By Geography
-
1. North America
- 1.1. United States
- 1.2. Canada
- 1.3. Mexico
-
2. South America
- 2.1. Brazil
- 2.2. Argentina
- 2.3. Rest of South America
-
3. Europe
- 3.1. United Kingdom
- 3.2. Germany
- 3.3. France
- 3.4. Italy
- 3.5. Spain
- 3.6. Russia
- 3.7. Benelux
- 3.8. Nordics
- 3.9. Rest of Europe
-
4. Middle East & Africa
- 4.1. Turkey
- 4.2. Israel
- 4.3. GCC
- 4.4. North Africa
- 4.5. South Africa
- 4.6. Rest of Middle East & Africa
-
5. Asia Pacific
- 5.1. China
- 5.2. India
- 5.3. Japan
- 5.4. South Korea
- 5.5. ASEAN
- 5.6. Oceania
- 5.7. Rest of Asia Pacific
Crop Protection Industry Regional Market Share
Geographic Coverage of Crop Protection Industry
Crop Protection Industry REPORT HIGHLIGHTS
| Aspects | Details |
|---|---|
| Study Period | 2020-2034 |
| Base Year | 2025 |
| Estimated Year | 2026 |
| Forecast Period | 2026-2034 |
| Historical Period | 2020-2025 |
| Growth Rate | CAGR of 5.60% from 2020-2034 |
| Segmentation |
|
Table of Contents
- 1. Introduction
- 1.1. Research Scope
- 1.2. Market Segmentation
- 1.3. Research Methodology
- 1.4. Definitions and Assumptions
- 2. Executive Summary
- 2.1. Introduction
- 3. Market Dynamics
- 3.1. Introduction
- 3.2. Market Drivers
- 3.2.1. Seed Treatment As A Solution To Enhance Yield; Growing Awareness For Seed Treatment Among The Farmers; Rising Trend Of Organic Farming
- 3.3. Market Restrains
- 3.3.1. Limitations Across Farm-Level Seed Treatment; Rising Environmental Concerns
- 3.4. Market Trends
- 3.4.1. OTHER KEY INDUSTRY TRENDS COVERED IN THE REPORT
- 4. Market Factor Analysis
- 4.1. Porters Five Forces
- 4.2. Supply/Value Chain
- 4.3. PESTEL analysis
- 4.4. Market Entropy
- 4.5. Patent/Trademark Analysis
- 5. Global Crop Protection Industry Analysis, Insights and Forecast, 2020-2032
- 5.1. Market Analysis, Insights and Forecast - by Function
- 5.1.1. Fungicide
- 5.1.2. Herbicide
- 5.1.3. Insecticide
- 5.1.4. Molluscicide
- 5.1.5. Nematicide
- 5.2. Market Analysis, Insights and Forecast - by Application Mode
- 5.2.1. Chemigation
- 5.2.2. Foliar
- 5.2.3. Fumigation
- 5.2.4. Seed Treatment
- 5.2.5. Soil Treatment
- 5.3. Market Analysis, Insights and Forecast - by Crop Type
- 5.3.1. Commercial Crops
- 5.3.2. Fruits & Vegetables
- 5.3.3. Grains & Cereals
- 5.3.4. Pulses & Oilseeds
- 5.3.5. Turf & Ornamental
- 5.4. Market Analysis, Insights and Forecast - by Function
- 5.4.1. Fungicide
- 5.4.2. Herbicide
- 5.4.3. Insecticide
- 5.4.4. Molluscicide
- 5.4.5. Nematicide
- 5.5. Market Analysis, Insights and Forecast - by Application Mode
- 5.5.1. Chemigation
- 5.5.2. Foliar
- 5.5.3. Fumigation
- 5.5.4. Seed Treatment
- 5.5.5. Soil Treatment
- 5.6. Market Analysis, Insights and Forecast - by Crop Type
- 5.6.1. Commercial Crops
- 5.6.2. Fruits & Vegetables
- 5.6.3. Grains & Cereals
- 5.6.4. Pulses & Oilseeds
- 5.6.5. Turf & Ornamental
- 5.7. Market Analysis, Insights and Forecast - by Region
- 5.7.1. North America
- 5.7.2. South America
- 5.7.3. Europe
- 5.7.4. Middle East & Africa
- 5.7.5. Asia Pacific
- 5.1. Market Analysis, Insights and Forecast - by Function
- 6. North America Crop Protection Industry Analysis, Insights and Forecast, 2020-2032
- 6.1. Market Analysis, Insights and Forecast - by Function
- 6.1.1. Fungicide
- 6.1.2. Herbicide
- 6.1.3. Insecticide
- 6.1.4. Molluscicide
- 6.1.5. Nematicide
- 6.2. Market Analysis, Insights and Forecast - by Application Mode
- 6.2.1. Chemigation
- 6.2.2. Foliar
- 6.2.3. Fumigation
- 6.2.4. Seed Treatment
- 6.2.5. Soil Treatment
- 6.3. Market Analysis, Insights and Forecast - by Crop Type
- 6.3.1. Commercial Crops
- 6.3.2. Fruits & Vegetables
- 6.3.3. Grains & Cereals
- 6.3.4. Pulses & Oilseeds
- 6.3.5. Turf & Ornamental
- 6.4. Market Analysis, Insights and Forecast - by Function
- 6.4.1. Fungicide
- 6.4.2. Herbicide
- 6.4.3. Insecticide
- 6.4.4. Molluscicide
- 6.4.5. Nematicide
- 6.5. Market Analysis, Insights and Forecast - by Application Mode
- 6.5.1. Chemigation
- 6.5.2. Foliar
- 6.5.3. Fumigation
- 6.5.4. Seed Treatment
- 6.5.5. Soil Treatment
- 6.6. Market Analysis, Insights and Forecast - by Crop Type
- 6.6.1. Commercial Crops
- 6.6.2. Fruits & Vegetables
- 6.6.3. Grains & Cereals
- 6.6.4. Pulses & Oilseeds
- 6.6.5. Turf & Ornamental
- 6.1. Market Analysis, Insights and Forecast - by Function
- 7. South America Crop Protection Industry Analysis, Insights and Forecast, 2020-2032
- 7.1. Market Analysis, Insights and Forecast - by Function
- 7.1.1. Fungicide
- 7.1.2. Herbicide
- 7.1.3. Insecticide
- 7.1.4. Molluscicide
- 7.1.5. Nematicide
- 7.2. Market Analysis, Insights and Forecast - by Application Mode
- 7.2.1. Chemigation
- 7.2.2. Foliar
- 7.2.3. Fumigation
- 7.2.4. Seed Treatment
- 7.2.5. Soil Treatment
- 7.3. Market Analysis, Insights and Forecast - by Crop Type
- 7.3.1. Commercial Crops
- 7.3.2. Fruits & Vegetables
- 7.3.3. Grains & Cereals
- 7.3.4. Pulses & Oilseeds
- 7.3.5. Turf & Ornamental
- 7.4. Market Analysis, Insights and Forecast - by Function
- 7.4.1. Fungicide
- 7.4.2. Herbicide
- 7.4.3. Insecticide
- 7.4.4. Molluscicide
- 7.4.5. Nematicide
- 7.5. Market Analysis, Insights and Forecast - by Application Mode
- 7.5.1. Chemigation
- 7.5.2. Foliar
- 7.5.3. Fumigation
- 7.5.4. Seed Treatment
- 7.5.5. Soil Treatment
- 7.6. Market Analysis, Insights and Forecast - by Crop Type
- 7.6.1. Commercial Crops
- 7.6.2. Fruits & Vegetables
- 7.6.3. Grains & Cereals
- 7.6.4. Pulses & Oilseeds
- 7.6.5. Turf & Ornamental
- 7.1. Market Analysis, Insights and Forecast - by Function
- 8. Europe Crop Protection Industry Analysis, Insights and Forecast, 2020-2032
- 8.1. Market Analysis, Insights and Forecast - by Function
- 8.1.1. Fungicide
- 8.1.2. Herbicide
- 8.1.3. Insecticide
- 8.1.4. Molluscicide
- 8.1.5. Nematicide
- 8.2. Market Analysis, Insights and Forecast - by Application Mode
- 8.2.1. Chemigation
- 8.2.2. Foliar
- 8.2.3. Fumigation
- 8.2.4. Seed Treatment
- 8.2.5. Soil Treatment
- 8.3. Market Analysis, Insights and Forecast - by Crop Type
- 8.3.1. Commercial Crops
- 8.3.2. Fruits & Vegetables
- 8.3.3. Grains & Cereals
- 8.3.4. Pulses & Oilseeds
- 8.3.5. Turf & Ornamental
- 8.4. Market Analysis, Insights and Forecast - by Function
- 8.4.1. Fungicide
- 8.4.2. Herbicide
- 8.4.3. Insecticide
- 8.4.4. Molluscicide
- 8.4.5. Nematicide
- 8.5. Market Analysis, Insights and Forecast - by Application Mode
- 8.5.1. Chemigation
- 8.5.2. Foliar
- 8.5.3. Fumigation
- 8.5.4. Seed Treatment
- 8.5.5. Soil Treatment
- 8.6. Market Analysis, Insights and Forecast - by Crop Type
- 8.6.1. Commercial Crops
- 8.6.2. Fruits & Vegetables
- 8.6.3. Grains & Cereals
- 8.6.4. Pulses & Oilseeds
- 8.6.5. Turf & Ornamental
- 8.1. Market Analysis, Insights and Forecast - by Function
- 9. Middle East & Africa Crop Protection Industry Analysis, Insights and Forecast, 2020-2032
- 9.1. Market Analysis, Insights and Forecast - by Function
- 9.1.1. Fungicide
- 9.1.2. Herbicide
- 9.1.3. Insecticide
- 9.1.4. Molluscicide
- 9.1.5. Nematicide
- 9.2. Market Analysis, Insights and Forecast - by Application Mode
- 9.2.1. Chemigation
- 9.2.2. Foliar
- 9.2.3. Fumigation
- 9.2.4. Seed Treatment
- 9.2.5. Soil Treatment
- 9.3. Market Analysis, Insights and Forecast - by Crop Type
- 9.3.1. Commercial Crops
- 9.3.2. Fruits & Vegetables
- 9.3.3. Grains & Cereals
- 9.3.4. Pulses & Oilseeds
- 9.3.5. Turf & Ornamental
- 9.4. Market Analysis, Insights and Forecast - by Function
- 9.4.1. Fungicide
- 9.4.2. Herbicide
- 9.4.3. Insecticide
- 9.4.4. Molluscicide
- 9.4.5. Nematicide
- 9.5. Market Analysis, Insights and Forecast - by Application Mode
- 9.5.1. Chemigation
- 9.5.2. Foliar
- 9.5.3. Fumigation
- 9.5.4. Seed Treatment
- 9.5.5. Soil Treatment
- 9.6. Market Analysis, Insights and Forecast - by Crop Type
- 9.6.1. Commercial Crops
- 9.6.2. Fruits & Vegetables
- 9.6.3. Grains & Cereals
- 9.6.4. Pulses & Oilseeds
- 9.6.5. Turf & Ornamental
- 9.1. Market Analysis, Insights and Forecast - by Function
- 10. Asia Pacific Crop Protection Industry Analysis, Insights and Forecast, 2020-2032
- 10.1. Market Analysis, Insights and Forecast - by Function
- 10.1.1. Fungicide
- 10.1.2. Herbicide
- 10.1.3. Insecticide
- 10.1.4. Molluscicide
- 10.1.5. Nematicide
- 10.2. Market Analysis, Insights and Forecast - by Application Mode
- 10.2.1. Chemigation
- 10.2.2. Foliar
- 10.2.3. Fumigation
- 10.2.4. Seed Treatment
- 10.2.5. Soil Treatment
- 10.3. Market Analysis, Insights and Forecast - by Crop Type
- 10.3.1. Commercial Crops
- 10.3.2. Fruits & Vegetables
- 10.3.3. Grains & Cereals
- 10.3.4. Pulses & Oilseeds
- 10.3.5. Turf & Ornamental
- 10.4. Market Analysis, Insights and Forecast - by Function
- 10.4.1. Fungicide
- 10.4.2. Herbicide
- 10.4.3. Insecticide
- 10.4.4. Molluscicide
- 10.4.5. Nematicide
- 10.5. Market Analysis, Insights and Forecast - by Application Mode
- 10.5.1. Chemigation
- 10.5.2. Foliar
- 10.5.3. Fumigation
- 10.5.4. Seed Treatment
- 10.5.5. Soil Treatment
- 10.6. Market Analysis, Insights and Forecast - by Crop Type
- 10.6.1. Commercial Crops
- 10.6.2. Fruits & Vegetables
- 10.6.3. Grains & Cereals
- 10.6.4. Pulses & Oilseeds
- 10.6.5. Turf & Ornamental
- 10.1. Market Analysis, Insights and Forecast - by Function
- 11. Competitive Analysis
- 11.1. Global Market Share Analysis 2025
- 11.2. Company Profiles
- 11.2.1 FMC Corporation
- 11.2.1.1. Overview
- 11.2.1.2. Products
- 11.2.1.3. SWOT Analysis
- 11.2.1.4. Recent Developments
- 11.2.1.5. Financials (Based on Availability)
- 11.2.2 Sumitomo Chemical Co Ltd
- 11.2.2.1. Overview
- 11.2.2.2. Products
- 11.2.2.3. SWOT Analysis
- 11.2.2.4. Recent Developments
- 11.2.2.5. Financials (Based on Availability)
- 11.2.3 ADAMA Agricultural Solutions Ltd
- 11.2.3.1. Overview
- 11.2.3.2. Products
- 11.2.3.3. SWOT Analysis
- 11.2.3.4. Recent Developments
- 11.2.3.5. Financials (Based on Availability)
- 11.2.4 Bayer AG
- 11.2.4.1. Overview
- 11.2.4.2. Products
- 11.2.4.3. SWOT Analysis
- 11.2.4.4. Recent Developments
- 11.2.4.5. Financials (Based on Availability)
- 11.2.5 UPL Limite
- 11.2.5.1. Overview
- 11.2.5.2. Products
- 11.2.5.3. SWOT Analysis
- 11.2.5.4. Recent Developments
- 11.2.5.5. Financials (Based on Availability)
- 11.2.6 Syngenta Group
- 11.2.6.1. Overview
- 11.2.6.2. Products
- 11.2.6.3. SWOT Analysis
- 11.2.6.4. Recent Developments
- 11.2.6.5. Financials (Based on Availability)
- 11.2.7 Jiangsu Yangnong Chemical Co Ltd
- 11.2.7.1. Overview
- 11.2.7.2. Products
- 11.2.7.3. SWOT Analysis
- 11.2.7.4. Recent Developments
- 11.2.7.5. Financials (Based on Availability)
- 11.2.8 Corteva Agriscience
- 11.2.8.1. Overview
- 11.2.8.2. Products
- 11.2.8.3. SWOT Analysis
- 11.2.8.4. Recent Developments
- 11.2.8.5. Financials (Based on Availability)
- 11.2.9 Nufarm Ltd
- 11.2.9.1. Overview
- 11.2.9.2. Products
- 11.2.9.3. SWOT Analysis
- 11.2.9.4. Recent Developments
- 11.2.9.5. Financials (Based on Availability)
- 11.2.10 BASF SE
- 11.2.10.1. Overview
- 11.2.10.2. Products
- 11.2.10.3. SWOT Analysis
- 11.2.10.4. Recent Developments
- 11.2.10.5. Financials (Based on Availability)
- 11.2.1 FMC Corporation
List of Figures
- Figure 1: Global Crop Protection Industry Revenue Breakdown (Million, %) by Region 2025 & 2033
- Figure 2: Global Crop Protection Industry Volume Breakdown (kilotons, %) by Region 2025 & 2033
- Figure 3: North America Crop Protection Industry Revenue (Million), by Function 2025 & 2033
- Figure 4: North America Crop Protection Industry Volume (kilotons), by Function 2025 & 2033
- Figure 5: North America Crop Protection Industry Revenue Share (%), by Function 2025 & 2033
- Figure 6: North America Crop Protection Industry Volume Share (%), by Function 2025 & 2033
- Figure 7: North America Crop Protection Industry Revenue (Million), by Application Mode 2025 & 2033
- Figure 8: North America Crop Protection Industry Volume (kilotons), by Application Mode 2025 & 2033
- Figure 9: North America Crop Protection Industry Revenue Share (%), by Application Mode 2025 & 2033
- Figure 10: North America Crop Protection Industry Volume Share (%), by Application Mode 2025 & 2033
- Figure 11: North America Crop Protection Industry Revenue (Million), by Crop Type 2025 & 2033
- Figure 12: North America Crop Protection Industry Volume (kilotons), by Crop Type 2025 & 2033
- Figure 13: North America Crop Protection Industry Revenue Share (%), by Crop Type 2025 & 2033
- Figure 14: North America Crop Protection Industry Volume Share (%), by Crop Type 2025 & 2033
- Figure 15: North America Crop Protection Industry Revenue (Million), by Function 2025 & 2033
- Figure 16: North America Crop Protection Industry Volume (kilotons), by Function 2025 & 2033
- Figure 17: North America Crop Protection Industry Revenue Share (%), by Function 2025 & 2033
- Figure 18: North America Crop Protection Industry Volume Share (%), by Function 2025 & 2033
- Figure 19: North America Crop Protection Industry Revenue (Million), by Application Mode 2025 & 2033
- Figure 20: North America Crop Protection Industry Volume (kilotons), by Application Mode 2025 & 2033
- Figure 21: North America Crop Protection Industry Revenue Share (%), by Application Mode 2025 & 2033
- Figure 22: North America Crop Protection Industry Volume Share (%), by Application Mode 2025 & 2033
- Figure 23: North America Crop Protection Industry Revenue (Million), by Crop Type 2025 & 2033
- Figure 24: North America Crop Protection Industry Volume (kilotons), by Crop Type 2025 & 2033
- Figure 25: North America Crop Protection Industry Revenue Share (%), by Crop Type 2025 & 2033
- Figure 26: North America Crop Protection Industry Volume Share (%), by Crop Type 2025 & 2033
- Figure 27: North America Crop Protection Industry Revenue (Million), by Country 2025 & 2033
- Figure 28: North America Crop Protection Industry Volume (kilotons), by Country 2025 & 2033
- Figure 29: North America Crop Protection Industry Revenue Share (%), by Country 2025 & 2033
- Figure 30: North America Crop Protection Industry Volume Share (%), by Country 2025 & 2033
- Figure 31: South America Crop Protection Industry Revenue (Million), by Function 2025 & 2033
- Figure 32: South America Crop Protection Industry Volume (kilotons), by Function 2025 & 2033
- Figure 33: South America Crop Protection Industry Revenue Share (%), by Function 2025 & 2033
- Figure 34: South America Crop Protection Industry Volume Share (%), by Function 2025 & 2033
- Figure 35: South America Crop Protection Industry Revenue (Million), by Application Mode 2025 & 2033
- Figure 36: South America Crop Protection Industry Volume (kilotons), by Application Mode 2025 & 2033
- Figure 37: South America Crop Protection Industry Revenue Share (%), by Application Mode 2025 & 2033
- Figure 38: South America Crop Protection Industry Volume Share (%), by Application Mode 2025 & 2033
- Figure 39: South America Crop Protection Industry Revenue (Million), by Crop Type 2025 & 2033
- Figure 40: South America Crop Protection Industry Volume (kilotons), by Crop Type 2025 & 2033
- Figure 41: South America Crop Protection Industry Revenue Share (%), by Crop Type 2025 & 2033
- Figure 42: South America Crop Protection Industry Volume Share (%), by Crop Type 2025 & 2033
- Figure 43: South America Crop Protection Industry Revenue (Million), by Function 2025 & 2033
- Figure 44: South America Crop Protection Industry Volume (kilotons), by Function 2025 & 2033
- Figure 45: South America Crop Protection Industry Revenue Share (%), by Function 2025 & 2033
- Figure 46: South America Crop Protection Industry Volume Share (%), by Function 2025 & 2033
- Figure 47: South America Crop Protection Industry Revenue (Million), by Application Mode 2025 & 2033
- Figure 48: South America Crop Protection Industry Volume (kilotons), by Application Mode 2025 & 2033
- Figure 49: South America Crop Protection Industry Revenue Share (%), by Application Mode 2025 & 2033
- Figure 50: South America Crop Protection Industry Volume Share (%), by Application Mode 2025 & 2033
- Figure 51: South America Crop Protection Industry Revenue (Million), by Crop Type 2025 & 2033
- Figure 52: South America Crop Protection Industry Volume (kilotons), by Crop Type 2025 & 2033
- Figure 53: South America Crop Protection Industry Revenue Share (%), by Crop Type 2025 & 2033
- Figure 54: South America Crop Protection Industry Volume Share (%), by Crop Type 2025 & 2033
- Figure 55: South America Crop Protection Industry Revenue (Million), by Country 2025 & 2033
- Figure 56: South America Crop Protection Industry Volume (kilotons), by Country 2025 & 2033
- Figure 57: South America Crop Protection Industry Revenue Share (%), by Country 2025 & 2033
- Figure 58: South America Crop Protection Industry Volume Share (%), by Country 2025 & 2033
- Figure 59: Europe Crop Protection Industry Revenue (Million), by Function 2025 & 2033
- Figure 60: Europe Crop Protection Industry Volume (kilotons), by Function 2025 & 2033
- Figure 61: Europe Crop Protection Industry Revenue Share (%), by Function 2025 & 2033
- Figure 62: Europe Crop Protection Industry Volume Share (%), by Function 2025 & 2033
- Figure 63: Europe Crop Protection Industry Revenue (Million), by Application Mode 2025 & 2033
- Figure 64: Europe Crop Protection Industry Volume (kilotons), by Application Mode 2025 & 2033
- Figure 65: Europe Crop Protection Industry Revenue Share (%), by Application Mode 2025 & 2033
- Figure 66: Europe Crop Protection Industry Volume Share (%), by Application Mode 2025 & 2033
- Figure 67: Europe Crop Protection Industry Revenue (Million), by Crop Type 2025 & 2033
- Figure 68: Europe Crop Protection Industry Volume (kilotons), by Crop Type 2025 & 2033
- Figure 69: Europe Crop Protection Industry Revenue Share (%), by Crop Type 2025 & 2033
- Figure 70: Europe Crop Protection Industry Volume Share (%), by Crop Type 2025 & 2033
- Figure 71: Europe Crop Protection Industry Revenue (Million), by Function 2025 & 2033
- Figure 72: Europe Crop Protection Industry Volume (kilotons), by Function 2025 & 2033
- Figure 73: Europe Crop Protection Industry Revenue Share (%), by Function 2025 & 2033
- Figure 74: Europe Crop Protection Industry Volume Share (%), by Function 2025 & 2033
- Figure 75: Europe Crop Protection Industry Revenue (Million), by Application Mode 2025 & 2033
- Figure 76: Europe Crop Protection Industry Volume (kilotons), by Application Mode 2025 & 2033
- Figure 77: Europe Crop Protection Industry Revenue Share (%), by Application Mode 2025 & 2033
- Figure 78: Europe Crop Protection Industry Volume Share (%), by Application Mode 2025 & 2033
- Figure 79: Europe Crop Protection Industry Revenue (Million), by Crop Type 2025 & 2033
- Figure 80: Europe Crop Protection Industry Volume (kilotons), by Crop Type 2025 & 2033
- Figure 81: Europe Crop Protection Industry Revenue Share (%), by Crop Type 2025 & 2033
- Figure 82: Europe Crop Protection Industry Volume Share (%), by Crop Type 2025 & 2033
- Figure 83: Europe Crop Protection Industry Revenue (Million), by Country 2025 & 2033
- Figure 84: Europe Crop Protection Industry Volume (kilotons), by Country 2025 & 2033
- Figure 85: Europe Crop Protection Industry Revenue Share (%), by Country 2025 & 2033
- Figure 86: Europe Crop Protection Industry Volume Share (%), by Country 2025 & 2033
- Figure 87: Middle East & Africa Crop Protection Industry Revenue (Million), by Function 2025 & 2033
- Figure 88: Middle East & Africa Crop Protection Industry Volume (kilotons), by Function 2025 & 2033
- Figure 89: Middle East & Africa Crop Protection Industry Revenue Share (%), by Function 2025 & 2033
- Figure 90: Middle East & Africa Crop Protection Industry Volume Share (%), by Function 2025 & 2033
- Figure 91: Middle East & Africa Crop Protection Industry Revenue (Million), by Application Mode 2025 & 2033
- Figure 92: Middle East & Africa Crop Protection Industry Volume (kilotons), by Application Mode 2025 & 2033
- Figure 93: Middle East & Africa Crop Protection Industry Revenue Share (%), by Application Mode 2025 & 2033
- Figure 94: Middle East & Africa Crop Protection Industry Volume Share (%), by Application Mode 2025 & 2033
- Figure 95: Middle East & Africa Crop Protection Industry Revenue (Million), by Crop Type 2025 & 2033
- Figure 96: Middle East & Africa Crop Protection Industry Volume (kilotons), by Crop Type 2025 & 2033
- Figure 97: Middle East & Africa Crop Protection Industry Revenue Share (%), by Crop Type 2025 & 2033
- Figure 98: Middle East & Africa Crop Protection Industry Volume Share (%), by Crop Type 2025 & 2033
- Figure 99: Middle East & Africa Crop Protection Industry Revenue (Million), by Function 2025 & 2033
- Figure 100: Middle East & Africa Crop Protection Industry Volume (kilotons), by Function 2025 & 2033
- Figure 101: Middle East & Africa Crop Protection Industry Revenue Share (%), by Function 2025 & 2033
- Figure 102: Middle East & Africa Crop Protection Industry Volume Share (%), by Function 2025 & 2033
- Figure 103: Middle East & Africa Crop Protection Industry Revenue (Million), by Application Mode 2025 & 2033
- Figure 104: Middle East & Africa Crop Protection Industry Volume (kilotons), by Application Mode 2025 & 2033
- Figure 105: Middle East & Africa Crop Protection Industry Revenue Share (%), by Application Mode 2025 & 2033
- Figure 106: Middle East & Africa Crop Protection Industry Volume Share (%), by Application Mode 2025 & 2033
- Figure 107: Middle East & Africa Crop Protection Industry Revenue (Million), by Crop Type 2025 & 2033
- Figure 108: Middle East & Africa Crop Protection Industry Volume (kilotons), by Crop Type 2025 & 2033
- Figure 109: Middle East & Africa Crop Protection Industry Revenue Share (%), by Crop Type 2025 & 2033
- Figure 110: Middle East & Africa Crop Protection Industry Volume Share (%), by Crop Type 2025 & 2033
- Figure 111: Middle East & Africa Crop Protection Industry Revenue (Million), by Country 2025 & 2033
- Figure 112: Middle East & Africa Crop Protection Industry Volume (kilotons), by Country 2025 & 2033
- Figure 113: Middle East & Africa Crop Protection Industry Revenue Share (%), by Country 2025 & 2033
- Figure 114: Middle East & Africa Crop Protection Industry Volume Share (%), by Country 2025 & 2033
- Figure 115: Asia Pacific Crop Protection Industry Revenue (Million), by Function 2025 & 2033
- Figure 116: Asia Pacific Crop Protection Industry Volume (kilotons), by Function 2025 & 2033
- Figure 117: Asia Pacific Crop Protection Industry Revenue Share (%), by Function 2025 & 2033
- Figure 118: Asia Pacific Crop Protection Industry Volume Share (%), by Function 2025 & 2033
- Figure 119: Asia Pacific Crop Protection Industry Revenue (Million), by Application Mode 2025 & 2033
- Figure 120: Asia Pacific Crop Protection Industry Volume (kilotons), by Application Mode 2025 & 2033
- Figure 121: Asia Pacific Crop Protection Industry Revenue Share (%), by Application Mode 2025 & 2033
- Figure 122: Asia Pacific Crop Protection Industry Volume Share (%), by Application Mode 2025 & 2033
- Figure 123: Asia Pacific Crop Protection Industry Revenue (Million), by Crop Type 2025 & 2033
- Figure 124: Asia Pacific Crop Protection Industry Volume (kilotons), by Crop Type 2025 & 2033
- Figure 125: Asia Pacific Crop Protection Industry Revenue Share (%), by Crop Type 2025 & 2033
- Figure 126: Asia Pacific Crop Protection Industry Volume Share (%), by Crop Type 2025 & 2033
- Figure 127: Asia Pacific Crop Protection Industry Revenue (Million), by Function 2025 & 2033
- Figure 128: Asia Pacific Crop Protection Industry Volume (kilotons), by Function 2025 & 2033
- Figure 129: Asia Pacific Crop Protection Industry Revenue Share (%), by Function 2025 & 2033
- Figure 130: Asia Pacific Crop Protection Industry Volume Share (%), by Function 2025 & 2033
- Figure 131: Asia Pacific Crop Protection Industry Revenue (Million), by Application Mode 2025 & 2033
- Figure 132: Asia Pacific Crop Protection Industry Volume (kilotons), by Application Mode 2025 & 2033
- Figure 133: Asia Pacific Crop Protection Industry Revenue Share (%), by Application Mode 2025 & 2033
- Figure 134: Asia Pacific Crop Protection Industry Volume Share (%), by Application Mode 2025 & 2033
- Figure 135: Asia Pacific Crop Protection Industry Revenue (Million), by Crop Type 2025 & 2033
- Figure 136: Asia Pacific Crop Protection Industry Volume (kilotons), by Crop Type 2025 & 2033
- Figure 137: Asia Pacific Crop Protection Industry Revenue Share (%), by Crop Type 2025 & 2033
- Figure 138: Asia Pacific Crop Protection Industry Volume Share (%), by Crop Type 2025 & 2033
- Figure 139: Asia Pacific Crop Protection Industry Revenue (Million), by Country 2025 & 2033
- Figure 140: Asia Pacific Crop Protection Industry Volume (kilotons), by Country 2025 & 2033
- Figure 141: Asia Pacific Crop Protection Industry Revenue Share (%), by Country 2025 & 2033
- Figure 142: Asia Pacific Crop Protection Industry Volume Share (%), by Country 2025 & 2033
List of Tables
- Table 1: Global Crop Protection Industry Revenue Million Forecast, by Function 2020 & 2033
- Table 2: Global Crop Protection Industry Volume kilotons Forecast, by Function 2020 & 2033
- Table 3: Global Crop Protection Industry Revenue Million Forecast, by Application Mode 2020 & 2033
- Table 4: Global Crop Protection Industry Volume kilotons Forecast, by Application Mode 2020 & 2033
- Table 5: Global Crop Protection Industry Revenue Million Forecast, by Crop Type 2020 & 2033
- Table 6: Global Crop Protection Industry Volume kilotons Forecast, by Crop Type 2020 & 2033
- Table 7: Global Crop Protection Industry Revenue Million Forecast, by Function 2020 & 2033
- Table 8: Global Crop Protection Industry Volume kilotons Forecast, by Function 2020 & 2033
- Table 9: Global Crop Protection Industry Revenue Million Forecast, by Application Mode 2020 & 2033
- Table 10: Global Crop Protection Industry Volume kilotons Forecast, by Application Mode 2020 & 2033
- Table 11: Global Crop Protection Industry Revenue Million Forecast, by Crop Type 2020 & 2033
- Table 12: Global Crop Protection Industry Volume kilotons Forecast, by Crop Type 2020 & 2033
- Table 13: Global Crop Protection Industry Revenue Million Forecast, by Region 2020 & 2033
- Table 14: Global Crop Protection Industry Volume kilotons Forecast, by Region 2020 & 2033
- Table 15: Global Crop Protection Industry Revenue Million Forecast, by Function 2020 & 2033
- Table 16: Global Crop Protection Industry Volume kilotons Forecast, by Function 2020 & 2033
- Table 17: Global Crop Protection Industry Revenue Million Forecast, by Application Mode 2020 & 2033
- Table 18: Global Crop Protection Industry Volume kilotons Forecast, by Application Mode 2020 & 2033
- Table 19: Global Crop Protection Industry Revenue Million Forecast, by Crop Type 2020 & 2033
- Table 20: Global Crop Protection Industry Volume kilotons Forecast, by Crop Type 2020 & 2033
- Table 21: Global Crop Protection Industry Revenue Million Forecast, by Function 2020 & 2033
- Table 22: Global Crop Protection Industry Volume kilotons Forecast, by Function 2020 & 2033
- Table 23: Global Crop Protection Industry Revenue Million Forecast, by Application Mode 2020 & 2033
- Table 24: Global Crop Protection Industry Volume kilotons Forecast, by Application Mode 2020 & 2033
- Table 25: Global Crop Protection Industry Revenue Million Forecast, by Crop Type 2020 & 2033
- Table 26: Global Crop Protection Industry Volume kilotons Forecast, by Crop Type 2020 & 2033
- Table 27: Global Crop Protection Industry Revenue Million Forecast, by Country 2020 & 2033
- Table 28: Global Crop Protection Industry Volume kilotons Forecast, by Country 2020 & 2033
- Table 29: United States Crop Protection Industry Revenue (Million) Forecast, by Application 2020 & 2033
- Table 30: United States Crop Protection Industry Volume (kilotons) Forecast, by Application 2020 & 2033
- Table 31: Canada Crop Protection Industry Revenue (Million) Forecast, by Application 2020 & 2033
- Table 32: Canada Crop Protection Industry Volume (kilotons) Forecast, by Application 2020 & 2033
- Table 33: Mexico Crop Protection Industry Revenue (Million) Forecast, by Application 2020 & 2033
- Table 34: Mexico Crop Protection Industry Volume (kilotons) Forecast, by Application 2020 & 2033
- Table 35: Global Crop Protection Industry Revenue Million Forecast, by Function 2020 & 2033
- Table 36: Global Crop Protection Industry Volume kilotons Forecast, by Function 2020 & 2033
- Table 37: Global Crop Protection Industry Revenue Million Forecast, by Application Mode 2020 & 2033
- Table 38: Global Crop Protection Industry Volume kilotons Forecast, by Application Mode 2020 & 2033
- Table 39: Global Crop Protection Industry Revenue Million Forecast, by Crop Type 2020 & 2033
- Table 40: Global Crop Protection Industry Volume kilotons Forecast, by Crop Type 2020 & 2033
- Table 41: Global Crop Protection Industry Revenue Million Forecast, by Function 2020 & 2033
- Table 42: Global Crop Protection Industry Volume kilotons Forecast, by Function 2020 & 2033
- Table 43: Global Crop Protection Industry Revenue Million Forecast, by Application Mode 2020 & 2033
- Table 44: Global Crop Protection Industry Volume kilotons Forecast, by Application Mode 2020 & 2033
- Table 45: Global Crop Protection Industry Revenue Million Forecast, by Crop Type 2020 & 2033
- Table 46: Global Crop Protection Industry Volume kilotons Forecast, by Crop Type 2020 & 2033
- Table 47: Global Crop Protection Industry Revenue Million Forecast, by Country 2020 & 2033
- Table 48: Global Crop Protection Industry Volume kilotons Forecast, by Country 2020 & 2033
- Table 49: Brazil Crop Protection Industry Revenue (Million) Forecast, by Application 2020 & 2033
- Table 50: Brazil Crop Protection Industry Volume (kilotons) Forecast, by Application 2020 & 2033
- Table 51: Argentina Crop Protection Industry Revenue (Million) Forecast, by Application 2020 & 2033
- Table 52: Argentina Crop Protection Industry Volume (kilotons) Forecast, by Application 2020 & 2033
- Table 53: Rest of South America Crop Protection Industry Revenue (Million) Forecast, by Application 2020 & 2033
- Table 54: Rest of South America Crop Protection Industry Volume (kilotons) Forecast, by Application 2020 & 2033
- Table 55: Global Crop Protection Industry Revenue Million Forecast, by Function 2020 & 2033
- Table 56: Global Crop Protection Industry Volume kilotons Forecast, by Function 2020 & 2033
- Table 57: Global Crop Protection Industry Revenue Million Forecast, by Application Mode 2020 & 2033
- Table 58: Global Crop Protection Industry Volume kilotons Forecast, by Application Mode 2020 & 2033
- Table 59: Global Crop Protection Industry Revenue Million Forecast, by Crop Type 2020 & 2033
- Table 60: Global Crop Protection Industry Volume kilotons Forecast, by Crop Type 2020 & 2033
- Table 61: Global Crop Protection Industry Revenue Million Forecast, by Function 2020 & 2033
- Table 62: Global Crop Protection Industry Volume kilotons Forecast, by Function 2020 & 2033
- Table 63: Global Crop Protection Industry Revenue Million Forecast, by Application Mode 2020 & 2033
- Table 64: Global Crop Protection Industry Volume kilotons Forecast, by Application Mode 2020 & 2033
- Table 65: Global Crop Protection Industry Revenue Million Forecast, by Crop Type 2020 & 2033
- Table 66: Global Crop Protection Industry Volume kilotons Forecast, by Crop Type 2020 & 2033
- Table 67: Global Crop Protection Industry Revenue Million Forecast, by Country 2020 & 2033
- Table 68: Global Crop Protection Industry Volume kilotons Forecast, by Country 2020 & 2033
- Table 69: United Kingdom Crop Protection Industry Revenue (Million) Forecast, by Application 2020 & 2033
- Table 70: United Kingdom Crop Protection Industry Volume (kilotons) Forecast, by Application 2020 & 2033
- Table 71: Germany Crop Protection Industry Revenue (Million) Forecast, by Application 2020 & 2033
- Table 72: Germany Crop Protection Industry Volume (kilotons) Forecast, by Application 2020 & 2033
- Table 73: France Crop Protection Industry Revenue (Million) Forecast, by Application 2020 & 2033
- Table 74: France Crop Protection Industry Volume (kilotons) Forecast, by Application 2020 & 2033
- Table 75: Italy Crop Protection Industry Revenue (Million) Forecast, by Application 2020 & 2033
- Table 76: Italy Crop Protection Industry Volume (kilotons) Forecast, by Application 2020 & 2033
- Table 77: Spain Crop Protection Industry Revenue (Million) Forecast, by Application 2020 & 2033
- Table 78: Spain Crop Protection Industry Volume (kilotons) Forecast, by Application 2020 & 2033
- Table 79: Russia Crop Protection Industry Revenue (Million) Forecast, by Application 2020 & 2033
- Table 80: Russia Crop Protection Industry Volume (kilotons) Forecast, by Application 2020 & 2033
- Table 81: Benelux Crop Protection Industry Revenue (Million) Forecast, by Application 2020 & 2033
- Table 82: Benelux Crop Protection Industry Volume (kilotons) Forecast, by Application 2020 & 2033
- Table 83: Nordics Crop Protection Industry Revenue (Million) Forecast, by Application 2020 & 2033
- Table 84: Nordics Crop Protection Industry Volume (kilotons) Forecast, by Application 2020 & 2033
- Table 85: Rest of Europe Crop Protection Industry Revenue (Million) Forecast, by Application 2020 & 2033
- Table 86: Rest of Europe Crop Protection Industry Volume (kilotons) Forecast, by Application 2020 & 2033
- Table 87: Global Crop Protection Industry Revenue Million Forecast, by Function 2020 & 2033
- Table 88: Global Crop Protection Industry Volume kilotons Forecast, by Function 2020 & 2033
- Table 89: Global Crop Protection Industry Revenue Million Forecast, by Application Mode 2020 & 2033
- Table 90: Global Crop Protection Industry Volume kilotons Forecast, by Application Mode 2020 & 2033
- Table 91: Global Crop Protection Industry Revenue Million Forecast, by Crop Type 2020 & 2033
- Table 92: Global Crop Protection Industry Volume kilotons Forecast, by Crop Type 2020 & 2033
- Table 93: Global Crop Protection Industry Revenue Million Forecast, by Function 2020 & 2033
- Table 94: Global Crop Protection Industry Volume kilotons Forecast, by Function 2020 & 2033
- Table 95: Global Crop Protection Industry Revenue Million Forecast, by Application Mode 2020 & 2033
- Table 96: Global Crop Protection Industry Volume kilotons Forecast, by Application Mode 2020 & 2033
- Table 97: Global Crop Protection Industry Revenue Million Forecast, by Crop Type 2020 & 2033
- Table 98: Global Crop Protection Industry Volume kilotons Forecast, by Crop Type 2020 & 2033
- Table 99: Global Crop Protection Industry Revenue Million Forecast, by Country 2020 & 2033
- Table 100: Global Crop Protection Industry Volume kilotons Forecast, by Country 2020 & 2033
- Table 101: Turkey Crop Protection Industry Revenue (Million) Forecast, by Application 2020 & 2033
- Table 102: Turkey Crop Protection Industry Volume (kilotons) Forecast, by Application 2020 & 2033
- Table 103: Israel Crop Protection Industry Revenue (Million) Forecast, by Application 2020 & 2033
- Table 104: Israel Crop Protection Industry Volume (kilotons) Forecast, by Application 2020 & 2033
- Table 105: GCC Crop Protection Industry Revenue (Million) Forecast, by Application 2020 & 2033
- Table 106: GCC Crop Protection Industry Volume (kilotons) Forecast, by Application 2020 & 2033
- Table 107: North Africa Crop Protection Industry Revenue (Million) Forecast, by Application 2020 & 2033
- Table 108: North Africa Crop Protection Industry Volume (kilotons) Forecast, by Application 2020 & 2033
- Table 109: South Africa Crop Protection Industry Revenue (Million) Forecast, by Application 2020 & 2033
- Table 110: South Africa Crop Protection Industry Volume (kilotons) Forecast, by Application 2020 & 2033
- Table 111: Rest of Middle East & Africa Crop Protection Industry Revenue (Million) Forecast, by Application 2020 & 2033
- Table 112: Rest of Middle East & Africa Crop Protection Industry Volume (kilotons) Forecast, by Application 2020 & 2033
- Table 113: Global Crop Protection Industry Revenue Million Forecast, by Function 2020 & 2033
- Table 114: Global Crop Protection Industry Volume kilotons Forecast, by Function 2020 & 2033
- Table 115: Global Crop Protection Industry Revenue Million Forecast, by Application Mode 2020 & 2033
- Table 116: Global Crop Protection Industry Volume kilotons Forecast, by Application Mode 2020 & 2033
- Table 117: Global Crop Protection Industry Revenue Million Forecast, by Crop Type 2020 & 2033
- Table 118: Global Crop Protection Industry Volume kilotons Forecast, by Crop Type 2020 & 2033
- Table 119: Global Crop Protection Industry Revenue Million Forecast, by Function 2020 & 2033
- Table 120: Global Crop Protection Industry Volume kilotons Forecast, by Function 2020 & 2033
- Table 121: Global Crop Protection Industry Revenue Million Forecast, by Application Mode 2020 & 2033
- Table 122: Global Crop Protection Industry Volume kilotons Forecast, by Application Mode 2020 & 2033
- Table 123: Global Crop Protection Industry Revenue Million Forecast, by Crop Type 2020 & 2033
- Table 124: Global Crop Protection Industry Volume kilotons Forecast, by Crop Type 2020 & 2033
- Table 125: Global Crop Protection Industry Revenue Million Forecast, by Country 2020 & 2033
- Table 126: Global Crop Protection Industry Volume kilotons Forecast, by Country 2020 & 2033
- Table 127: China Crop Protection Industry Revenue (Million) Forecast, by Application 2020 & 2033
- Table 128: China Crop Protection Industry Volume (kilotons) Forecast, by Application 2020 & 2033
- Table 129: India Crop Protection Industry Revenue (Million) Forecast, by Application 2020 & 2033
- Table 130: India Crop Protection Industry Volume (kilotons) Forecast, by Application 2020 & 2033
- Table 131: Japan Crop Protection Industry Revenue (Million) Forecast, by Application 2020 & 2033
- Table 132: Japan Crop Protection Industry Volume (kilotons) Forecast, by Application 2020 & 2033
- Table 133: South Korea Crop Protection Industry Revenue (Million) Forecast, by Application 2020 & 2033
- Table 134: South Korea Crop Protection Industry Volume (kilotons) Forecast, by Application 2020 & 2033
- Table 135: ASEAN Crop Protection Industry Revenue (Million) Forecast, by Application 2020 & 2033
- Table 136: ASEAN Crop Protection Industry Volume (kilotons) Forecast, by Application 2020 & 2033
- Table 137: Oceania Crop Protection Industry Revenue (Million) Forecast, by Application 2020 & 2033
- Table 138: Oceania Crop Protection Industry Volume (kilotons) Forecast, by Application 2020 & 2033
- Table 139: Rest of Asia Pacific Crop Protection Industry Revenue (Million) Forecast, by Application 2020 & 2033
- Table 140: Rest of Asia Pacific Crop Protection Industry Volume (kilotons) Forecast, by Application 2020 & 2033
Frequently Asked Questions
1. What is the projected Compound Annual Growth Rate (CAGR) of the Crop Protection Industry?
The projected CAGR is approximately 5.60%.
2. Which companies are prominent players in the Crop Protection Industry?
Key companies in the market include FMC Corporation, Sumitomo Chemical Co Ltd, ADAMA Agricultural Solutions Ltd, Bayer AG, UPL Limite, Syngenta Group, Jiangsu Yangnong Chemical Co Ltd, Corteva Agriscience, Nufarm Ltd, BASF SE.
3. What are the main segments of the Crop Protection Industry?
The market segments include Function, Application Mode, Crop Type, Function, Application Mode, Crop Type.
4. Can you provide details about the market size?
The market size is estimated to be USD XX Million as of 2022.
5. What are some drivers contributing to market growth?
Seed Treatment As A Solution To Enhance Yield; Growing Awareness For Seed Treatment Among The Farmers; Rising Trend Of Organic Farming.
6. What are the notable trends driving market growth?
OTHER KEY INDUSTRY TRENDS COVERED IN THE REPORT.
7. Are there any restraints impacting market growth?
Limitations Across Farm-Level Seed Treatment; Rising Environmental Concerns.
8. Can you provide examples of recent developments in the market?
December 2023: ADAMA introduced its most advanced cross-spectrum herbicide called Kampai for the grain business. The new product provides the broadest application window for broadleaf and narrow-leaf weed control for cereal crops.July 2023: ADAMA introduced new products, Davai A Plus and Clearfield Broad-Spectrum Herbicide Solutions, for imidazolinone-tolerant legumes like lentils, peas, and soybeans.April 2023: Nufarm launched a new liquid formulation fungicide, Tourney EZ, exclusively for turf and ornamental crops based on customer demand, which further strengthens the company's role in turf and ornamental crop protection.
9. What pricing options are available for accessing the report?
Pricing options include single-user, multi-user, and enterprise licenses priced at USD 3800, USD 4500, and USD 5800 respectively.
10. Is the market size provided in terms of value or volume?
The market size is provided in terms of value, measured in Million and volume, measured in kilotons.
11. Are there any specific market keywords associated with the report?
Yes, the market keyword associated with the report is "Crop Protection Industry," which aids in identifying and referencing the specific market segment covered.
12. How do I determine which pricing option suits my needs best?
The pricing options vary based on user requirements and access needs. Individual users may opt for single-user licenses, while businesses requiring broader access may choose multi-user or enterprise licenses for cost-effective access to the report.
13. Are there any additional resources or data provided in the Crop Protection Industry report?
While the report offers comprehensive insights, it's advisable to review the specific contents or supplementary materials provided to ascertain if additional resources or data are available.
14. How can I stay updated on further developments or reports in the Crop Protection Industry?
To stay informed about further developments, trends, and reports in the Crop Protection Industry, consider subscribing to industry newsletters, following relevant companies and organizations, or regularly checking reputable industry news sources and publications.
Methodology
Step 1 - Identification of Relevant Samples Size from Population Database


Step 2 - Approaches for Defining Global Market Size (Value, Volume* & Price*)

Note*: In applicable scenarios
Step 3 - Data Sources
Primary Research
- Web Analytics
- Survey Reports
- Research Institute
- Latest Research Reports
- Opinion Leaders
Secondary Research
- Annual Reports
- White Paper
- Latest Press Release
- Industry Association
- Paid Database
- Investor Presentations

Step 4 - Data Triangulation
Involves using different sources of information in order to increase the validity of a study
These sources are likely to be stakeholders in a program - participants, other researchers, program staff, other community members, and so on.
Then we put all data in single framework & apply various statistical tools to find out the dynamic on the market.
During the analysis stage, feedback from the stakeholder groups would be compared to determine areas of agreement as well as areas of divergence