

Key Insights
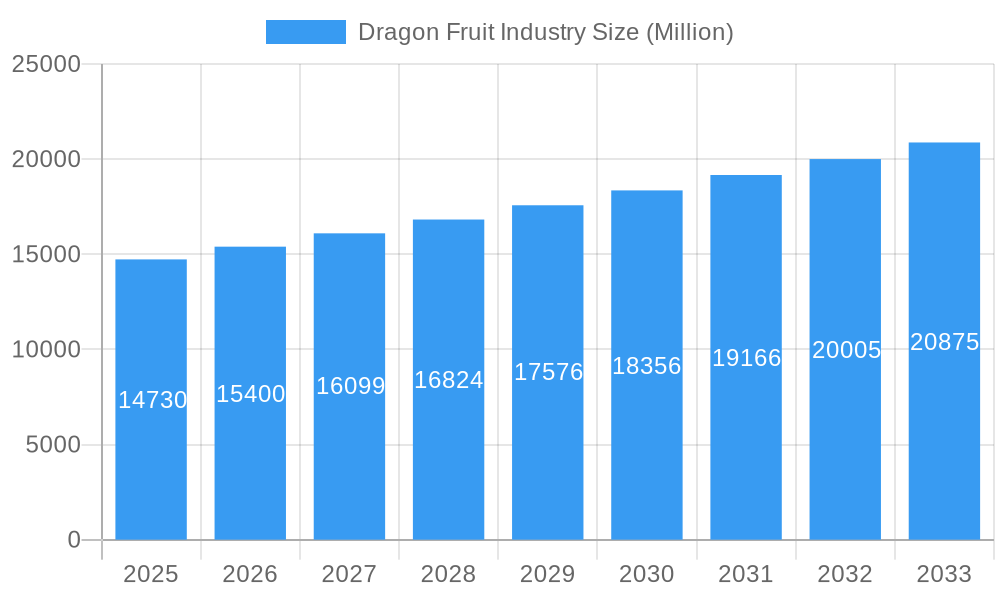
The global dragon fruit market, valued at $14.73 billion in 2025, is projected to experience robust growth, driven by increasing consumer awareness of its nutritional benefits and versatile culinary applications. The market's Compound Annual Growth Rate (CAGR) of 4.40% from 2025 to 2033 indicates a steady expansion, fueled by rising demand for exotic fruits and health-conscious consumers seeking natural sources of vitamins and antioxidants. Key drivers include the growing popularity of dragon fruit in smoothies, juices, and desserts, as well as its increasing use as a natural food coloring agent in processed foods and beverages. The processed food segment is expected to show significant growth, driven by innovation in product development and convenient ready-to-eat options. Furthermore, the expansion of retail channels, including online platforms, facilitates wider market penetration and accessibility for consumers. While challenges such as seasonal availability and perishability exist, advancements in preservation techniques and cold chain logistics are mitigating these restraints. The North American and Asia-Pacific regions currently hold significant market shares, primarily due to established consumer preferences and robust distribution networks. However, expanding markets in Europe and South America present significant growth opportunities for producers and distributors.
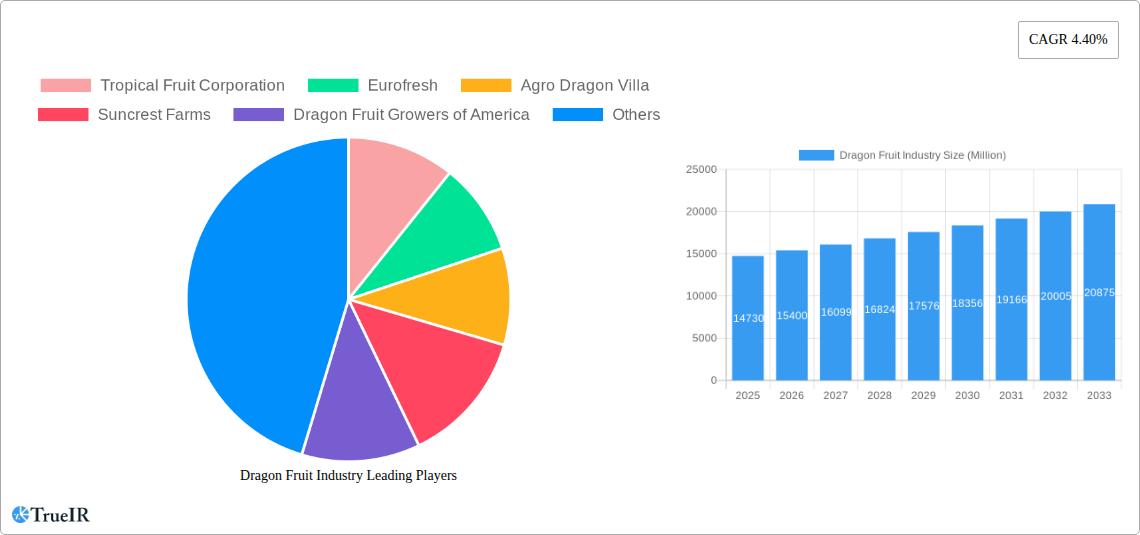
Dragon Fruit Industry Market Size (In Billion)
The competitive landscape is characterized by a mix of established players and emerging businesses. Large-scale producers benefit from economies of scale and established supply chains, while smaller farms and cooperatives contribute to the market’s diversity and focus on niche products and local distribution. Future market growth hinges on continued innovation in product diversification, expanding distribution channels (especially online), and targeted marketing campaigns that effectively communicate the health benefits and versatility of dragon fruit. Sustainable farming practices and environmental consciousness will also be increasingly important factors influencing consumer choice and industry sustainability. The ongoing focus on research and development to improve cultivation techniques and extend shelf life will play a crucial role in further bolstering market growth.
Dragon Fruit Industry Company Market Share
Dynamic Dragon Fruit Industry Market Report: 2019-2033
This comprehensive report provides an in-depth analysis of the global dragon fruit industry, offering invaluable insights for stakeholders seeking to navigate this dynamic market. With a focus on market size, growth trends, competitive landscape, and future projections, this report covers the period 2019-2033, using 2025 as the base year. The report leverages extensive primary and secondary research to provide actionable intelligence for strategic decision-making. The global dragon fruit market is projected to reach xx Million by 2033, exhibiting a robust CAGR of xx% during the forecast period (2025-2033).
Dragon Fruit Industry Market Structure & Competitive Landscape
The dragon fruit industry is characterized by a moderately fragmented market structure, indicating a dynamic competitive environment with a substantial number of participants. Several key players are actively competing for significant market share. In 2025, the top five leading companies—Tropical Fruit Corporation, Eurofresh, Agro Dragon Villa, Suncrest Farms, and Dragon Fruit Growers of America—collectively commanded an estimated [XX]% market share. Projections suggest a slight increase in market concentration by 2033, a trend primarily fueled by strategic mergers and acquisitions (M&A) and the continued expansion initiatives of established larger entities.
- Innovation Drivers: Advancements in agricultural technology, including sophisticated cultivation techniques, optimized processing methods, and the development of innovative packaging solutions, are key catalysts for innovation within the industry. These advancements aim to enhance yield, quality, and market appeal.
- Regulatory Impacts: The diverse regulatory landscapes across different geographical regions significantly influence production, processing standards, and international trade. A global harmonization of these standards is anticipated to act as a facilitator for broader market growth and accessibility.
- Product Substitutes: While direct substitutes for dragon fruit are limited, consumers may, based on price fluctuations and seasonal availability, opt for other exotic or commonly available fruits. The unique appeal and health benefits of dragon fruit, however, differentiate it in the market.
- End-User Segmentation: The retail sector currently represents the primary consumption channel for dragon fruit. However, the foodservice sector is also a significant contributor. Emerging industrial applications, particularly the extraction of natural colorants and ingredients, are experiencing notable growth, signifying a diversification of end-use markets.
- M&A Trends: A steady pace of M&A activity is anticipated. Companies are strategically engaging in these transactions to broaden their geographical footprint, access new markets, and diversify their product offerings. In the historical period spanning from 2019 to 2024, the total M&A value within the sector was estimated at [XX] Million.
Dragon Fruit Industry Market Trends & Opportunities
The dragon fruit industry is currently experiencing a robust growth trajectory, propelled by escalating consumer awareness regarding its impressive health benefits, a burgeoning demand for exotic and nutrient-rich fruits, and successful expansion into hitherto untapped global markets. The market size, estimated at [XX] Million in 2025, is forecast to expand significantly, reaching an anticipated [XX] Million by 2033. Continuous technological advancements in cultivation practices, processing techniques, and packaging innovations are instrumental in enhancing operational efficiency and elevating product quality. Consumer preferences are increasingly leaning towards convenient and value-added product formats, such as processed foods and ready-to-drink beverages derived from dragon fruit. Furthermore, the growing integration of dragon fruit into health and wellness products is a substantial contributor to the market's sustained expansion. The competitive landscape is marked by an increasing trend towards product diversification and the emergence of agile new market entrants, fostering a dynamic and evolving marketplace.
Dominant Markets & Segments in Dragon Fruit Industry
The Asia-Pacific region currently dominates the global dragon fruit market, driven by strong local production and consumption. Within this region, Vietnam and Thailand are key players.
Key Growth Drivers:
- Strong Local Demand: High domestic consumption fuels market growth in several Asian countries.
- Favorable Climate: Suitable climatic conditions support extensive cultivation.
- Government Support: Policies promoting agricultural development and export activities contribute to market expansion.
Segment Dominance:
- Product: Fresh consumption currently accounts for the largest market share. Processed food products and beverages are showing promising growth. Natural colorants represent a niche segment with significant potential.
- End-User: The retail segment holds the largest share, followed by the foodservice industry. Industrial applications are emerging.
- Distribution Channel: Offline channels currently dominate, with online sales gradually gaining traction.
Country Analysis: Vietnam, Thailand, and other Southeast Asian countries lead in production and export, while the US, Europe, and other regions are showing strong import growth.
Dragon Fruit Industry Product Analysis
Product innovation within the dragon fruit industry is increasingly focusing on the development and marketing of value-added derivatives. This includes a growing array of products such as meticulously processed frozen dragon fruit pulp, pure dragon fruit juices, and a diverse range of dragon fruit-infused beverages. The market is also observing a discernible rise in the availability of ready-to-eat (RTE) dragon fruit products and the adoption of convenient, consumer-friendly packaging formats. These innovative offerings are directly addressing the evolving consumer demand for convenience, ease of use, and health-conscious food options. Simultaneously, technological breakthroughs in advanced processing and sophisticated preservation methods are playing a critical role in not only enhancing overall product quality but also extending shelf-life and preserving the fruit's rich nutritional profile.
Key Drivers, Barriers & Challenges in Dragon Fruit Industry
Key Drivers:
- Health Benefits: A primary driver is the escalating global awareness of dragon fruit's potent nutritional value and its associated health benefits, including its antioxidant properties and vitamin content.
- Expanding Applications: The inherent versatility of dragon fruit in diverse culinary applications, ranging from fresh consumption to its use in smoothies, desserts, and savory dishes, is attracting a broader consumer base.
- Technological Advancements: Continuous improvements and innovations in cultivation techniques, such as advanced irrigation, pest control, and climate-controlled farming, coupled with enhanced processing technologies, are significantly boosting agricultural productivity and overall market efficiency.
Challenges:
- Perishability: The inherent short shelf life of dragon fruit poses a significant logistical hurdle for effective supply chain management, necessitating rapid transit and specialized handling. Estimated annual losses due to spoilage are substantial, potentially reaching [XX] Million.
- Seasonal Production: The highly seasonal nature of dragon fruit production can lead to fluctuations in supply and, consequently, impact market prices, creating periods of scarcity and abundance.
- Competition: The increasing competition from a variety of other exotic and tropical fruits, which may offer similar or perceived benefits at different price points, exerts considerable pressure on dragon fruit pricing strategies.
Growth Drivers in the Dragon Fruit Industry Market
The industry benefits from the increasing demand for functional foods, rising health consciousness, and growing popularity of exotic fruits in developed and developing markets. Favorable government policies in key producing regions also contribute to growth. Technological advancements such as improved cultivation techniques and processing methods enhance production efficiency and product quality.
Challenges Impacting Dragon Fruit Industry Growth
Challenges include the fruit's perishability, leading to significant post-harvest losses. Seasonal production patterns create supply chain vulnerabilities. Competition from other fruits and fluctuating prices pose additional obstacles. Strict regulations in some export markets also impact the industry's growth potential.
Key Players Shaping the Dragon Fruit Industry Market
- Tropical Fruit Corporation
- Eurofresh
- Agro Dragon Villa
- Suncrest Farms
- Dragon Fruit Growers of America
- Miami Fruit
- Fruit Lovers
- [Add New Prominent Player Here]
- [Add New Emerging Player Here]
Significant Dragon Fruit Industry Milestones
- 2020: Introduction of a new, disease-resistant dragon fruit variety by Tropical Fruit Corporation.
- 2021: Eurofresh expands its dragon fruit processing facilities in Vietnam.
- 2022: Agro Dragon Villa secures a major export contract with a European retailer.
- 2023: Suncrest Farms implements sustainable farming practices across its dragon fruit orchards.
- 2024: Merger between two smaller dragon fruit producers in Thailand.
Future Outlook for Dragon Fruit Industry Market
The dragon fruit industry is poised for continued growth, driven by increasing consumer demand, technological advancements, and expansion into new markets. Strategic opportunities exist in product diversification, value-added product development, and enhanced supply chain management. The market's future success hinges on addressing the challenges of perishability and seasonality. The potential for expansion in niche markets, like natural colorants, also presents substantial opportunities.
Dragon Fruit Industry Segmentation
- 1. Production Analysis
- 2. Consumption Analysis
- 3. Import Market Analysis (Value & Volume)
- 4. Export Market Analysis (Value & Volume)
- 5. Price Trend Analysis
Dragon Fruit Industry Segmentation By Geography
-
1. North America
- 1.1. United States
- 1.2. Canada
- 1.3. Mexico
-
2. Europe
- 2.1. Germany
- 2.2. UK
- 2.3. France
- 2.4. Netherlands
-
3. Asia Pacific
- 3.1. China
- 3.2. Vietnam
- 3.3. Cambodia
- 3.4. India
- 3.5. Thailand
- 3.6. Indonesia
-
4. South America
- 4.1. Brazil
- 4.2. Columbia
- 4.3. Argentina
-
5. Middle East and Africa
- 5.1. South Africa
- 5.2. Israel
- 5.3. Egypt
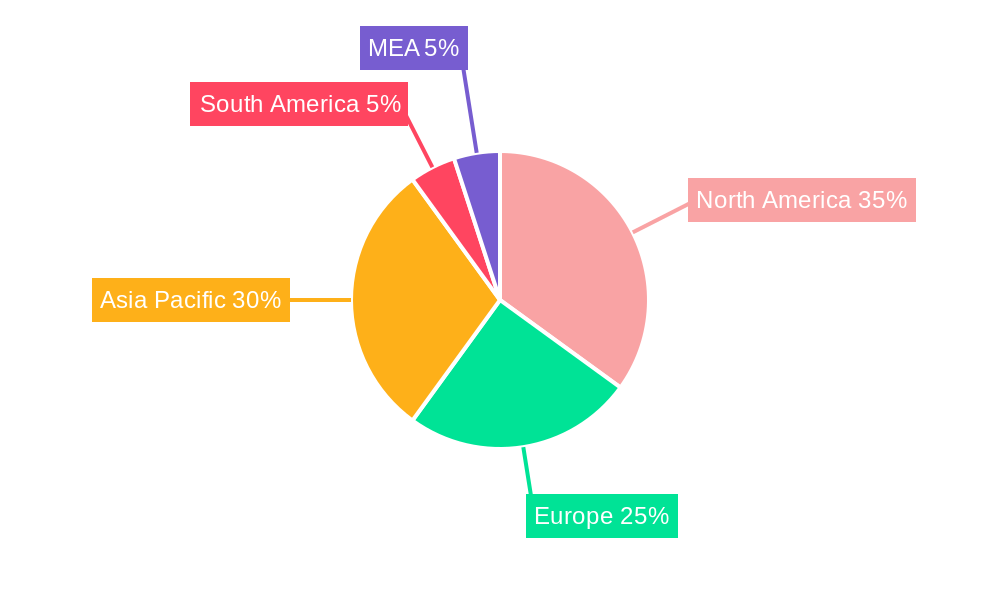
Dragon Fruit Industry Regional Market Share
Geographic Coverage of Dragon Fruit Industry
Dragon Fruit Industry REPORT HIGHLIGHTS
| Aspects | Details |
|---|---|
| Study Period | 2020-2034 |
| Base Year | 2025 |
| Estimated Year | 2026 |
| Forecast Period | 2026-2034 |
| Historical Period | 2020-2025 |
| Growth Rate | CAGR of 4.40% from 2020-2034 |
| Segmentation |
|
Table of Contents
- 1. Introduction
- 1.1. Research Scope
- 1.2. Market Segmentation
- 1.3. Research Methodology
- 1.4. Definitions and Assumptions
- 2. Executive Summary
- 2.1. Introduction
- 3. Market Dynamics
- 3.1. Introduction
- 3.2. Market Drivers
- 3.2.1. Increasing Demand for Garlic Due to Various Uses in Industries; Rising Demad of Organic Garlic; Increasing Government Initiatives
- 3.3. Market Restrains
- 3.3.1. Lack of Technical Knowledge of Farmers; Price Fluctuations
- 3.4. Market Trends
- 3.4.1. Growing Demand for Dragon Fruit in China
- 4. Market Factor Analysis
- 4.1. Porters Five Forces
- 4.2. Supply/Value Chain
- 4.3. PESTEL analysis
- 4.4. Market Entropy
- 4.5. Patent/Trademark Analysis
- 5. Global Dragon Fruit Industry Analysis, Insights and Forecast, 2020-2032
- 5.1. Market Analysis, Insights and Forecast - by Production Analysis
- 5.2. Market Analysis, Insights and Forecast - by Consumption Analysis
- 5.3. Market Analysis, Insights and Forecast - by Import Market Analysis (Value & Volume)
- 5.4. Market Analysis, Insights and Forecast - by Export Market Analysis (Value & Volume)
- 5.5. Market Analysis, Insights and Forecast - by Price Trend Analysis
- 5.6. Market Analysis, Insights and Forecast - by Region
- 5.6.1. North America
- 5.6.2. Europe
- 5.6.3. Asia Pacific
- 5.6.4. South America
- 5.6.5. Middle East and Africa
- 5.1. Market Analysis, Insights and Forecast - by Production Analysis
- 6. North America Dragon Fruit Industry Analysis, Insights and Forecast, 2020-2032
- 6.1. Market Analysis, Insights and Forecast - by Production Analysis
- 6.2. Market Analysis, Insights and Forecast - by Consumption Analysis
- 6.3. Market Analysis, Insights and Forecast - by Import Market Analysis (Value & Volume)
- 6.4. Market Analysis, Insights and Forecast - by Export Market Analysis (Value & Volume)
- 6.5. Market Analysis, Insights and Forecast - by Price Trend Analysis
- 6.1. Market Analysis, Insights and Forecast - by Production Analysis
- 7. Europe Dragon Fruit Industry Analysis, Insights and Forecast, 2020-2032
- 7.1. Market Analysis, Insights and Forecast - by Production Analysis
- 7.2. Market Analysis, Insights and Forecast - by Consumption Analysis
- 7.3. Market Analysis, Insights and Forecast - by Import Market Analysis (Value & Volume)
- 7.4. Market Analysis, Insights and Forecast - by Export Market Analysis (Value & Volume)
- 7.5. Market Analysis, Insights and Forecast - by Price Trend Analysis
- 7.1. Market Analysis, Insights and Forecast - by Production Analysis
- 8. Asia Pacific Dragon Fruit Industry Analysis, Insights and Forecast, 2020-2032
- 8.1. Market Analysis, Insights and Forecast - by Production Analysis
- 8.2. Market Analysis, Insights and Forecast - by Consumption Analysis
- 8.3. Market Analysis, Insights and Forecast - by Import Market Analysis (Value & Volume)
- 8.4. Market Analysis, Insights and Forecast - by Export Market Analysis (Value & Volume)
- 8.5. Market Analysis, Insights and Forecast - by Price Trend Analysis
- 8.1. Market Analysis, Insights and Forecast - by Production Analysis
- 9. South America Dragon Fruit Industry Analysis, Insights and Forecast, 2020-2032
- 9.1. Market Analysis, Insights and Forecast - by Production Analysis
- 9.2. Market Analysis, Insights and Forecast - by Consumption Analysis
- 9.3. Market Analysis, Insights and Forecast - by Import Market Analysis (Value & Volume)
- 9.4. Market Analysis, Insights and Forecast - by Export Market Analysis (Value & Volume)
- 9.5. Market Analysis, Insights and Forecast - by Price Trend Analysis
- 9.1. Market Analysis, Insights and Forecast - by Production Analysis
- 10. Middle East and Africa Dragon Fruit Industry Analysis, Insights and Forecast, 2020-2032
- 10.1. Market Analysis, Insights and Forecast - by Production Analysis
- 10.2. Market Analysis, Insights and Forecast - by Consumption Analysis
- 10.3. Market Analysis, Insights and Forecast - by Import Market Analysis (Value & Volume)
- 10.4. Market Analysis, Insights and Forecast - by Export Market Analysis (Value & Volume)
- 10.5. Market Analysis, Insights and Forecast - by Price Trend Analysis
- 10.1. Market Analysis, Insights and Forecast - by Production Analysis
- 11. Competitive Analysis
- 11.1. Global Market Share Analysis 2025
- 11.2. Company Profiles
- 11.2.1 Tropical Fruit Corporation
- 11.2.1.1. Overview
- 11.2.1.2. Products
- 11.2.1.3. SWOT Analysis
- 11.2.1.4. Recent Developments
- 11.2.1.5. Financials (Based on Availability)
- 11.2.2 Eurofresh
- 11.2.2.1. Overview
- 11.2.2.2. Products
- 11.2.2.3. SWOT Analysis
- 11.2.2.4. Recent Developments
- 11.2.2.5. Financials (Based on Availability)
- 11.2.3 Agro Dragon Villa
- 11.2.3.1. Overview
- 11.2.3.2. Products
- 11.2.3.3. SWOT Analysis
- 11.2.3.4. Recent Developments
- 11.2.3.5. Financials (Based on Availability)
- 11.2.4 Suncrest Farms
- 11.2.4.1. Overview
- 11.2.4.2. Products
- 11.2.4.3. SWOT Analysis
- 11.2.4.4. Recent Developments
- 11.2.4.5. Financials (Based on Availability)
- 11.2.5 Dragon Fruit Growers of America
- 11.2.5.1. Overview
- 11.2.5.2. Products
- 11.2.5.3. SWOT Analysis
- 11.2.5.4. Recent Developments
- 11.2.5.5. Financials (Based on Availability)
- 11.2.6 Miami Fruit
- 11.2.6.1. Overview
- 11.2.6.2. Products
- 11.2.6.3. SWOT Analysis
- 11.2.6.4. Recent Developments
- 11.2.6.5. Financials (Based on Availability)
- 11.2.7 Fruit Lovers
- 11.2.7.1. Overview
- 11.2.7.2. Products
- 11.2.7.3. SWOT Analysis
- 11.2.7.4. Recent Developments
- 11.2.7.5. Financials (Based on Availability)
- 11.2.1 Tropical Fruit Corporation
List of Figures
- Figure 1: Global Dragon Fruit Industry Revenue Breakdown (Million, %) by Region 2025 & 2033
- Figure 2: North America Dragon Fruit Industry Revenue (Million), by Production Analysis 2025 & 2033
- Figure 3: North America Dragon Fruit Industry Revenue Share (%), by Production Analysis 2025 & 2033
- Figure 4: North America Dragon Fruit Industry Revenue (Million), by Consumption Analysis 2025 & 2033
- Figure 5: North America Dragon Fruit Industry Revenue Share (%), by Consumption Analysis 2025 & 2033
- Figure 6: North America Dragon Fruit Industry Revenue (Million), by Import Market Analysis (Value & Volume) 2025 & 2033
- Figure 7: North America Dragon Fruit Industry Revenue Share (%), by Import Market Analysis (Value & Volume) 2025 & 2033
- Figure 8: North America Dragon Fruit Industry Revenue (Million), by Export Market Analysis (Value & Volume) 2025 & 2033
- Figure 9: North America Dragon Fruit Industry Revenue Share (%), by Export Market Analysis (Value & Volume) 2025 & 2033
- Figure 10: North America Dragon Fruit Industry Revenue (Million), by Price Trend Analysis 2025 & 2033
- Figure 11: North America Dragon Fruit Industry Revenue Share (%), by Price Trend Analysis 2025 & 2033
- Figure 12: North America Dragon Fruit Industry Revenue (Million), by Country 2025 & 2033
- Figure 13: North America Dragon Fruit Industry Revenue Share (%), by Country 2025 & 2033
- Figure 14: Europe Dragon Fruit Industry Revenue (Million), by Production Analysis 2025 & 2033
- Figure 15: Europe Dragon Fruit Industry Revenue Share (%), by Production Analysis 2025 & 2033
- Figure 16: Europe Dragon Fruit Industry Revenue (Million), by Consumption Analysis 2025 & 2033
- Figure 17: Europe Dragon Fruit Industry Revenue Share (%), by Consumption Analysis 2025 & 2033
- Figure 18: Europe Dragon Fruit Industry Revenue (Million), by Import Market Analysis (Value & Volume) 2025 & 2033
- Figure 19: Europe Dragon Fruit Industry Revenue Share (%), by Import Market Analysis (Value & Volume) 2025 & 2033
- Figure 20: Europe Dragon Fruit Industry Revenue (Million), by Export Market Analysis (Value & Volume) 2025 & 2033
- Figure 21: Europe Dragon Fruit Industry Revenue Share (%), by Export Market Analysis (Value & Volume) 2025 & 2033
- Figure 22: Europe Dragon Fruit Industry Revenue (Million), by Price Trend Analysis 2025 & 2033
- Figure 23: Europe Dragon Fruit Industry Revenue Share (%), by Price Trend Analysis 2025 & 2033
- Figure 24: Europe Dragon Fruit Industry Revenue (Million), by Country 2025 & 2033
- Figure 25: Europe Dragon Fruit Industry Revenue Share (%), by Country 2025 & 2033
- Figure 26: Asia Pacific Dragon Fruit Industry Revenue (Million), by Production Analysis 2025 & 2033
- Figure 27: Asia Pacific Dragon Fruit Industry Revenue Share (%), by Production Analysis 2025 & 2033
- Figure 28: Asia Pacific Dragon Fruit Industry Revenue (Million), by Consumption Analysis 2025 & 2033
- Figure 29: Asia Pacific Dragon Fruit Industry Revenue Share (%), by Consumption Analysis 2025 & 2033
- Figure 30: Asia Pacific Dragon Fruit Industry Revenue (Million), by Import Market Analysis (Value & Volume) 2025 & 2033
- Figure 31: Asia Pacific Dragon Fruit Industry Revenue Share (%), by Import Market Analysis (Value & Volume) 2025 & 2033
- Figure 32: Asia Pacific Dragon Fruit Industry Revenue (Million), by Export Market Analysis (Value & Volume) 2025 & 2033
- Figure 33: Asia Pacific Dragon Fruit Industry Revenue Share (%), by Export Market Analysis (Value & Volume) 2025 & 2033
- Figure 34: Asia Pacific Dragon Fruit Industry Revenue (Million), by Price Trend Analysis 2025 & 2033
- Figure 35: Asia Pacific Dragon Fruit Industry Revenue Share (%), by Price Trend Analysis 2025 & 2033
- Figure 36: Asia Pacific Dragon Fruit Industry Revenue (Million), by Country 2025 & 2033
- Figure 37: Asia Pacific Dragon Fruit Industry Revenue Share (%), by Country 2025 & 2033
- Figure 38: South America Dragon Fruit Industry Revenue (Million), by Production Analysis 2025 & 2033
- Figure 39: South America Dragon Fruit Industry Revenue Share (%), by Production Analysis 2025 & 2033
- Figure 40: South America Dragon Fruit Industry Revenue (Million), by Consumption Analysis 2025 & 2033
- Figure 41: South America Dragon Fruit Industry Revenue Share (%), by Consumption Analysis 2025 & 2033
- Figure 42: South America Dragon Fruit Industry Revenue (Million), by Import Market Analysis (Value & Volume) 2025 & 2033
- Figure 43: South America Dragon Fruit Industry Revenue Share (%), by Import Market Analysis (Value & Volume) 2025 & 2033
- Figure 44: South America Dragon Fruit Industry Revenue (Million), by Export Market Analysis (Value & Volume) 2025 & 2033
- Figure 45: South America Dragon Fruit Industry Revenue Share (%), by Export Market Analysis (Value & Volume) 2025 & 2033
- Figure 46: South America Dragon Fruit Industry Revenue (Million), by Price Trend Analysis 2025 & 2033
- Figure 47: South America Dragon Fruit Industry Revenue Share (%), by Price Trend Analysis 2025 & 2033
- Figure 48: South America Dragon Fruit Industry Revenue (Million), by Country 2025 & 2033
- Figure 49: South America Dragon Fruit Industry Revenue Share (%), by Country 2025 & 2033
- Figure 50: Middle East and Africa Dragon Fruit Industry Revenue (Million), by Production Analysis 2025 & 2033
- Figure 51: Middle East and Africa Dragon Fruit Industry Revenue Share (%), by Production Analysis 2025 & 2033
- Figure 52: Middle East and Africa Dragon Fruit Industry Revenue (Million), by Consumption Analysis 2025 & 2033
- Figure 53: Middle East and Africa Dragon Fruit Industry Revenue Share (%), by Consumption Analysis 2025 & 2033
- Figure 54: Middle East and Africa Dragon Fruit Industry Revenue (Million), by Import Market Analysis (Value & Volume) 2025 & 2033
- Figure 55: Middle East and Africa Dragon Fruit Industry Revenue Share (%), by Import Market Analysis (Value & Volume) 2025 & 2033
- Figure 56: Middle East and Africa Dragon Fruit Industry Revenue (Million), by Export Market Analysis (Value & Volume) 2025 & 2033
- Figure 57: Middle East and Africa Dragon Fruit Industry Revenue Share (%), by Export Market Analysis (Value & Volume) 2025 & 2033
- Figure 58: Middle East and Africa Dragon Fruit Industry Revenue (Million), by Price Trend Analysis 2025 & 2033
- Figure 59: Middle East and Africa Dragon Fruit Industry Revenue Share (%), by Price Trend Analysis 2025 & 2033
- Figure 60: Middle East and Africa Dragon Fruit Industry Revenue (Million), by Country 2025 & 2033
- Figure 61: Middle East and Africa Dragon Fruit Industry Revenue Share (%), by Country 2025 & 2033
List of Tables
- Table 1: Global Dragon Fruit Industry Revenue Million Forecast, by Production Analysis 2020 & 2033
- Table 2: Global Dragon Fruit Industry Revenue Million Forecast, by Consumption Analysis 2020 & 2033
- Table 3: Global Dragon Fruit Industry Revenue Million Forecast, by Import Market Analysis (Value & Volume) 2020 & 2033
- Table 4: Global Dragon Fruit Industry Revenue Million Forecast, by Export Market Analysis (Value & Volume) 2020 & 2033
- Table 5: Global Dragon Fruit Industry Revenue Million Forecast, by Price Trend Analysis 2020 & 2033
- Table 6: Global Dragon Fruit Industry Revenue Million Forecast, by Region 2020 & 2033
- Table 7: Global Dragon Fruit Industry Revenue Million Forecast, by Production Analysis 2020 & 2033
- Table 8: Global Dragon Fruit Industry Revenue Million Forecast, by Consumption Analysis 2020 & 2033
- Table 9: Global Dragon Fruit Industry Revenue Million Forecast, by Import Market Analysis (Value & Volume) 2020 & 2033
- Table 10: Global Dragon Fruit Industry Revenue Million Forecast, by Export Market Analysis (Value & Volume) 2020 & 2033
- Table 11: Global Dragon Fruit Industry Revenue Million Forecast, by Price Trend Analysis 2020 & 2033
- Table 12: Global Dragon Fruit Industry Revenue Million Forecast, by Country 2020 & 2033
- Table 13: United States Dragon Fruit Industry Revenue (Million) Forecast, by Application 2020 & 2033
- Table 14: Canada Dragon Fruit Industry Revenue (Million) Forecast, by Application 2020 & 2033
- Table 15: Mexico Dragon Fruit Industry Revenue (Million) Forecast, by Application 2020 & 2033
- Table 16: Global Dragon Fruit Industry Revenue Million Forecast, by Production Analysis 2020 & 2033
- Table 17: Global Dragon Fruit Industry Revenue Million Forecast, by Consumption Analysis 2020 & 2033
- Table 18: Global Dragon Fruit Industry Revenue Million Forecast, by Import Market Analysis (Value & Volume) 2020 & 2033
- Table 19: Global Dragon Fruit Industry Revenue Million Forecast, by Export Market Analysis (Value & Volume) 2020 & 2033
- Table 20: Global Dragon Fruit Industry Revenue Million Forecast, by Price Trend Analysis 2020 & 2033
- Table 21: Global Dragon Fruit Industry Revenue Million Forecast, by Country 2020 & 2033
- Table 22: Germany Dragon Fruit Industry Revenue (Million) Forecast, by Application 2020 & 2033
- Table 23: UK Dragon Fruit Industry Revenue (Million) Forecast, by Application 2020 & 2033
- Table 24: France Dragon Fruit Industry Revenue (Million) Forecast, by Application 2020 & 2033
- Table 25: Netherlands Dragon Fruit Industry Revenue (Million) Forecast, by Application 2020 & 2033
- Table 26: Global Dragon Fruit Industry Revenue Million Forecast, by Production Analysis 2020 & 2033
- Table 27: Global Dragon Fruit Industry Revenue Million Forecast, by Consumption Analysis 2020 & 2033
- Table 28: Global Dragon Fruit Industry Revenue Million Forecast, by Import Market Analysis (Value & Volume) 2020 & 2033
- Table 29: Global Dragon Fruit Industry Revenue Million Forecast, by Export Market Analysis (Value & Volume) 2020 & 2033
- Table 30: Global Dragon Fruit Industry Revenue Million Forecast, by Price Trend Analysis 2020 & 2033
- Table 31: Global Dragon Fruit Industry Revenue Million Forecast, by Country 2020 & 2033
- Table 32: China Dragon Fruit Industry Revenue (Million) Forecast, by Application 2020 & 2033
- Table 33: Vietnam Dragon Fruit Industry Revenue (Million) Forecast, by Application 2020 & 2033
- Table 34: Cambodia Dragon Fruit Industry Revenue (Million) Forecast, by Application 2020 & 2033
- Table 35: India Dragon Fruit Industry Revenue (Million) Forecast, by Application 2020 & 2033
- Table 36: Thailand Dragon Fruit Industry Revenue (Million) Forecast, by Application 2020 & 2033
- Table 37: Indonesia Dragon Fruit Industry Revenue (Million) Forecast, by Application 2020 & 2033
- Table 38: Global Dragon Fruit Industry Revenue Million Forecast, by Production Analysis 2020 & 2033
- Table 39: Global Dragon Fruit Industry Revenue Million Forecast, by Consumption Analysis 2020 & 2033
- Table 40: Global Dragon Fruit Industry Revenue Million Forecast, by Import Market Analysis (Value & Volume) 2020 & 2033
- Table 41: Global Dragon Fruit Industry Revenue Million Forecast, by Export Market Analysis (Value & Volume) 2020 & 2033
- Table 42: Global Dragon Fruit Industry Revenue Million Forecast, by Price Trend Analysis 2020 & 2033
- Table 43: Global Dragon Fruit Industry Revenue Million Forecast, by Country 2020 & 2033
- Table 44: Brazil Dragon Fruit Industry Revenue (Million) Forecast, by Application 2020 & 2033
- Table 45: Columbia Dragon Fruit Industry Revenue (Million) Forecast, by Application 2020 & 2033
- Table 46: Argentina Dragon Fruit Industry Revenue (Million) Forecast, by Application 2020 & 2033
- Table 47: Global Dragon Fruit Industry Revenue Million Forecast, by Production Analysis 2020 & 2033
- Table 48: Global Dragon Fruit Industry Revenue Million Forecast, by Consumption Analysis 2020 & 2033
- Table 49: Global Dragon Fruit Industry Revenue Million Forecast, by Import Market Analysis (Value & Volume) 2020 & 2033
- Table 50: Global Dragon Fruit Industry Revenue Million Forecast, by Export Market Analysis (Value & Volume) 2020 & 2033
- Table 51: Global Dragon Fruit Industry Revenue Million Forecast, by Price Trend Analysis 2020 & 2033
- Table 52: Global Dragon Fruit Industry Revenue Million Forecast, by Country 2020 & 2033
- Table 53: South Africa Dragon Fruit Industry Revenue (Million) Forecast, by Application 2020 & 2033
- Table 54: Israel Dragon Fruit Industry Revenue (Million) Forecast, by Application 2020 & 2033
- Table 55: Egypt Dragon Fruit Industry Revenue (Million) Forecast, by Application 2020 & 2033
Frequently Asked Questions
1. What is the projected Compound Annual Growth Rate (CAGR) of the Dragon Fruit Industry?
The projected CAGR is approximately 4.40%.
2. Which companies are prominent players in the Dragon Fruit Industry?
Key companies in the market include Tropical Fruit Corporation , Eurofresh , Agro Dragon Villa , Suncrest Farms , Dragon Fruit Growers of America , Miami Fruit , Fruit Lovers.
3. What are the main segments of the Dragon Fruit Industry?
The market segments include Production Analysis, Consumption Analysis, Import Market Analysis (Value & Volume), Export Market Analysis (Value & Volume), Price Trend Analysis.
4. Can you provide details about the market size?
The market size is estimated to be USD 14.73 Million as of 2022.
5. What are some drivers contributing to market growth?
Increasing Demand for Garlic Due to Various Uses in Industries; Rising Demad of Organic Garlic; Increasing Government Initiatives.
6. What are the notable trends driving market growth?
Growing Demand for Dragon Fruit in China.
7. Are there any restraints impacting market growth?
Lack of Technical Knowledge of Farmers; Price Fluctuations.
8. Can you provide examples of recent developments in the market?
N/A
9. What pricing options are available for accessing the report?
Pricing options include single-user, multi-user, and enterprise licenses priced at USD 4750, USD 5250, and USD 8750 respectively.
10. Is the market size provided in terms of value or volume?
The market size is provided in terms of value, measured in Million.
11. Are there any specific market keywords associated with the report?
Yes, the market keyword associated with the report is "Dragon Fruit Industry," which aids in identifying and referencing the specific market segment covered.
12. How do I determine which pricing option suits my needs best?
The pricing options vary based on user requirements and access needs. Individual users may opt for single-user licenses, while businesses requiring broader access may choose multi-user or enterprise licenses for cost-effective access to the report.
13. Are there any additional resources or data provided in the Dragon Fruit Industry report?
While the report offers comprehensive insights, it's advisable to review the specific contents or supplementary materials provided to ascertain if additional resources or data are available.
14. How can I stay updated on further developments or reports in the Dragon Fruit Industry?
To stay informed about further developments, trends, and reports in the Dragon Fruit Industry, consider subscribing to industry newsletters, following relevant companies and organizations, or regularly checking reputable industry news sources and publications.
Methodology
Step 1 - Identification of Relevant Samples Size from Population Database


Step 2 - Approaches for Defining Global Market Size (Value, Volume* & Price*)

Note*: In applicable scenarios
Step 3 - Data Sources
Primary Research
- Web Analytics
- Survey Reports
- Research Institute
- Latest Research Reports
- Opinion Leaders
Secondary Research
- Annual Reports
- White Paper
- Latest Press Release
- Industry Association
- Paid Database
- Investor Presentations

Step 4 - Data Triangulation
Involves using different sources of information in order to increase the validity of a study
These sources are likely to be stakeholders in a program - participants, other researchers, program staff, other community members, and so on.
Then we put all data in single framework & apply various statistical tools to find out the dynamic on the market.
During the analysis stage, feedback from the stakeholder groups would be compared to determine areas of agreement as well as areas of divergence