

Key Insights
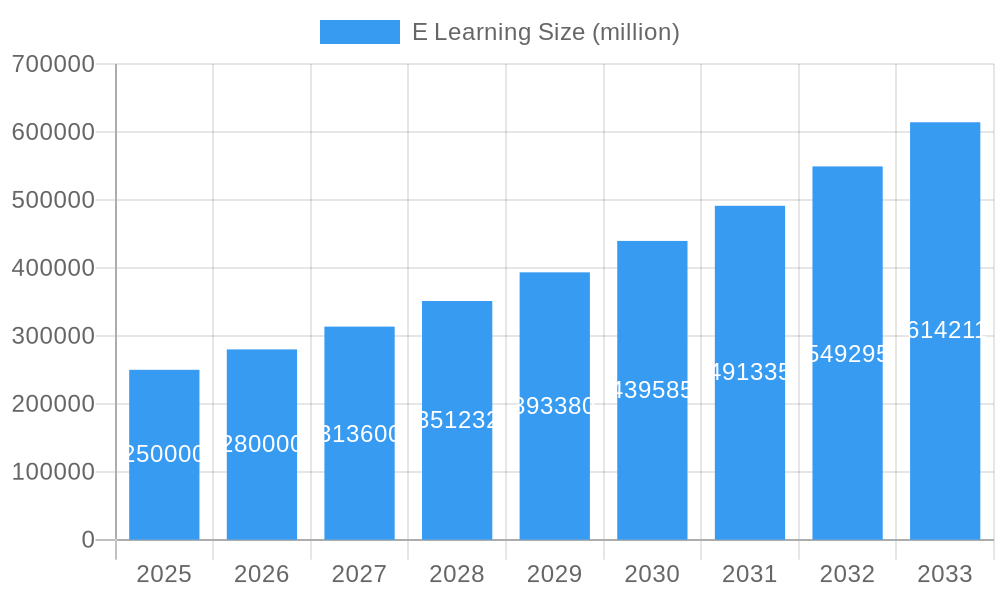
The global E-learning market is poised for significant expansion, projected to reach approximately $250 billion by 2025, with an impressive Compound Annual Growth Rate (CAGR) of around 12% from 2025 to 2033. This robust growth is primarily fueled by the increasing adoption of digital learning solutions across diverse sectors, including academia, corporate training, and government initiatives. The shift towards flexible, accessible, and personalized learning experiences is a major driver, exacerbated by the ongoing digital transformation initiatives and the need for continuous upskilling and reskilling of the workforce. Cloud-based e-learning platforms are experiencing accelerated adoption due to their scalability, cost-effectiveness, and ease of deployment, offering a compelling alternative to traditional on-premise solutions. The market's trajectory indicates a sustained upward trend, underscoring the critical role e-learning plays in modern education and professional development.
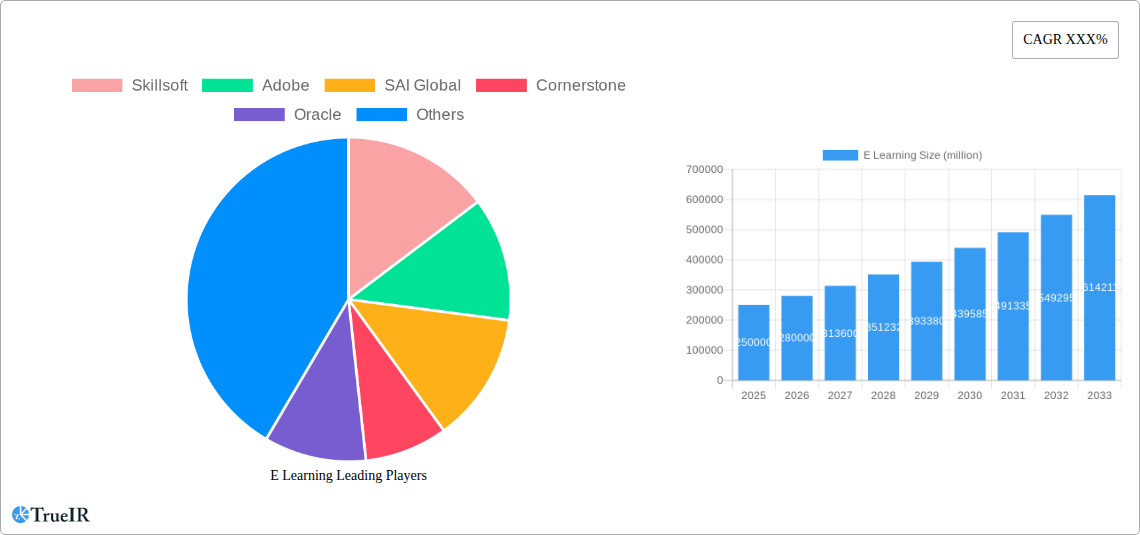
E Learning Market Size (In Billion)
Key trends shaping the e-learning landscape include the integration of artificial intelligence and machine learning for personalized learning paths and adaptive content delivery, the rise of microlearning and gamification for enhanced engagement, and the growing demand for mobile learning solutions. While the market benefits from these innovations and widespread demand, certain restraints, such as the initial implementation costs for some organizations and the digital divide that limits access in certain regions, are being progressively addressed. Geographically, North America and Europe currently lead in market adoption, driven by developed economies and strong technological infrastructure. However, the Asia Pacific region, with its burgeoning economies and large populations, is emerging as a critical growth engine, witnessing rapid advancements in e-learning adoption. The competitive landscape is characterized by a mix of established technology giants and specialized e-learning providers, all vying to capture market share through innovative platforms and comprehensive content offerings.
E Learning Company Market Share
E-Learning Market: Unlocking Global Education and Corporate Training Potential (2019-2033)
This comprehensive E-Learning market report provides an in-depth analysis of the global digital learning landscape, forecasting significant growth and highlighting emerging opportunities. With a study period spanning from 2019 to 2033, a base year of 2025, and a forecast period of 2025–2033, this report leverages high-volume keywords and detailed quantitative data to offer actionable insights for stakeholders. We explore the market structure, competitive dynamics, dominant segments, technological innovations, and the key drivers and challenges shaping the future of E-Learning. The analysis covers prominent companies like Skillsoft, Adobe, SAI Global, Cornerstone, Oracle, NAVEX Global, John Wiley and Sons, Japan Foundation, SAP, Infor, Articulate, Udemy, Benesse, Justsystem, Pearson, EDX, Atama Plus, Smart Education, Schoo, StreetAcademy, CLEAR, Surala Net, Coursera, Udacity, Eden, Proseeds, NetLearning, Paiza, Skillshare, LinkedIn, Pluralsight, Uicommons, and LIGHTWORKS, across various applications including Academy, Corporate, and Government, and deployment types such as On-Premise E-Learning and Cloud-Based E-Learning.
E Learning Market Structure & Competitive Landscape
The global E-Learning market exhibits a moderately concentrated structure, with a few dominant players holding significant market share, particularly in the corporate training and higher education segments. Innovation remains a key driver, fueled by advancements in AI-powered personalized learning, gamification, and immersive technologies like VR/AR, which are transforming user engagement and learning outcomes. Regulatory impacts are generally positive, promoting digital inclusion and standardized learning, although data privacy concerns require ongoing attention. Product substitutes, such as traditional classroom learning and blended learning models, continue to coexist, but E-Learning’s scalability, accessibility, and cost-effectiveness are increasingly capturing market share. End-user segmentation reveals strong demand from the corporate sector for upskilling and reskilling initiatives, followed by academic institutions and government agencies seeking efficient training solutions. Merger and acquisition (M&A) trends are active, with companies seeking to expand their content libraries, technological capabilities, and geographic reach. For instance, the historical period saw an estimated XXX million in M&A activity, indicating a consolidation drive.
E Learning Market Trends & Opportunities
The E-Learning market is experiencing a robust growth trajectory, projected to reach a valuation of over XXX trillion by the end of the forecast period in 2033. This expansion is underpinned by a Compound Annual Growth Rate (CAGR) of approximately XX% from 2019 to 2033. Technological shifts are at the forefront of this evolution, with the integration of Artificial Intelligence (AI) for personalized learning paths, adaptive assessments, and intelligent tutoring systems becoming increasingly sophisticated. Virtual Reality (VR) and Augmented Reality (AR) are also gaining traction, offering immersive and engaging learning experiences that mimic real-world scenarios, particularly in vocational and technical training. Mobile learning continues its dominance, with learners demanding flexible access to educational content on smartphones and tablets. Consumer preferences are shifting towards microlearning modules, bite-sized content that fits busy schedules, and on-demand learning platforms that cater to specific skill development needs. The competitive dynamics are intensifying, with a continuous influx of new EdTech startups challenging established players. The rise of content aggregation platforms and the growing demand for specialized certifications are further reshaping the competitive landscape. Market penetration rates are steadily increasing across both developed and emerging economies, driven by digital transformation initiatives and the recognition of lifelong learning as a critical component of career progression. The demand for cloud-based E-Learning solutions is surging due to their scalability, accessibility, and cost-efficiency, enabling organizations and individuals to access high-quality educational resources from anywhere, at any time.
Dominant Markets & Segments in E Learning
The dominant region for E-Learning market growth is expected to be Asia-Pacific, driven by substantial investments in digital infrastructure, a burgeoning young population, and government initiatives promoting digital literacy and online education. Countries like China and India are leading this expansion, with significant market penetration and an increasing adoption of online learning platforms for both academic and professional development. Within the Application segment, the Corporate sector currently represents the largest share and is projected to maintain its dominance throughout the forecast period. Key growth drivers include:
- Upskilling and Reskilling Imperative: Rapid technological advancements and evolving industry demands necessitate continuous learning for employees to remain competitive and adaptable. Companies are investing heavily in training programs delivered through E-Learning to address skill gaps.
- Globalization and Remote Work: The increasing trend of remote work and geographically dispersed teams amplifies the need for accessible and scalable E-Learning solutions that can train employees irrespective of their location.
- Compliance and Onboarding: E-Learning platforms provide efficient and standardized methods for delivering mandatory compliance training and onboarding new employees, ensuring consistent knowledge dissemination and adherence to regulations.
- Cost-Effectiveness: Compared to traditional in-person training, E-Learning offers significant cost savings in terms of travel, accommodation, and instructor fees, making it an attractive option for organizations of all sizes.
In terms of Type, Cloud-Based E-Learning is overwhelmingly dominant and is anticipated to further consolidate its position. Key growth drivers for this segment include:
- Scalability and Flexibility: Cloud solutions offer unparalleled scalability, allowing organizations to easily adjust their learning infrastructure to accommodate varying numbers of users and content demands.
- Accessibility and Anywhere Access: Learners can access E-Learning content from any device with an internet connection, fostering a more flexible and convenient learning experience.
- Reduced IT Overhead: Organizations benefit from reduced upfront investment in hardware and software, as well as lower ongoing maintenance costs, as the cloud provider manages the infrastructure.
- Frequent Updates and Innovations: Cloud-based platforms are typically updated more frequently with new features and security enhancements, ensuring users have access to the latest technological advancements.
- Integration Capabilities: Cloud E-Learning solutions often integrate seamlessly with other enterprise systems, such as HRIS and CRM, for enhanced data management and reporting.
E Learning Product Analysis
E-Learning products are increasingly sophisticated, characterized by AI-driven personalization, interactive content formats, and robust analytics dashboards. Innovations focus on creating engaging learning experiences through gamification, virtual labs, and simulations, bridging the gap between theoretical knowledge and practical application. Competitive advantages lie in the ability to offer adaptive learning paths, real-time feedback, and comprehensive progress tracking, catering to diverse learning styles and needs. Technological advancements are enabling richer multimedia content, collaborative learning features, and seamless integration with existing enterprise systems, enhancing both user experience and learning outcomes.
Key Drivers, Barriers & Challenges in E Learning
Key Drivers: The E-Learning market is propelled by several significant drivers. Technological advancements, particularly in AI, VR, and mobile technology, enhance accessibility and engagement. The global demand for upskilling and reskilling due to rapid industry changes is a major economic driver. Government initiatives promoting digital education and lifelong learning also play a crucial role. The increasing affordability and scalability of online learning platforms make them an attractive option for educational institutions and corporations alike.
Barriers & Challenges: Despite robust growth, the E-Learning market faces challenges. Digital infrastructure disparities in certain regions can limit access. Concerns regarding data privacy and security require robust solutions. Maintaining learner engagement and combating digital fatigue are ongoing challenges for content creators and platform providers. The cost of developing high-quality, interactive content can also be a barrier for smaller organizations.
Growth Drivers in the E Learning Market
The E-Learning market is experiencing significant growth, fueled by several key factors. Technological innovation, including the widespread adoption of AI for personalized learning paths and adaptive assessments, is enhancing user experience and effectiveness. The increasing global emphasis on lifelong learning and the necessity for continuous upskilling and reskilling in a rapidly evolving job market represent strong economic drivers. Furthermore, supportive government policies aimed at digitalizing education and increasing accessibility to knowledge are creating a favorable environment for E-Learning expansion. The scalability and cost-effectiveness of online platforms compared to traditional methods are also significant contributors to this growth.
Challenges Impacting E Learning Growth
Several challenges impact the growth trajectory of the E-Learning market. Regulatory complexities, particularly concerning data privacy and intellectual property rights across different jurisdictions, can pose hurdles. While supply chains for hardware are generally stable, the rapid pace of technological innovation can create obsolescence concerns. Competitive pressures are intense, with numerous players vying for market share, driving down margins in some segments. Ensuring equitable access to high-speed internet and digital devices remains a significant challenge in underserved regions, hindering widespread adoption. The development and maintenance of high-quality, engaging digital content also require substantial investment and expertise.
Key Players Shaping the E Learning Market
- Skillsoft
- Adobe
- SAI Global
- Cornerstone
- Oracle
- NAVEX Global
- John Wiley and Sons
- Japan Foundation
- SAP
- Infor
- Articulate
- Udemy
- Benesse
- Justsystem
- Pearson
- EDX
- Atama Plus
- Smart Education
- Schoo
- StreetAcademy
- CLEAR
- Surala Net
- Coursera
- Udacity
- Eden
- Proseeds
- NetLearning
- Paiza
- Skillshare
- Pluralsight
- Uicommons
- LIGHTWORKS
Significant E Learning Industry Milestones
- 2019: Increased adoption of microlearning and personalized learning paths gain traction.
- 2020: The COVID-19 pandemic accelerates the global shift towards remote learning and E-Learning solutions across all sectors.
- 2021: Advancements in AI lead to more sophisticated adaptive learning platforms and intelligent tutoring systems.
- 2022: Growing integration of AR/VR technologies for immersive and experiential learning, particularly in vocational training.
- 2023: Expansion of corporate E-Learning for upskilling and reskilling initiatives becomes a strategic priority for businesses.
- 2024: Increased focus on data analytics and learning outcome measurement to demonstrate ROI of E-Learning programs.
Future Outlook for E Learning Market
The future outlook for the E-Learning market is exceptionally bright, driven by continuous technological innovation and an increasing global recognition of the importance of lifelong learning. Strategic opportunities lie in the further development of AI-powered personalized learning experiences, the wider adoption of immersive technologies like VR/AR for hands-on skill development, and the expansion of microlearning content tailored for on-demand skill acquisition. The market potential is vast, with growing demand from emerging economies and a persistent need for upskilling and reskilling in established markets, ensuring sustained growth and evolving learning paradigms.
E Learning Segmentation
-
1. Application
- 1.1. Academy
- 1.2. Corporate
- 1.3. Government
-
2. Type
- 2.1. On-Premise E-Learning
- 2.2. Cloud-Based E-Learning
E Learning Segmentation By Geography
-
1. North America
- 1.1. United States
- 1.2. Canada
- 1.3. Mexico
-
2. South America
- 2.1. Brazil
- 2.2. Argentina
- 2.3. Rest of South America
-
3. Europe
- 3.1. United Kingdom
- 3.2. Germany
- 3.3. France
- 3.4. Italy
- 3.5. Spain
- 3.6. Russia
- 3.7. Benelux
- 3.8. Nordics
- 3.9. Rest of Europe
-
4. Middle East & Africa
- 4.1. Turkey
- 4.2. Israel
- 4.3. GCC
- 4.4. North Africa
- 4.5. South Africa
- 4.6. Rest of Middle East & Africa
-
5. Asia Pacific
- 5.1. China
- 5.2. India
- 5.3. Japan
- 5.4. South Korea
- 5.5. ASEAN
- 5.6. Oceania
- 5.7. Rest of Asia Pacific
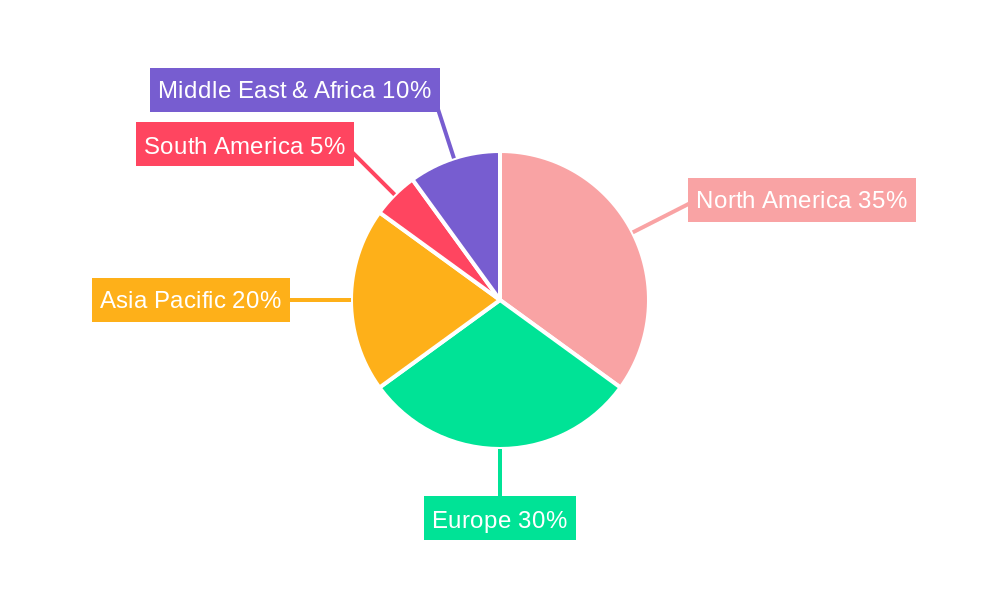
E Learning Regional Market Share
Geographic Coverage of E Learning
E Learning REPORT HIGHLIGHTS
| Aspects | Details |
|---|---|
| Study Period | 2020-2034 |
| Base Year | 2025 |
| Estimated Year | 2026 |
| Forecast Period | 2026-2034 |
| Historical Period | 2020-2025 |
| Growth Rate | CAGR of XXX% from 2020-2034 |
| Segmentation |
|
Table of Contents
- 1. Introduction
- 1.1. Research Scope
- 1.2. Market Segmentation
- 1.3. Research Methodology
- 1.4. Definitions and Assumptions
- 2. Executive Summary
- 2.1. Introduction
- 3. Market Dynamics
- 3.1. Introduction
- 3.2. Market Drivers
- 3.3. Market Restrains
- 3.4. Market Trends
- 4. Market Factor Analysis
- 4.1. Porters Five Forces
- 4.2. Supply/Value Chain
- 4.3. PESTEL analysis
- 4.4. Market Entropy
- 4.5. Patent/Trademark Analysis
- 5. Global E Learning Analysis, Insights and Forecast, 2020-2032
- 5.1. Market Analysis, Insights and Forecast - by Application
- 5.1.1. Academy
- 5.1.2. Corporate
- 5.1.3. Government
- 5.2. Market Analysis, Insights and Forecast - by Type
- 5.2.1. On-Premise E-Learning
- 5.2.2. Cloud-Based E-Learning
- 5.3. Market Analysis, Insights and Forecast - by Region
- 5.3.1. North America
- 5.3.2. South America
- 5.3.3. Europe
- 5.3.4. Middle East & Africa
- 5.3.5. Asia Pacific
- 5.1. Market Analysis, Insights and Forecast - by Application
- 6. North America E Learning Analysis, Insights and Forecast, 2020-2032
- 6.1. Market Analysis, Insights and Forecast - by Application
- 6.1.1. Academy
- 6.1.2. Corporate
- 6.1.3. Government
- 6.2. Market Analysis, Insights and Forecast - by Type
- 6.2.1. On-Premise E-Learning
- 6.2.2. Cloud-Based E-Learning
- 6.1. Market Analysis, Insights and Forecast - by Application
- 7. South America E Learning Analysis, Insights and Forecast, 2020-2032
- 7.1. Market Analysis, Insights and Forecast - by Application
- 7.1.1. Academy
- 7.1.2. Corporate
- 7.1.3. Government
- 7.2. Market Analysis, Insights and Forecast - by Type
- 7.2.1. On-Premise E-Learning
- 7.2.2. Cloud-Based E-Learning
- 7.1. Market Analysis, Insights and Forecast - by Application
- 8. Europe E Learning Analysis, Insights and Forecast, 2020-2032
- 8.1. Market Analysis, Insights and Forecast - by Application
- 8.1.1. Academy
- 8.1.2. Corporate
- 8.1.3. Government
- 8.2. Market Analysis, Insights and Forecast - by Type
- 8.2.1. On-Premise E-Learning
- 8.2.2. Cloud-Based E-Learning
- 8.1. Market Analysis, Insights and Forecast - by Application
- 9. Middle East & Africa E Learning Analysis, Insights and Forecast, 2020-2032
- 9.1. Market Analysis, Insights and Forecast - by Application
- 9.1.1. Academy
- 9.1.2. Corporate
- 9.1.3. Government
- 9.2. Market Analysis, Insights and Forecast - by Type
- 9.2.1. On-Premise E-Learning
- 9.2.2. Cloud-Based E-Learning
- 9.1. Market Analysis, Insights and Forecast - by Application
- 10. Asia Pacific E Learning Analysis, Insights and Forecast, 2020-2032
- 10.1. Market Analysis, Insights and Forecast - by Application
- 10.1.1. Academy
- 10.1.2. Corporate
- 10.1.3. Government
- 10.2. Market Analysis, Insights and Forecast - by Type
- 10.2.1. On-Premise E-Learning
- 10.2.2. Cloud-Based E-Learning
- 10.1. Market Analysis, Insights and Forecast - by Application
- 11. Competitive Analysis
- 11.1. Global Market Share Analysis 2025
- 11.2. Company Profiles
- 11.2.1 Skillsoft
- 11.2.1.1. Overview
- 11.2.1.2. Products
- 11.2.1.3. SWOT Analysis
- 11.2.1.4. Recent Developments
- 11.2.1.5. Financials (Based on Availability)
- 11.2.2 Adobe
- 11.2.2.1. Overview
- 11.2.2.2. Products
- 11.2.2.3. SWOT Analysis
- 11.2.2.4. Recent Developments
- 11.2.2.5. Financials (Based on Availability)
- 11.2.3 SAI Global
- 11.2.3.1. Overview
- 11.2.3.2. Products
- 11.2.3.3. SWOT Analysis
- 11.2.3.4. Recent Developments
- 11.2.3.5. Financials (Based on Availability)
- 11.2.4 Cornerstone
- 11.2.4.1. Overview
- 11.2.4.2. Products
- 11.2.4.3. SWOT Analysis
- 11.2.4.4. Recent Developments
- 11.2.4.5. Financials (Based on Availability)
- 11.2.5 Oracle
- 11.2.5.1. Overview
- 11.2.5.2. Products
- 11.2.5.3. SWOT Analysis
- 11.2.5.4. Recent Developments
- 11.2.5.5. Financials (Based on Availability)
- 11.2.6 NAVEX Global
- 11.2.6.1. Overview
- 11.2.6.2. Products
- 11.2.6.3. SWOT Analysis
- 11.2.6.4. Recent Developments
- 11.2.6.5. Financials (Based on Availability)
- 11.2.7 John Wiley and Sons
- 11.2.7.1. Overview
- 11.2.7.2. Products
- 11.2.7.3. SWOT Analysis
- 11.2.7.4. Recent Developments
- 11.2.7.5. Financials (Based on Availability)
- 11.2.8 Japan Foundation
- 11.2.8.1. Overview
- 11.2.8.2. Products
- 11.2.8.3. SWOT Analysis
- 11.2.8.4. Recent Developments
- 11.2.8.5. Financials (Based on Availability)
- 11.2.9 SAP
- 11.2.9.1. Overview
- 11.2.9.2. Products
- 11.2.9.3. SWOT Analysis
- 11.2.9.4. Recent Developments
- 11.2.9.5. Financials (Based on Availability)
- 11.2.10 Infor
- 11.2.10.1. Overview
- 11.2.10.2. Products
- 11.2.10.3. SWOT Analysis
- 11.2.10.4. Recent Developments
- 11.2.10.5. Financials (Based on Availability)
- 11.2.11 Articulate
- 11.2.11.1. Overview
- 11.2.11.2. Products
- 11.2.11.3. SWOT Analysis
- 11.2.11.4. Recent Developments
- 11.2.11.5. Financials (Based on Availability)
- 11.2.12 Udemy
- 11.2.12.1. Overview
- 11.2.12.2. Products
- 11.2.12.3. SWOT Analysis
- 11.2.12.4. Recent Developments
- 11.2.12.5. Financials (Based on Availability)
- 11.2.13 Benesse
- 11.2.13.1. Overview
- 11.2.13.2. Products
- 11.2.13.3. SWOT Analysis
- 11.2.13.4. Recent Developments
- 11.2.13.5. Financials (Based on Availability)
- 11.2.14 Justsystem
- 11.2.14.1. Overview
- 11.2.14.2. Products
- 11.2.14.3. SWOT Analysis
- 11.2.14.4. Recent Developments
- 11.2.14.5. Financials (Based on Availability)
- 11.2.15 Pearson
- 11.2.15.1. Overview
- 11.2.15.2. Products
- 11.2.15.3. SWOT Analysis
- 11.2.15.4. Recent Developments
- 11.2.15.5. Financials (Based on Availability)
- 11.2.16 EDX
- 11.2.16.1. Overview
- 11.2.16.2. Products
- 11.2.16.3. SWOT Analysis
- 11.2.16.4. Recent Developments
- 11.2.16.5. Financials (Based on Availability)
- 11.2.17 Atama Plus
- 11.2.17.1. Overview
- 11.2.17.2. Products
- 11.2.17.3. SWOT Analysis
- 11.2.17.4. Recent Developments
- 11.2.17.5. Financials (Based on Availability)
- 11.2.18 Smart Education
- 11.2.18.1. Overview
- 11.2.18.2. Products
- 11.2.18.3. SWOT Analysis
- 11.2.18.4. Recent Developments
- 11.2.18.5. Financials (Based on Availability)
- 11.2.19 Schoo
- 11.2.19.1. Overview
- 11.2.19.2. Products
- 11.2.19.3. SWOT Analysis
- 11.2.19.4. Recent Developments
- 11.2.19.5. Financials (Based on Availability)
- 11.2.20 StreetAcademy
- 11.2.20.1. Overview
- 11.2.20.2. Products
- 11.2.20.3. SWOT Analysis
- 11.2.20.4. Recent Developments
- 11.2.20.5. Financials (Based on Availability)
- 11.2.21 CLEAR
- 11.2.21.1. Overview
- 11.2.21.2. Products
- 11.2.21.3. SWOT Analysis
- 11.2.21.4. Recent Developments
- 11.2.21.5. Financials (Based on Availability)
- 11.2.22 Surala Net
- 11.2.22.1. Overview
- 11.2.22.2. Products
- 11.2.22.3. SWOT Analysis
- 11.2.22.4. Recent Developments
- 11.2.22.5. Financials (Based on Availability)
- 11.2.23 Coursera
- 11.2.23.1. Overview
- 11.2.23.2. Products
- 11.2.23.3. SWOT Analysis
- 11.2.23.4. Recent Developments
- 11.2.23.5. Financials (Based on Availability)
- 11.2.24 Udacity
- 11.2.24.1. Overview
- 11.2.24.2. Products
- 11.2.24.3. SWOT Analysis
- 11.2.24.4. Recent Developments
- 11.2.24.5. Financials (Based on Availability)
- 11.2.25 Eden
- 11.2.25.1. Overview
- 11.2.25.2. Products
- 11.2.25.3. SWOT Analysis
- 11.2.25.4. Recent Developments
- 11.2.25.5. Financials (Based on Availability)
- 11.2.26 Proseeds
- 11.2.26.1. Overview
- 11.2.26.2. Products
- 11.2.26.3. SWOT Analysis
- 11.2.26.4. Recent Developments
- 11.2.26.5. Financials (Based on Availability)
- 11.2.27 NetLearning
- 11.2.27.1. Overview
- 11.2.27.2. Products
- 11.2.27.3. SWOT Analysis
- 11.2.27.4. Recent Developments
- 11.2.27.5. Financials (Based on Availability)
- 11.2.28 Paiza
- 11.2.28.1. Overview
- 11.2.28.2. Products
- 11.2.28.3. SWOT Analysis
- 11.2.28.4. Recent Developments
- 11.2.28.5. Financials (Based on Availability)
- 11.2.29 Skillshare
- 11.2.29.1. Overview
- 11.2.29.2. Products
- 11.2.29.3. SWOT Analysis
- 11.2.29.4. Recent Developments
- 11.2.29.5. Financials (Based on Availability)
- 11.2.30 LinkedIn
- 11.2.30.1. Overview
- 11.2.30.2. Products
- 11.2.30.3. SWOT Analysis
- 11.2.30.4. Recent Developments
- 11.2.30.5. Financials (Based on Availability)
- 11.2.31 Pluralsight
- 11.2.31.1. Overview
- 11.2.31.2. Products
- 11.2.31.3. SWOT Analysis
- 11.2.31.4. Recent Developments
- 11.2.31.5. Financials (Based on Availability)
- 11.2.32 Uicommons
- 11.2.32.1. Overview
- 11.2.32.2. Products
- 11.2.32.3. SWOT Analysis
- 11.2.32.4. Recent Developments
- 11.2.32.5. Financials (Based on Availability)
- 11.2.33 LIGHTWORKS
- 11.2.33.1. Overview
- 11.2.33.2. Products
- 11.2.33.3. SWOT Analysis
- 11.2.33.4. Recent Developments
- 11.2.33.5. Financials (Based on Availability)
- 11.2.34 E-learning
- 11.2.34.1. Overview
- 11.2.34.2. Products
- 11.2.34.3. SWOT Analysis
- 11.2.34.4. Recent Developments
- 11.2.34.5. Financials (Based on Availability)
- 11.2.1 Skillsoft
List of Figures
- Figure 1: Global E Learning Revenue Breakdown (million, %) by Region 2025 & 2033
- Figure 2: North America E Learning Revenue (million), by Application 2025 & 2033
- Figure 3: North America E Learning Revenue Share (%), by Application 2025 & 2033
- Figure 4: North America E Learning Revenue (million), by Type 2025 & 2033
- Figure 5: North America E Learning Revenue Share (%), by Type 2025 & 2033
- Figure 6: North America E Learning Revenue (million), by Country 2025 & 2033
- Figure 7: North America E Learning Revenue Share (%), by Country 2025 & 2033
- Figure 8: South America E Learning Revenue (million), by Application 2025 & 2033
- Figure 9: South America E Learning Revenue Share (%), by Application 2025 & 2033
- Figure 10: South America E Learning Revenue (million), by Type 2025 & 2033
- Figure 11: South America E Learning Revenue Share (%), by Type 2025 & 2033
- Figure 12: South America E Learning Revenue (million), by Country 2025 & 2033
- Figure 13: South America E Learning Revenue Share (%), by Country 2025 & 2033
- Figure 14: Europe E Learning Revenue (million), by Application 2025 & 2033
- Figure 15: Europe E Learning Revenue Share (%), by Application 2025 & 2033
- Figure 16: Europe E Learning Revenue (million), by Type 2025 & 2033
- Figure 17: Europe E Learning Revenue Share (%), by Type 2025 & 2033
- Figure 18: Europe E Learning Revenue (million), by Country 2025 & 2033
- Figure 19: Europe E Learning Revenue Share (%), by Country 2025 & 2033
- Figure 20: Middle East & Africa E Learning Revenue (million), by Application 2025 & 2033
- Figure 21: Middle East & Africa E Learning Revenue Share (%), by Application 2025 & 2033
- Figure 22: Middle East & Africa E Learning Revenue (million), by Type 2025 & 2033
- Figure 23: Middle East & Africa E Learning Revenue Share (%), by Type 2025 & 2033
- Figure 24: Middle East & Africa E Learning Revenue (million), by Country 2025 & 2033
- Figure 25: Middle East & Africa E Learning Revenue Share (%), by Country 2025 & 2033
- Figure 26: Asia Pacific E Learning Revenue (million), by Application 2025 & 2033
- Figure 27: Asia Pacific E Learning Revenue Share (%), by Application 2025 & 2033
- Figure 28: Asia Pacific E Learning Revenue (million), by Type 2025 & 2033
- Figure 29: Asia Pacific E Learning Revenue Share (%), by Type 2025 & 2033
- Figure 30: Asia Pacific E Learning Revenue (million), by Country 2025 & 2033
- Figure 31: Asia Pacific E Learning Revenue Share (%), by Country 2025 & 2033
List of Tables
- Table 1: Global E Learning Revenue million Forecast, by Application 2020 & 2033
- Table 2: Global E Learning Revenue million Forecast, by Type 2020 & 2033
- Table 3: Global E Learning Revenue million Forecast, by Region 2020 & 2033
- Table 4: Global E Learning Revenue million Forecast, by Application 2020 & 2033
- Table 5: Global E Learning Revenue million Forecast, by Type 2020 & 2033
- Table 6: Global E Learning Revenue million Forecast, by Country 2020 & 2033
- Table 7: United States E Learning Revenue (million) Forecast, by Application 2020 & 2033
- Table 8: Canada E Learning Revenue (million) Forecast, by Application 2020 & 2033
- Table 9: Mexico E Learning Revenue (million) Forecast, by Application 2020 & 2033
- Table 10: Global E Learning Revenue million Forecast, by Application 2020 & 2033
- Table 11: Global E Learning Revenue million Forecast, by Type 2020 & 2033
- Table 12: Global E Learning Revenue million Forecast, by Country 2020 & 2033
- Table 13: Brazil E Learning Revenue (million) Forecast, by Application 2020 & 2033
- Table 14: Argentina E Learning Revenue (million) Forecast, by Application 2020 & 2033
- Table 15: Rest of South America E Learning Revenue (million) Forecast, by Application 2020 & 2033
- Table 16: Global E Learning Revenue million Forecast, by Application 2020 & 2033
- Table 17: Global E Learning Revenue million Forecast, by Type 2020 & 2033
- Table 18: Global E Learning Revenue million Forecast, by Country 2020 & 2033
- Table 19: United Kingdom E Learning Revenue (million) Forecast, by Application 2020 & 2033
- Table 20: Germany E Learning Revenue (million) Forecast, by Application 2020 & 2033
- Table 21: France E Learning Revenue (million) Forecast, by Application 2020 & 2033
- Table 22: Italy E Learning Revenue (million) Forecast, by Application 2020 & 2033
- Table 23: Spain E Learning Revenue (million) Forecast, by Application 2020 & 2033
- Table 24: Russia E Learning Revenue (million) Forecast, by Application 2020 & 2033
- Table 25: Benelux E Learning Revenue (million) Forecast, by Application 2020 & 2033
- Table 26: Nordics E Learning Revenue (million) Forecast, by Application 2020 & 2033
- Table 27: Rest of Europe E Learning Revenue (million) Forecast, by Application 2020 & 2033
- Table 28: Global E Learning Revenue million Forecast, by Application 2020 & 2033
- Table 29: Global E Learning Revenue million Forecast, by Type 2020 & 2033
- Table 30: Global E Learning Revenue million Forecast, by Country 2020 & 2033
- Table 31: Turkey E Learning Revenue (million) Forecast, by Application 2020 & 2033
- Table 32: Israel E Learning Revenue (million) Forecast, by Application 2020 & 2033
- Table 33: GCC E Learning Revenue (million) Forecast, by Application 2020 & 2033
- Table 34: North Africa E Learning Revenue (million) Forecast, by Application 2020 & 2033
- Table 35: South Africa E Learning Revenue (million) Forecast, by Application 2020 & 2033
- Table 36: Rest of Middle East & Africa E Learning Revenue (million) Forecast, by Application 2020 & 2033
- Table 37: Global E Learning Revenue million Forecast, by Application 2020 & 2033
- Table 38: Global E Learning Revenue million Forecast, by Type 2020 & 2033
- Table 39: Global E Learning Revenue million Forecast, by Country 2020 & 2033
- Table 40: China E Learning Revenue (million) Forecast, by Application 2020 & 2033
- Table 41: India E Learning Revenue (million) Forecast, by Application 2020 & 2033
- Table 42: Japan E Learning Revenue (million) Forecast, by Application 2020 & 2033
- Table 43: South Korea E Learning Revenue (million) Forecast, by Application 2020 & 2033
- Table 44: ASEAN E Learning Revenue (million) Forecast, by Application 2020 & 2033
- Table 45: Oceania E Learning Revenue (million) Forecast, by Application 2020 & 2033
- Table 46: Rest of Asia Pacific E Learning Revenue (million) Forecast, by Application 2020 & 2033
Frequently Asked Questions
1. What is the projected Compound Annual Growth Rate (CAGR) of the E Learning?
The projected CAGR is approximately XXX%.
2. Which companies are prominent players in the E Learning?
Key companies in the market include Skillsoft, Adobe, SAI Global, Cornerstone, Oracle, NAVEX Global, John Wiley and Sons, Japan Foundation, SAP, Infor, Articulate, Udemy, Benesse, Justsystem, Pearson, EDX, Atama Plus, Smart Education, Schoo, StreetAcademy, CLEAR, Surala Net, Coursera, Udacity, Eden, Proseeds, NetLearning, Paiza, Skillshare, LinkedIn, Pluralsight, Uicommons, LIGHTWORKS, E-learning.
3. What are the main segments of the E Learning?
The market segments include Application, Type.
4. Can you provide details about the market size?
The market size is estimated to be USD XXX million as of 2022.
5. What are some drivers contributing to market growth?
N/A
6. What are the notable trends driving market growth?
N/A
7. Are there any restraints impacting market growth?
N/A
8. Can you provide examples of recent developments in the market?
N/A
9. What pricing options are available for accessing the report?
Pricing options include single-user, multi-user, and enterprise licenses priced at USD 2900.00, USD 4350.00, and USD 5800.00 respectively.
10. Is the market size provided in terms of value or volume?
The market size is provided in terms of value, measured in million.
11. Are there any specific market keywords associated with the report?
Yes, the market keyword associated with the report is "E Learning," which aids in identifying and referencing the specific market segment covered.
12. How do I determine which pricing option suits my needs best?
The pricing options vary based on user requirements and access needs. Individual users may opt for single-user licenses, while businesses requiring broader access may choose multi-user or enterprise licenses for cost-effective access to the report.
13. Are there any additional resources or data provided in the E Learning report?
While the report offers comprehensive insights, it's advisable to review the specific contents or supplementary materials provided to ascertain if additional resources or data are available.
14. How can I stay updated on further developments or reports in the E Learning?
To stay informed about further developments, trends, and reports in the E Learning, consider subscribing to industry newsletters, following relevant companies and organizations, or regularly checking reputable industry news sources and publications.
Methodology
Step 1 - Identification of Relevant Samples Size from Population Database


Step 2 - Approaches for Defining Global Market Size (Value, Volume* & Price*)

Note*: In applicable scenarios
Step 3 - Data Sources
Primary Research
- Web Analytics
- Survey Reports
- Research Institute
- Latest Research Reports
- Opinion Leaders
Secondary Research
- Annual Reports
- White Paper
- Latest Press Release
- Industry Association
- Paid Database
- Investor Presentations

Step 4 - Data Triangulation
Involves using different sources of information in order to increase the validity of a study
These sources are likely to be stakeholders in a program - participants, other researchers, program staff, other community members, and so on.
Then we put all data in single framework & apply various statistical tools to find out the dynamic on the market.
During the analysis stage, feedback from the stakeholder groups would be compared to determine areas of agreement as well as areas of divergence