

Key Insights
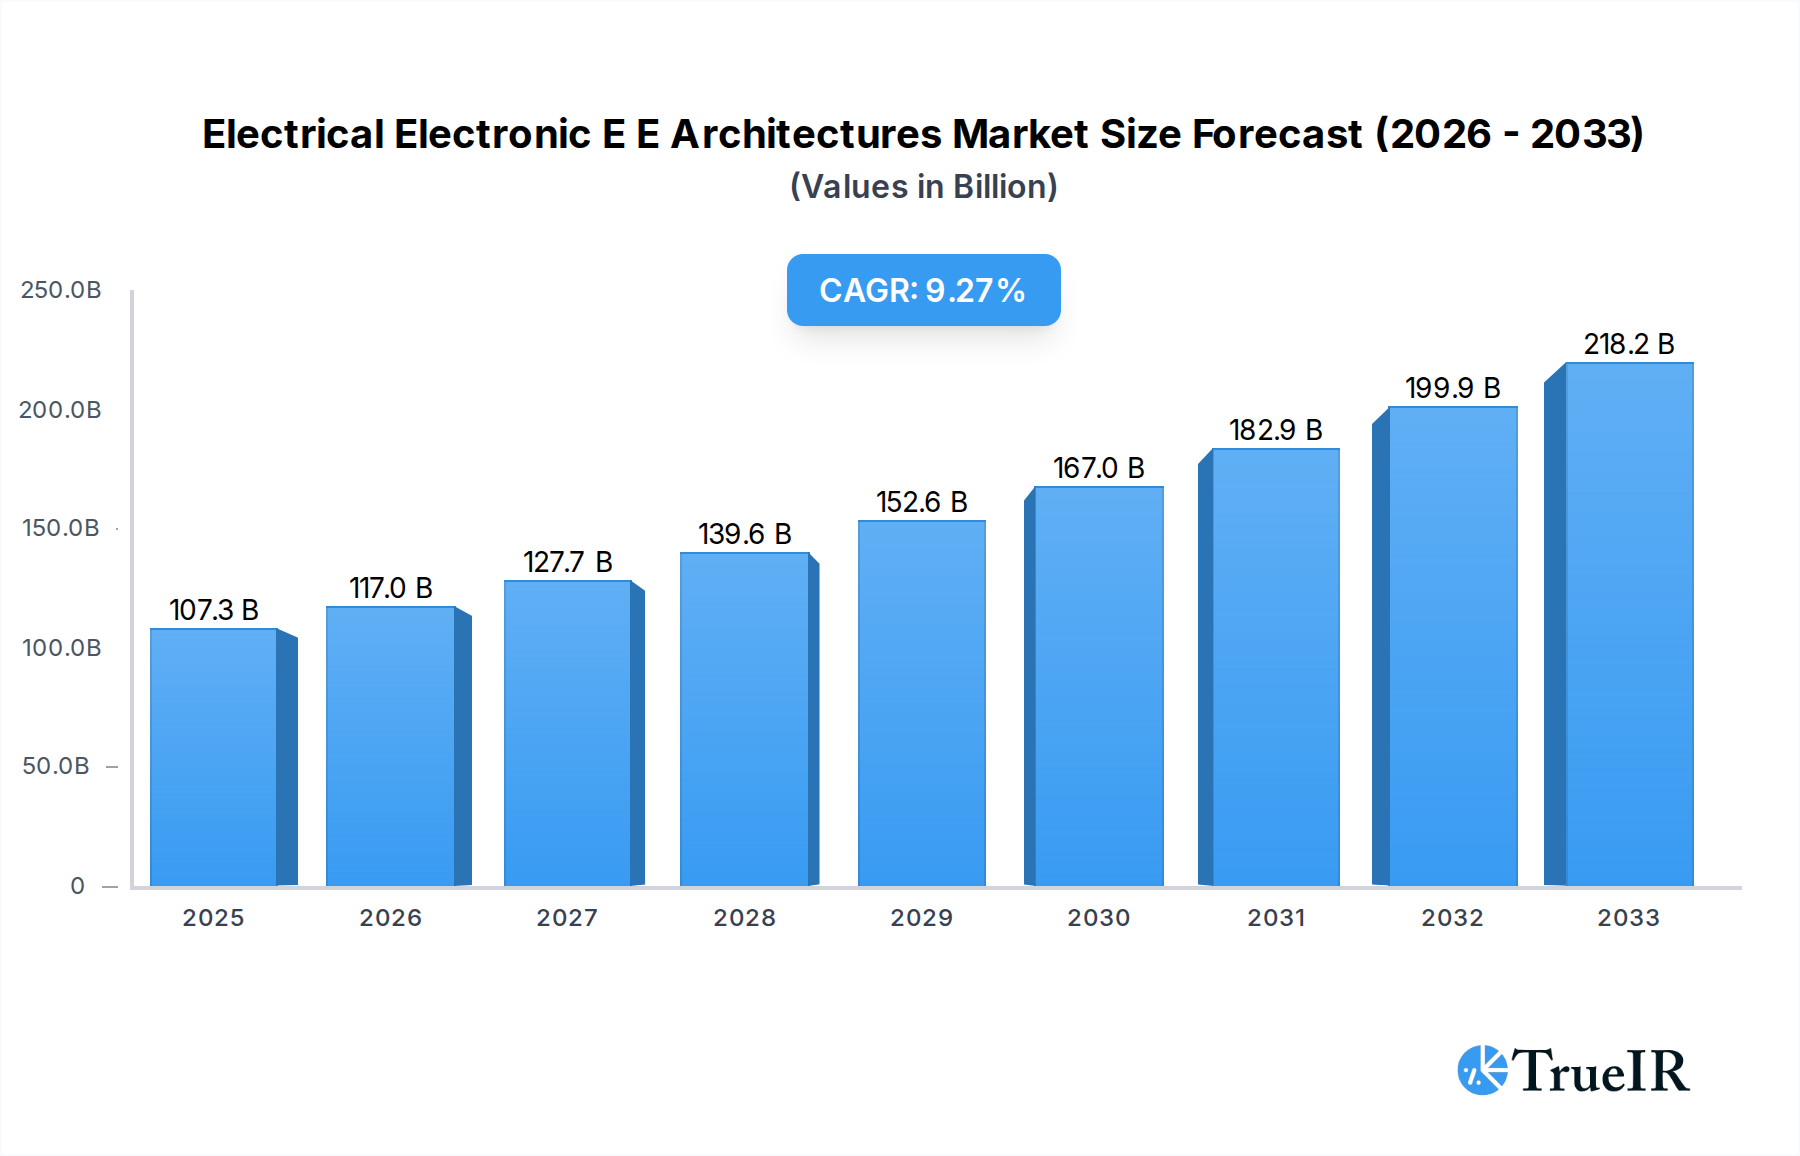
The global Electrical and Electronic (E/E) Architectures market is poised for robust expansion, with an estimated market size of $107,330 million and a projected Compound Annual Growth Rate (CAGR) of 9.3% between 2019 and 2033. This significant growth is primarily driven by the increasing complexity and sophistication of vehicle electronics, fueled by the relentless pursuit of advanced driver-assistance systems (ADAS), autonomous driving capabilities, and enhanced in-car connectivity. The automotive sector stands as the dominant application segment, reflecting the industry's rapid transformation towards electrified and intelligent mobility solutions. Emerging trends such as the shift towards centralized E/E architectures, over-the-air (OTA) updates for software-defined vehicles, and the integration of artificial intelligence (AI) within automotive systems are further accelerating market penetration. These advancements necessitate more powerful, efficient, and interconnected E/E platforms to manage the burgeoning data streams and functionalities.

Electrical Electronic E E Architectures Market Size (In Billion)
The market's trajectory is also significantly influenced by stringent safety regulations and evolving consumer demands for safer, more comfortable, and personalized driving experiences. While the opportunities are substantial, the market faces certain restraints, including the high cost of R&D and component integration, as well as cybersecurity concerns that need to be meticulously addressed. Nevertheless, the strategic importance of E/E architectures in enabling future mobility concepts, from electric vehicles to smart city integration, ensures sustained investment and innovation. Key industry players like Bosch GmbH, Continental AG, Aptiv PLC, and Siemens are actively investing in next-generation E/E architectures, focusing on modular designs, high-performance computing, and robust cybersecurity measures to capture market share and drive the future of automotive electronics. The Asia Pacific region, particularly China and Japan, is expected to be a major growth engine due to its strong automotive manufacturing base and rapid adoption of advanced automotive technologies.
Electrical Electronic E E Architectures Company Market Share
Comprehensive Report: Electrical Electronic E/E Architectures Market Dynamics, Trends, and Future Outlook (2019–2033)
This in-depth report provides a detailed analysis of the global Electrical Electronic (E/E) Architectures market, a critical component driving innovation across the Automotive, Aerospace, and Off-Highway industries. With a study period spanning from 2019 to 2033, a base year of 2025, and a forecast period of 2025–2033, this report offers unparalleled insights into market structure, competitive landscape, emerging trends, technological advancements, and future growth trajectories. It leverages high-volume keywords such as "Automotive E/E Architecture," "Electrical System," "Embedded Software," "Vehicle Electrification," "Autonomous Driving," and "Connected Cars" to ensure maximum SEO optimization and engagement with industry professionals.
Electrical Electronic E E Architectures Market Structure & Competitive Landscape
The Electrical Electronic (E/E) Architectures market exhibits a dynamic and evolving competitive landscape, characterized by a moderate to high concentration in specific segments, particularly within the automotive sector. Leading players are heavily investing in research and development to drive innovation, fueled by the increasing complexity of vehicle electronics and the burgeoning demand for advanced driver-assistance systems (ADAS), autonomous driving capabilities, and in-car connectivity. Regulatory impacts, such as stringent safety standards and emissions regulations, are significant innovation drivers, pushing manufacturers to adopt more sophisticated and efficient E/E architectures. Product substitutes, while present in the form of incremental upgrades to existing systems, are increasingly being overshadowed by disruptive architectural shifts like zonal and domain-based designs. End-user segmentation reveals a clear dominance of the automotive sector, followed by aerospace and off-highway applications, each with unique technological requirements and adoption timelines. Merger and acquisition (M&A) trends are evident as companies seek to consolidate market position, acquire specialized technologies, and expand their geographical reach. In the historical period (2019–2024), approximately xx billion USD in M&A deals were recorded within the broader automotive electronics space, indicating a strong appetite for strategic consolidation and technological integration. Concentration ratios for key E/E architecture components suggest a tier of dominant players holding significant market share, while emerging technologies create opportunities for new entrants.
Electrical Electronic E E Architectures Market Trends & Opportunities
The Electrical Electronic (E/E) Architectures market is experiencing robust growth, projected to reach a market size of over one trillion USD by the end of the forecast period. This expansion is driven by a confluence of powerful technological shifts, evolving consumer preferences, and intensifying competitive dynamics. The relentless pursuit of vehicle electrification, coupled with the rapid advancement of autonomous driving technologies, has fundamentally reshaped the E/E architecture landscape. Consumers are increasingly demanding sophisticated in-car experiences, including advanced infotainment systems, seamless connectivity, and personalized digital services, all of which necessitate more powerful and flexible E/E architectures. The transition from distributed to centralized and zonal architectures is a paramount trend, offering greater scalability, reduced wiring complexity, and improved software management capabilities. This architectural evolution is critical for accommodating the massive influx of sensors, processing power, and data flow required for Level 3 and above autonomous driving. Furthermore, the integration of artificial intelligence (AI) and machine learning (ML) within embedded software is becoming a key differentiator, enabling enhanced predictive maintenance, optimized energy management, and adaptive vehicle performance. The cybersecurity of E/E architectures is also a growing concern, driving investments in robust security protocols and secure software development practices. The "Software-Defined Vehicle" concept is gaining traction, where functionality is increasingly defined and updated through software, thereby extending vehicle lifecycles and creating new revenue streams. The market penetration rate for advanced E/E architectures is rapidly increasing, with a projected Compound Annual Growth Rate (CAGR) of approximately xx% over the forecast period. Opportunities abound for suppliers of high-performance computing platforms, advanced sensor fusion algorithms, secure communication modules, and flexible middleware solutions. The growth of the electric vehicle (EV) segment, in particular, is a significant catalyst, as EVs inherently require more sophisticated E/E systems to manage battery performance, charging, and powertrain control. The increasing adoption of over-the-air (OTA) updates also fuels the demand for adaptable E/E architectures capable of seamless software deployment and management. The "Internet of Things" (IoT) paradigm is extending into vehicles, creating a complex ecosystem of connected devices and services that rely on the underlying E/E architecture for seamless integration and data exchange. The aerospace sector is witnessing a similar trend towards more integrated and software-defined systems, driven by the need for enhanced safety, efficiency, and operational capabilities. Off-highway vehicles, from agricultural machinery to construction equipment, are also benefiting from advancements in E/E architectures, enabling greater automation, precision, and connectivity in demanding environments. The overarching trend is towards highly integrated, intelligent, and adaptable E/E architectures that are capable of supporting the next generation of mobility and beyond.
Dominant Markets & Segments in Electrical Electronic E E Architectures
The global Electrical Electronic (E/E) Architectures market is significantly dominated by the Automotive application segment, which is expected to account for over xx% of the market share by 2033. Within the Automotive segment, the Automotive E/E Architecture type is the largest and fastest-growing category, encompassing the fundamental design and integration of electronic components and systems within vehicles. This dominance is propelled by several key growth drivers:
- Explosion of Advanced Driver-Assistance Systems (ADAS) and Autonomous Driving: The increasing regulatory push and consumer demand for safety features, coupled with the development of Level 3 and above autonomous driving capabilities, necessitate highly sophisticated and scalable E/E architectures capable of processing vast amounts of sensor data in real-time.
- Vehicle Electrification (EVs): The widespread adoption of electric vehicles requires advanced E/E systems for battery management, powertrain control, charging infrastructure integration, and thermal management, leading to a surge in demand for specialized E/E architectures.
- Connectivity and Infotainment: The "connected car" revolution, driven by consumer desire for seamless integration of mobile devices, advanced navigation, entertainment systems, and over-the-air (OTA) updates, is a major contributor to the complexity and growth of automotive E/E architectures.
- Software-Defined Vehicles: The paradigm shift towards software-defined vehicles, where functionalities are increasingly determined by software rather than hardware, requires flexible, modular, and upgradable E/E architectures.
The Asia-Pacific region, particularly China, is emerging as the leading geographical market for Electrical Electronic E/E Architectures. This growth is attributed to:
- Massive Automotive Production Hubs: Asia-Pacific is home to major automotive manufacturing centers, driving substantial demand for E/E components and architectures.
- Rapid EV Adoption: Countries like China are leading the global charge in electric vehicle adoption, creating a substantial market for advanced E/E systems.
- Government Initiatives and Policies: Favorable government policies supporting technological innovation, smart mobility, and EV manufacturing further accelerate market growth in the region.
- Growing R&D Investments: Increased investments in research and development by local and international companies in the region are fostering innovation and market expansion.
While Automotive dominates, the Aerospace and Off-Highway segments also present significant opportunities. Aerospace E/E architectures are driven by the need for enhanced safety, fuel efficiency, and advanced navigation and communication systems. Off-highway applications, including agriculture, construction, and mining, are witnessing increased automation and connectivity demands, leading to the adoption of more sophisticated E/E systems for precision control and operational efficiency. The Embedded Software type is also a critical and rapidly growing segment, underpinning the functionality and intelligence of E/E architectures across all application domains.
Electrical Electronic E E Architectures Product Analysis
Product innovation in Electrical Electronic (E/E) Architectures is characterized by a move towards centralized computing, zonal architectures, and enhanced software capabilities. Key advancements include the development of high-performance central computing units capable of managing multiple vehicle functions, alongside intelligent zonal gateways that distribute processing power and simplify wiring harnesses. Innovations in embedded software are enabling advanced features like AI-driven predictive maintenance, sophisticated sensor fusion algorithms for autonomous driving, and robust cybersecurity solutions to protect against evolving threats. Competitive advantages are being gained by companies that can offer integrated hardware and software solutions, demonstrating expertise in functional safety, over-the-air (OTA) updates, and seamless integration with cloud-based services, thereby future-proofing vehicle systems and extending their lifecycle.
Key Drivers, Barriers & Challenges in Electrical Electronic E E Architectures
Key Drivers: The Electrical Electronic (E/E) Architectures market is propelled by several significant drivers. Technologically, the relentless advancement of autonomous driving, vehicle electrification, and connectivity features are paramount. Economic factors, including increasing disposable income and the perceived value of advanced vehicle technologies, fuel consumer demand. Policy-driven factors, such as government mandates for safety (e.g., ADAS requirements) and emissions reduction (driving EV adoption), are also critical accelerators. For instance, the global push for carbon neutrality directly supports the demand for EVs and their complex E/E systems.
Barriers & Challenges: The market also faces considerable challenges. Supply chain disruptions, particularly for critical semiconductor components, can significantly impact production volumes and timelines, as evidenced by industry-wide shortages in recent years with an estimated impact of over xx billion USD globally. Regulatory hurdles, including evolving safety standards and data privacy regulations (e.g., GDPR), add complexity to development and deployment. Competitive pressures are intense, with established players and new entrants vying for market share, often leading to pricing pressures. Furthermore, the sheer complexity of integrating and validating these advanced E/E architectures presents significant engineering challenges. The cost of developing and implementing these advanced systems remains a barrier for some segments.
Growth Drivers in the Electrical Electronic E E Architectures Market
Key growth drivers in the Electrical Electronic (E/E) Architectures market are multifaceted. Technologically, the escalating demand for advanced driver-assistance systems (ADAS), the transition to autonomous driving, and the pervasive integration of connectivity features are fundamentally reshaping vehicle electronics. Economically, the growing global middle class and increasing consumer willingness to pay for enhanced safety, convenience, and in-car experiences are significant catalysts. Regulatory tailwinds, such as stringent safety standards and government incentives for electric vehicle adoption, are also playing a crucial role in accelerating market growth. For example, mandates for mandatory AEB (Automatic Emergency Braking) systems in key markets directly boost the need for advanced E/E architectures.
Challenges Impacting Electrical Electronic E E Architectures Growth
Several challenges are impacting the growth of the Electrical Electronic (E/E) Architectures market. Regulatory complexities surrounding evolving safety standards, cybersecurity protocols, and data privacy concerns create development and compliance hurdles. Supply chain issues, particularly the persistent shortage of advanced semiconductors and other critical electronic components, continue to constrain production volumes and impact lead times, with estimated global revenue losses in the hundreds of billions of dollars in recent years. Intense competitive pressures from a mix of established automotive suppliers and emerging technology companies drive innovation but also put pressure on profit margins. The inherent complexity and cost associated with developing, integrating, and validating these sophisticated E/E systems also pose significant barriers for widespread adoption in certain market segments.
Key Players Shaping the Electrical Electronic E E Architectures Market
- NTC-Systems
- Siemens
- ISID SOUTH EAST ASIA (THAILAND) CO., LTD.
- Bosch GmbH
- Continental AG
- Aptiv PLC
- ZF Friedrichshafen AG
- Denso Corporation
- Veoneer Inc.
- Magna International Inc.
- Lear Corporation
- Hyundai Mobis Co., Ltd.
- Harman International
Significant Electrical Electronic E E Architectures Industry Milestones
- 2019: Introduction of Level 3 autonomous driving capabilities in select production vehicles, requiring more advanced E/E architectures.
- 2020: Increased investment and development in zonal E/E architectures to address wiring complexity and scalability.
- 2021: Heightened awareness and focus on automotive cybersecurity with significant industry-wide discussions and early standardization efforts.
- 2022: Major OEMs announcing significant investments and strategic partnerships focused on software-defined vehicle development and advanced E/E architectures.
- 2023: Accelerated adoption of domain controllers and central compute platforms to manage increasing processing demands.
- 2024: Emergence of early-stage E/E architectures designed for Level 4 and Level 5 autonomy, focusing on redundancy and fail-safe systems.
Future Outlook for Electrical Electronic E E Architectures Market
The future outlook for the Electrical Electronic (E/E) Architectures market is exceptionally strong, driven by the unstoppable momentum of vehicle electrification, autonomous driving, and hyper-connectivity. The market is poised for sustained growth, with strategic opportunities arising from the continued evolution towards software-defined vehicles, which will necessitate more flexible, scalable, and upgradable architectures. Advancements in artificial intelligence and edge computing will unlock new levels of in-car intelligence and personalized experiences. Companies that can effectively navigate the complexities of cybersecurity, over-the-air (OTA) updates, and seamless integration across diverse vehicle platforms will be best positioned for success in this rapidly transforming landscape, with a projected market potential in the trillions of dollars over the coming decade.
Electrical Electronic E E Architectures Segmentation
-
1. Application
- 1.1. Automotive
- 1.2. Aerospace
- 1.3. Off-Highway
- 1.4. Other
-
2. Type
- 2.1. Automotive E/E Architecture
- 2.2. Electrical System
- 2.3. Embedded Software
Electrical Electronic E E Architectures Segmentation By Geography
-
1. North America
- 1.1. United States
- 1.2. Canada
- 1.3. Mexico
-
2. South America
- 2.1. Brazil
- 2.2. Argentina
- 2.3. Rest of South America
-
3. Europe
- 3.1. United Kingdom
- 3.2. Germany
- 3.3. France
- 3.4. Italy
- 3.5. Spain
- 3.6. Russia
- 3.7. Benelux
- 3.8. Nordics
- 3.9. Rest of Europe
-
4. Middle East & Africa
- 4.1. Turkey
- 4.2. Israel
- 4.3. GCC
- 4.4. North Africa
- 4.5. South Africa
- 4.6. Rest of Middle East & Africa
-
5. Asia Pacific
- 5.1. China
- 5.2. India
- 5.3. Japan
- 5.4. South Korea
- 5.5. ASEAN
- 5.6. Oceania
- 5.7. Rest of Asia Pacific
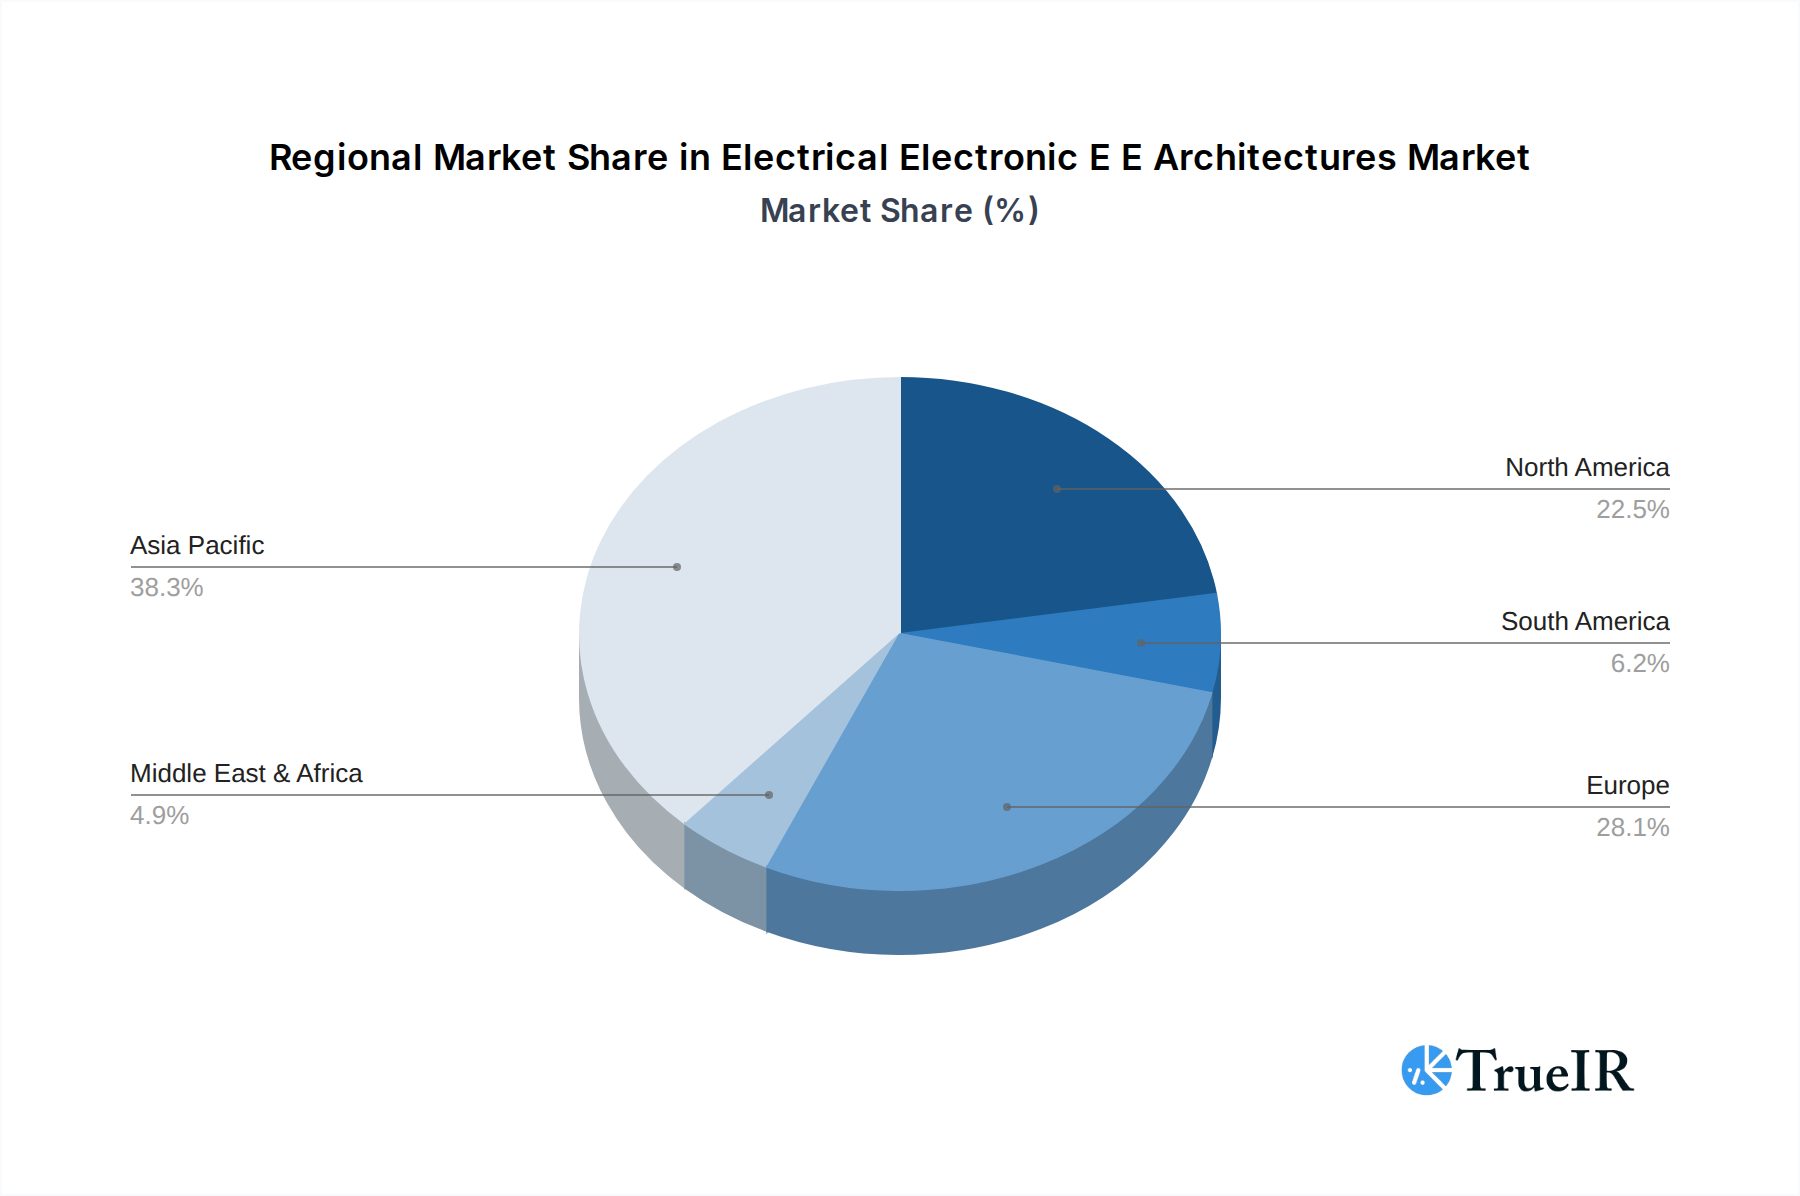
Electrical Electronic E E Architectures Regional Market Share
Geographic Coverage of Electrical Electronic E E Architectures
Electrical Electronic E E Architectures REPORT HIGHLIGHTS
| Aspects | Details |
|---|---|
| Study Period | 2020-2034 |
| Base Year | 2025 |
| Estimated Year | 2026 |
| Forecast Period | 2026-2034 |
| Historical Period | 2020-2025 |
| Growth Rate | CAGR of 9.3% from 2020-2034 |
| Segmentation |
|
Table of Contents
- 1. Introduction
- 1.1. Research Scope
- 1.2. Market Segmentation
- 1.3. Research Methodology
- 1.4. Definitions and Assumptions
- 2. Executive Summary
- 2.1. Introduction
- 3. Market Dynamics
- 3.1. Introduction
- 3.2. Market Drivers
- 3.3. Market Restrains
- 3.4. Market Trends
- 4. Market Factor Analysis
- 4.1. Porters Five Forces
- 4.2. Supply/Value Chain
- 4.3. PESTEL analysis
- 4.4. Market Entropy
- 4.5. Patent/Trademark Analysis
- 5. Global Electrical Electronic E E Architectures Analysis, Insights and Forecast, 2020-2032
- 5.1. Market Analysis, Insights and Forecast - by Application
- 5.1.1. Automotive
- 5.1.2. Aerospace
- 5.1.3. Off-Highway
- 5.1.4. Other
- 5.2. Market Analysis, Insights and Forecast - by Type
- 5.2.1. Automotive E/E Architecture
- 5.2.2. Electrical System
- 5.2.3. Embedded Software
- 5.3. Market Analysis, Insights and Forecast - by Region
- 5.3.1. North America
- 5.3.2. South America
- 5.3.3. Europe
- 5.3.4. Middle East & Africa
- 5.3.5. Asia Pacific
- 5.1. Market Analysis, Insights and Forecast - by Application
- 6. North America Electrical Electronic E E Architectures Analysis, Insights and Forecast, 2020-2032
- 6.1. Market Analysis, Insights and Forecast - by Application
- 6.1.1. Automotive
- 6.1.2. Aerospace
- 6.1.3. Off-Highway
- 6.1.4. Other
- 6.2. Market Analysis, Insights and Forecast - by Type
- 6.2.1. Automotive E/E Architecture
- 6.2.2. Electrical System
- 6.2.3. Embedded Software
- 6.1. Market Analysis, Insights and Forecast - by Application
- 7. South America Electrical Electronic E E Architectures Analysis, Insights and Forecast, 2020-2032
- 7.1. Market Analysis, Insights and Forecast - by Application
- 7.1.1. Automotive
- 7.1.2. Aerospace
- 7.1.3. Off-Highway
- 7.1.4. Other
- 7.2. Market Analysis, Insights and Forecast - by Type
- 7.2.1. Automotive E/E Architecture
- 7.2.2. Electrical System
- 7.2.3. Embedded Software
- 7.1. Market Analysis, Insights and Forecast - by Application
- 8. Europe Electrical Electronic E E Architectures Analysis, Insights and Forecast, 2020-2032
- 8.1. Market Analysis, Insights and Forecast - by Application
- 8.1.1. Automotive
- 8.1.2. Aerospace
- 8.1.3. Off-Highway
- 8.1.4. Other
- 8.2. Market Analysis, Insights and Forecast - by Type
- 8.2.1. Automotive E/E Architecture
- 8.2.2. Electrical System
- 8.2.3. Embedded Software
- 8.1. Market Analysis, Insights and Forecast - by Application
- 9. Middle East & Africa Electrical Electronic E E Architectures Analysis, Insights and Forecast, 2020-2032
- 9.1. Market Analysis, Insights and Forecast - by Application
- 9.1.1. Automotive
- 9.1.2. Aerospace
- 9.1.3. Off-Highway
- 9.1.4. Other
- 9.2. Market Analysis, Insights and Forecast - by Type
- 9.2.1. Automotive E/E Architecture
- 9.2.2. Electrical System
- 9.2.3. Embedded Software
- 9.1. Market Analysis, Insights and Forecast - by Application
- 10. Asia Pacific Electrical Electronic E E Architectures Analysis, Insights and Forecast, 2020-2032
- 10.1. Market Analysis, Insights and Forecast - by Application
- 10.1.1. Automotive
- 10.1.2. Aerospace
- 10.1.3. Off-Highway
- 10.1.4. Other
- 10.2. Market Analysis, Insights and Forecast - by Type
- 10.2.1. Automotive E/E Architecture
- 10.2.2. Electrical System
- 10.2.3. Embedded Software
- 10.1. Market Analysis, Insights and Forecast - by Application
- 11. Competitive Analysis
- 11.1. Global Market Share Analysis 2025
- 11.2. Company Profiles
- 11.2.1 NTC-Systems
- 11.2.1.1. Overview
- 11.2.1.2. Products
- 11.2.1.3. SWOT Analysis
- 11.2.1.4. Recent Developments
- 11.2.1.5. Financials (Based on Availability)
- 11.2.2 Siemens
- 11.2.2.1. Overview
- 11.2.2.2. Products
- 11.2.2.3. SWOT Analysis
- 11.2.2.4. Recent Developments
- 11.2.2.5. Financials (Based on Availability)
- 11.2.3 ISID SOUTH EAST ASIA (THAILAND) CO. LTD.
- 11.2.3.1. Overview
- 11.2.3.2. Products
- 11.2.3.3. SWOT Analysis
- 11.2.3.4. Recent Developments
- 11.2.3.5. Financials (Based on Availability)
- 11.2.4 Bosch GmbH
- 11.2.4.1. Overview
- 11.2.4.2. Products
- 11.2.4.3. SWOT Analysis
- 11.2.4.4. Recent Developments
- 11.2.4.5. Financials (Based on Availability)
- 11.2.5 Continental AG
- 11.2.5.1. Overview
- 11.2.5.2. Products
- 11.2.5.3. SWOT Analysis
- 11.2.5.4. Recent Developments
- 11.2.5.5. Financials (Based on Availability)
- 11.2.6 Aptiv PLC
- 11.2.6.1. Overview
- 11.2.6.2. Products
- 11.2.6.3. SWOT Analysis
- 11.2.6.4. Recent Developments
- 11.2.6.5. Financials (Based on Availability)
- 11.2.7 ZF Friedrichshafen AG
- 11.2.7.1. Overview
- 11.2.7.2. Products
- 11.2.7.3. SWOT Analysis
- 11.2.7.4. Recent Developments
- 11.2.7.5. Financials (Based on Availability)
- 11.2.8 Denso Corporation
- 11.2.8.1. Overview
- 11.2.8.2. Products
- 11.2.8.3. SWOT Analysis
- 11.2.8.4. Recent Developments
- 11.2.8.5. Financials (Based on Availability)
- 11.2.9 Veoneer Inc.
- 11.2.9.1. Overview
- 11.2.9.2. Products
- 11.2.9.3. SWOT Analysis
- 11.2.9.4. Recent Developments
- 11.2.9.5. Financials (Based on Availability)
- 11.2.10 Magna International Inc.
- 11.2.10.1. Overview
- 11.2.10.2. Products
- 11.2.10.3. SWOT Analysis
- 11.2.10.4. Recent Developments
- 11.2.10.5. Financials (Based on Availability)
- 11.2.11 Lear Corporation
- 11.2.11.1. Overview
- 11.2.11.2. Products
- 11.2.11.3. SWOT Analysis
- 11.2.11.4. Recent Developments
- 11.2.11.5. Financials (Based on Availability)
- 11.2.12 Hyundai Mobis Co. Ltd.
- 11.2.12.1. Overview
- 11.2.12.2. Products
- 11.2.12.3. SWOT Analysis
- 11.2.12.4. Recent Developments
- 11.2.12.5. Financials (Based on Availability)
- 11.2.13 Harman International
- 11.2.13.1. Overview
- 11.2.13.2. Products
- 11.2.13.3. SWOT Analysis
- 11.2.13.4. Recent Developments
- 11.2.13.5. Financials (Based on Availability)
- 11.2.1 NTC-Systems
List of Figures
- Figure 1: Global Electrical Electronic E E Architectures Revenue Breakdown (million, %) by Region 2025 & 2033
- Figure 2: North America Electrical Electronic E E Architectures Revenue (million), by Application 2025 & 2033
- Figure 3: North America Electrical Electronic E E Architectures Revenue Share (%), by Application 2025 & 2033
- Figure 4: North America Electrical Electronic E E Architectures Revenue (million), by Type 2025 & 2033
- Figure 5: North America Electrical Electronic E E Architectures Revenue Share (%), by Type 2025 & 2033
- Figure 6: North America Electrical Electronic E E Architectures Revenue (million), by Country 2025 & 2033
- Figure 7: North America Electrical Electronic E E Architectures Revenue Share (%), by Country 2025 & 2033
- Figure 8: South America Electrical Electronic E E Architectures Revenue (million), by Application 2025 & 2033
- Figure 9: South America Electrical Electronic E E Architectures Revenue Share (%), by Application 2025 & 2033
- Figure 10: South America Electrical Electronic E E Architectures Revenue (million), by Type 2025 & 2033
- Figure 11: South America Electrical Electronic E E Architectures Revenue Share (%), by Type 2025 & 2033
- Figure 12: South America Electrical Electronic E E Architectures Revenue (million), by Country 2025 & 2033
- Figure 13: South America Electrical Electronic E E Architectures Revenue Share (%), by Country 2025 & 2033
- Figure 14: Europe Electrical Electronic E E Architectures Revenue (million), by Application 2025 & 2033
- Figure 15: Europe Electrical Electronic E E Architectures Revenue Share (%), by Application 2025 & 2033
- Figure 16: Europe Electrical Electronic E E Architectures Revenue (million), by Type 2025 & 2033
- Figure 17: Europe Electrical Electronic E E Architectures Revenue Share (%), by Type 2025 & 2033
- Figure 18: Europe Electrical Electronic E E Architectures Revenue (million), by Country 2025 & 2033
- Figure 19: Europe Electrical Electronic E E Architectures Revenue Share (%), by Country 2025 & 2033
- Figure 20: Middle East & Africa Electrical Electronic E E Architectures Revenue (million), by Application 2025 & 2033
- Figure 21: Middle East & Africa Electrical Electronic E E Architectures Revenue Share (%), by Application 2025 & 2033
- Figure 22: Middle East & Africa Electrical Electronic E E Architectures Revenue (million), by Type 2025 & 2033
- Figure 23: Middle East & Africa Electrical Electronic E E Architectures Revenue Share (%), by Type 2025 & 2033
- Figure 24: Middle East & Africa Electrical Electronic E E Architectures Revenue (million), by Country 2025 & 2033
- Figure 25: Middle East & Africa Electrical Electronic E E Architectures Revenue Share (%), by Country 2025 & 2033
- Figure 26: Asia Pacific Electrical Electronic E E Architectures Revenue (million), by Application 2025 & 2033
- Figure 27: Asia Pacific Electrical Electronic E E Architectures Revenue Share (%), by Application 2025 & 2033
- Figure 28: Asia Pacific Electrical Electronic E E Architectures Revenue (million), by Type 2025 & 2033
- Figure 29: Asia Pacific Electrical Electronic E E Architectures Revenue Share (%), by Type 2025 & 2033
- Figure 30: Asia Pacific Electrical Electronic E E Architectures Revenue (million), by Country 2025 & 2033
- Figure 31: Asia Pacific Electrical Electronic E E Architectures Revenue Share (%), by Country 2025 & 2033
List of Tables
- Table 1: Global Electrical Electronic E E Architectures Revenue million Forecast, by Application 2020 & 2033
- Table 2: Global Electrical Electronic E E Architectures Revenue million Forecast, by Type 2020 & 2033
- Table 3: Global Electrical Electronic E E Architectures Revenue million Forecast, by Region 2020 & 2033
- Table 4: Global Electrical Electronic E E Architectures Revenue million Forecast, by Application 2020 & 2033
- Table 5: Global Electrical Electronic E E Architectures Revenue million Forecast, by Type 2020 & 2033
- Table 6: Global Electrical Electronic E E Architectures Revenue million Forecast, by Country 2020 & 2033
- Table 7: United States Electrical Electronic E E Architectures Revenue (million) Forecast, by Application 2020 & 2033
- Table 8: Canada Electrical Electronic E E Architectures Revenue (million) Forecast, by Application 2020 & 2033
- Table 9: Mexico Electrical Electronic E E Architectures Revenue (million) Forecast, by Application 2020 & 2033
- Table 10: Global Electrical Electronic E E Architectures Revenue million Forecast, by Application 2020 & 2033
- Table 11: Global Electrical Electronic E E Architectures Revenue million Forecast, by Type 2020 & 2033
- Table 12: Global Electrical Electronic E E Architectures Revenue million Forecast, by Country 2020 & 2033
- Table 13: Brazil Electrical Electronic E E Architectures Revenue (million) Forecast, by Application 2020 & 2033
- Table 14: Argentina Electrical Electronic E E Architectures Revenue (million) Forecast, by Application 2020 & 2033
- Table 15: Rest of South America Electrical Electronic E E Architectures Revenue (million) Forecast, by Application 2020 & 2033
- Table 16: Global Electrical Electronic E E Architectures Revenue million Forecast, by Application 2020 & 2033
- Table 17: Global Electrical Electronic E E Architectures Revenue million Forecast, by Type 2020 & 2033
- Table 18: Global Electrical Electronic E E Architectures Revenue million Forecast, by Country 2020 & 2033
- Table 19: United Kingdom Electrical Electronic E E Architectures Revenue (million) Forecast, by Application 2020 & 2033
- Table 20: Germany Electrical Electronic E E Architectures Revenue (million) Forecast, by Application 2020 & 2033
- Table 21: France Electrical Electronic E E Architectures Revenue (million) Forecast, by Application 2020 & 2033
- Table 22: Italy Electrical Electronic E E Architectures Revenue (million) Forecast, by Application 2020 & 2033
- Table 23: Spain Electrical Electronic E E Architectures Revenue (million) Forecast, by Application 2020 & 2033
- Table 24: Russia Electrical Electronic E E Architectures Revenue (million) Forecast, by Application 2020 & 2033
- Table 25: Benelux Electrical Electronic E E Architectures Revenue (million) Forecast, by Application 2020 & 2033
- Table 26: Nordics Electrical Electronic E E Architectures Revenue (million) Forecast, by Application 2020 & 2033
- Table 27: Rest of Europe Electrical Electronic E E Architectures Revenue (million) Forecast, by Application 2020 & 2033
- Table 28: Global Electrical Electronic E E Architectures Revenue million Forecast, by Application 2020 & 2033
- Table 29: Global Electrical Electronic E E Architectures Revenue million Forecast, by Type 2020 & 2033
- Table 30: Global Electrical Electronic E E Architectures Revenue million Forecast, by Country 2020 & 2033
- Table 31: Turkey Electrical Electronic E E Architectures Revenue (million) Forecast, by Application 2020 & 2033
- Table 32: Israel Electrical Electronic E E Architectures Revenue (million) Forecast, by Application 2020 & 2033
- Table 33: GCC Electrical Electronic E E Architectures Revenue (million) Forecast, by Application 2020 & 2033
- Table 34: North Africa Electrical Electronic E E Architectures Revenue (million) Forecast, by Application 2020 & 2033
- Table 35: South Africa Electrical Electronic E E Architectures Revenue (million) Forecast, by Application 2020 & 2033
- Table 36: Rest of Middle East & Africa Electrical Electronic E E Architectures Revenue (million) Forecast, by Application 2020 & 2033
- Table 37: Global Electrical Electronic E E Architectures Revenue million Forecast, by Application 2020 & 2033
- Table 38: Global Electrical Electronic E E Architectures Revenue million Forecast, by Type 2020 & 2033
- Table 39: Global Electrical Electronic E E Architectures Revenue million Forecast, by Country 2020 & 2033
- Table 40: China Electrical Electronic E E Architectures Revenue (million) Forecast, by Application 2020 & 2033
- Table 41: India Electrical Electronic E E Architectures Revenue (million) Forecast, by Application 2020 & 2033
- Table 42: Japan Electrical Electronic E E Architectures Revenue (million) Forecast, by Application 2020 & 2033
- Table 43: South Korea Electrical Electronic E E Architectures Revenue (million) Forecast, by Application 2020 & 2033
- Table 44: ASEAN Electrical Electronic E E Architectures Revenue (million) Forecast, by Application 2020 & 2033
- Table 45: Oceania Electrical Electronic E E Architectures Revenue (million) Forecast, by Application 2020 & 2033
- Table 46: Rest of Asia Pacific Electrical Electronic E E Architectures Revenue (million) Forecast, by Application 2020 & 2033
Frequently Asked Questions
1. What is the projected Compound Annual Growth Rate (CAGR) of the Electrical Electronic E E Architectures?
The projected CAGR is approximately 9.3%.
2. Which companies are prominent players in the Electrical Electronic E E Architectures?
Key companies in the market include NTC-Systems, Siemens, ISID SOUTH EAST ASIA (THAILAND) CO., LTD., Bosch GmbH, Continental AG, Aptiv PLC, ZF Friedrichshafen AG, Denso Corporation, Veoneer Inc., Magna International Inc., Lear Corporation, Hyundai Mobis Co., Ltd., Harman International.
3. What are the main segments of the Electrical Electronic E E Architectures?
The market segments include Application, Type.
4. Can you provide details about the market size?
The market size is estimated to be USD 107330 million as of 2022.
5. What are some drivers contributing to market growth?
N/A
6. What are the notable trends driving market growth?
N/A
7. Are there any restraints impacting market growth?
N/A
8. Can you provide examples of recent developments in the market?
N/A
9. What pricing options are available for accessing the report?
Pricing options include single-user, multi-user, and enterprise licenses priced at USD 2900.00, USD 4350.00, and USD 5800.00 respectively.
10. Is the market size provided in terms of value or volume?
The market size is provided in terms of value, measured in million.
11. Are there any specific market keywords associated with the report?
Yes, the market keyword associated with the report is "Electrical Electronic E E Architectures," which aids in identifying and referencing the specific market segment covered.
12. How do I determine which pricing option suits my needs best?
The pricing options vary based on user requirements and access needs. Individual users may opt for single-user licenses, while businesses requiring broader access may choose multi-user or enterprise licenses for cost-effective access to the report.
13. Are there any additional resources or data provided in the Electrical Electronic E E Architectures report?
While the report offers comprehensive insights, it's advisable to review the specific contents or supplementary materials provided to ascertain if additional resources or data are available.
14. How can I stay updated on further developments or reports in the Electrical Electronic E E Architectures?
To stay informed about further developments, trends, and reports in the Electrical Electronic E E Architectures, consider subscribing to industry newsletters, following relevant companies and organizations, or regularly checking reputable industry news sources and publications.
Methodology
Step 1 - Identification of Relevant Samples Size from Population Database


Step 2 - Approaches for Defining Global Market Size (Value, Volume* & Price*)

Note*: In applicable scenarios
Step 3 - Data Sources
Primary Research
- Web Analytics
- Survey Reports
- Research Institute
- Latest Research Reports
- Opinion Leaders
Secondary Research
- Annual Reports
- White Paper
- Latest Press Release
- Industry Association
- Paid Database
- Investor Presentations

Step 4 - Data Triangulation
Involves using different sources of information in order to increase the validity of a study
These sources are likely to be stakeholders in a program - participants, other researchers, program staff, other community members, and so on.
Then we put all data in single framework & apply various statistical tools to find out the dynamic on the market.
During the analysis stage, feedback from the stakeholder groups would be compared to determine areas of agreement as well as areas of divergence