

Key Insights
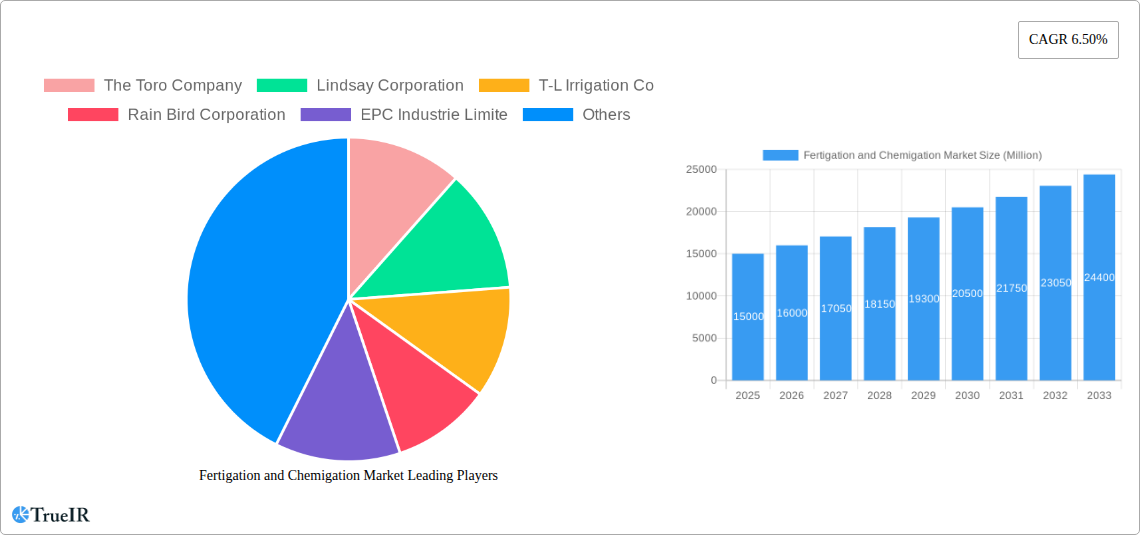
The global fertigation and chemigation market is experiencing robust growth, driven by the increasing demand for efficient and precise irrigation and fertilizer application methods in agriculture. The market, valued at approximately $XX million in 2025, is projected to expand at a compound annual growth rate (CAGR) of 6.50% from 2025 to 2033. This growth is fueled by several key factors. Firstly, the rising global population necessitates increased food production, pushing farmers to adopt advanced irrigation techniques like fertigation and chemigation to optimize resource utilization and maximize crop yields. Secondly, the escalating costs of labor and water resources are further incentivizing the adoption of these technologies, which offer significant cost savings through reduced water consumption and labor requirements. Furthermore, government initiatives promoting sustainable agriculture and precision farming practices are also bolstering market growth. The segment breakdown reveals strong demand across various crop types, including grains and cereals, fruits and vegetables, and turf and ornamentals, with agriculture irrigation accounting for a substantial share of application segments. Drip irrigation systems are gaining popularity due to their water-saving capabilities and precision in nutrient delivery, thereby driving segment growth. Major players like The Toro Company, Lindsay Corporation, and Netafim are actively involved in product innovation and strategic expansions to strengthen their market positions.
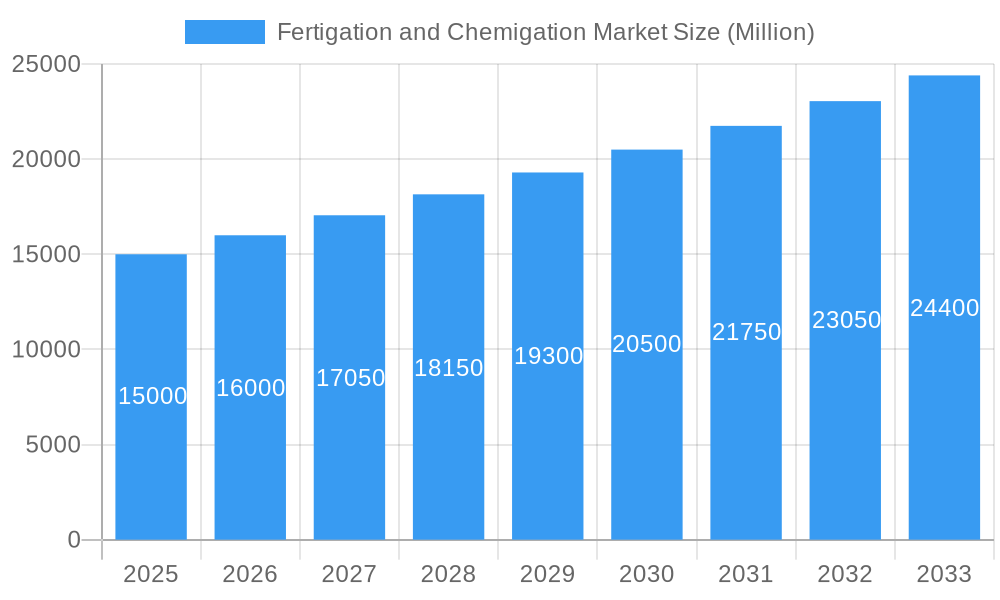
Fertigation and Chemigation Market Market Size (In Billion)
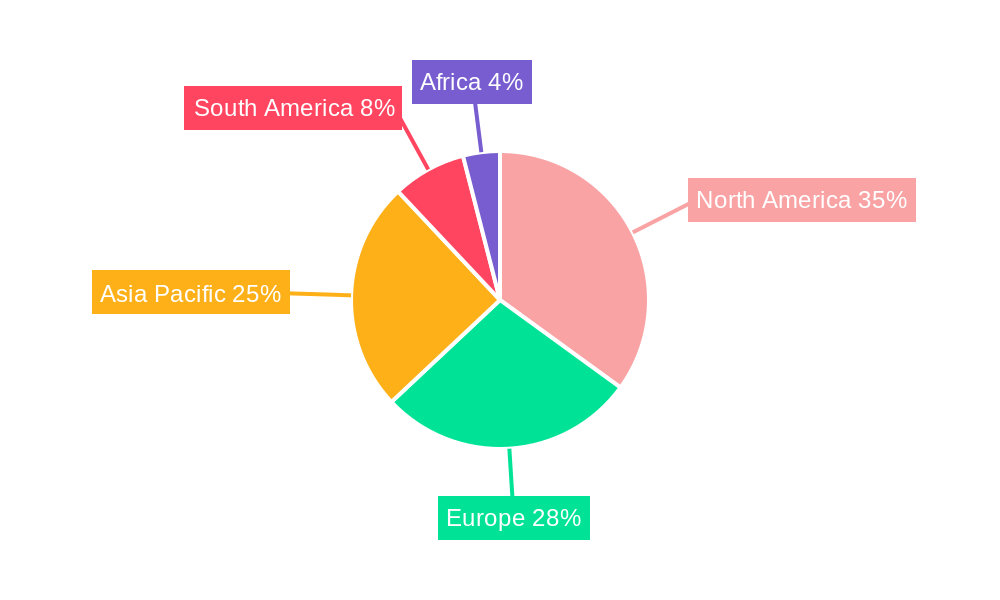
The regional landscape shows a diversified market, with North America and Europe currently holding significant market shares. However, the Asia-Pacific region, particularly India and China, is anticipated to witness substantial growth in the coming years due to the expanding agricultural sector and rising adoption rates of modern farming techniques. While challenges such as high initial investment costs and the need for skilled labor can restrain market growth, the long-term benefits of improved crop quality, yield enhancement, and resource efficiency are expected to outweigh these limitations. Future market trends will likely focus on the integration of advanced technologies like IoT sensors, data analytics, and automation to create smart fertigation and chemigation systems that enhance precision and efficiency. The market will also see increased focus on developing environmentally friendly solutions that minimize chemical usage and promote sustainable agriculture.
Fertigation and Chemigation Market Company Market Share
Fertigation and Chemigation Market Report: 2019-2033
This comprehensive report provides a detailed analysis of the global Fertigation and Chemigation market, offering invaluable insights for stakeholders across the agricultural, landscaping, and greenhouse industries. The study period covers 2019-2033, with 2025 serving as the base and estimated year, and the forecast period spanning 2025-2033. The historical period analyzed is 2019-2024. This report leverages extensive market research to provide a granular understanding of market dynamics, competitive landscapes, and future growth trajectories.
Fertigation and Chemigation Market Market Structure & Competitive Landscape
The Fertigation and Chemigation market is characterized by a moderately concentrated structure, with key players such as The Toro Company, Lindsay Corporation, T-L Irrigation Co, Rain Bird Corporation, EPC Industrie Limite, Nelson Irrigation Corporation, Netafim, Valmont Industries Inc, Rivulis Irrigation, and Jain Irrigation Systems Limited holding significant market share. The market concentration ratio (CR4) is estimated at xx% in 2025. Innovation is a key driver, with companies investing heavily in developing efficient and precise fertigation and chemigation systems. Regulatory frameworks concerning pesticide and fertilizer usage significantly impact market dynamics, necessitating compliance and influencing product development. Product substitution is limited due to the specialized nature of these systems, but competition exists among different irrigation types and input types. M&A activity in the market is moderate, with approximately xx deals recorded between 2019 and 2024, primarily focused on expanding geographical reach and technological capabilities. End-user segmentation is diverse, spanning across agriculture (various crops), landscaping, and greenhouse applications.
- Market Concentration: CR4 estimated at xx% in 2025.
- Innovation Drivers: Development of precise application technologies, automation, and sensor integration.
- Regulatory Impacts: Stringent regulations on pesticide and fertilizer usage influencing product design and market access.
- Product Substitutes: Limited, with competition mainly across irrigation types.
- End-User Segmentation: Agriculture, landscaping, and greenhouse applications.
- M&A Trends: Approximately xx deals between 2019 and 2024, focused on expansion and technological integration.
Fertigation and Chemigation Market Market Trends & Opportunities
The global Fertigation and Chemigation market is experiencing robust growth, driven by increasing adoption of efficient irrigation techniques, rising demand for high-yield crops, and growing concerns regarding water conservation. The market size is projected to reach xx Million by 2025, exhibiting a CAGR of xx% during the forecast period (2025-2033). Technological advancements, including smart sensors, data analytics, and automation, are transforming the industry, leading to increased precision and efficiency in nutrient and chemical application. Consumer preferences are shifting towards sustainable and environmentally friendly practices, driving demand for eco-friendly fertigation and chemigation solutions. Competitive dynamics are characterized by ongoing innovation, strategic partnerships, and expansion into new geographic markets. Market penetration rates are highest in developed regions but are experiencing rapid growth in emerging economies.
Dominant Markets & Segments in Fertigation and Chemigation Market
The agriculture irrigation application segment currently dominates the market, accounting for xx% of the total revenue in 2025. Within agriculture, the fruits and vegetables crop type is a key driver due to its high value and the need for precise nutrient management. The drip irrigation method holds a substantial share (xx%) due to its water efficiency and suitability for various crops. Geographically, North America and Europe are currently the leading regions, while significant growth potential is observed in Asia-Pacific, particularly in countries like India and China.
- Key Growth Drivers:
- Increasing adoption of precision agriculture techniques.
- Growing demand for high-yield and high-quality crops.
- Focus on water conservation and sustainable agriculture practices.
- Government initiatives and subsidies promoting efficient irrigation methods.
- Market Dominance:
- Application: Agriculture irrigation
- Crop Type: Fruits and Vegetables
- Irrigation Type: Drip Irrigation
- Region: North America and Europe (Currently); Asia-Pacific (High Growth Potential)
Fertigation and Chemigation Market Product Analysis
Technological advancements in fertigation and chemigation systems focus on precision application, real-time monitoring, and automation. Integration of sensors, data analytics, and cloud-based platforms enables efficient nutrient and chemical delivery, reducing waste and optimizing crop yield. The development of smart controllers and automated systems enhances ease of use and reduces labor costs, leading to increased market adoption. Competitive advantages stem from superior accuracy, reliability, sustainability features, and cost-effectiveness.
Key Drivers, Barriers & Challenges in Fertigation and Chemigation Market
Key Drivers:
- Increasing demand for high-yield crops and efficient resource utilization.
- Technological advancements leading to more precise and automated systems.
- Growing awareness of water scarcity and the need for water-efficient irrigation.
- Government support and incentives promoting sustainable agriculture.
Challenges:
- High initial investment costs limiting adoption in some regions.
- Regulatory complexities and stringent environmental regulations.
- Supply chain disruptions impacting the availability of components and chemicals.
- Competition from traditional irrigation methods and established players. This has resulted in a xx% reduction in market growth in the past year.
Growth Drivers in the Fertigation and Chemigation Market Market
Technological advancements, including smart sensors, automation, and data analytics, are key drivers. Growing demand for high-yield, high-quality produce coupled with increasing water scarcity further fuels market growth. Government initiatives and subsidies promoting efficient irrigation methods also contribute to market expansion.
Challenges Impacting Fertigation and Chemigation Market Growth
High initial investment costs, particularly for precision technologies, can hinder adoption, especially in developing economies. Regulatory complexities surrounding pesticide and fertilizer use create significant barriers to market entry and expansion. Supply chain disruptions and the increasing cost of raw materials can negatively impact profitability and market growth.
Key Players Shaping the Fertigation and Chemigation Market Market
- The Toro Company
- Lindsay Corporation
- T-L Irrigation Co
- Rain Bird Corporation
- EPC Industrie Limite
- Nelson Irrigation Corporation
- Netafim
- Valmont Industries Inc
- Rivulis Irrigation
- Jain Irrigation Systems Limited
Significant Fertigation and Chemigation Market Industry Milestones
- 2020: Netafim launches a new line of smart sensors for precision fertigation.
- 2021: Lindsay Corporation acquires a smaller competitor, expanding its market reach in South America.
- 2022: The Toro Company introduces an automated fertigation system with AI capabilities.
- 2023: Several companies announce partnerships to develop sustainable fertigation solutions.
- 2024: New regulations are implemented in several countries affecting pesticide application methods.
Future Outlook for Fertigation and Chemigation Market Market
The Fertigation and Chemigation market is poised for significant growth, driven by increasing adoption of precision agriculture techniques, expanding greenhouse operations, and growing focus on water conservation. Strategic partnerships, technological advancements, and expansion into new markets will further fuel market expansion. The development of more sustainable and environmentally friendly solutions will play a crucial role in shaping future market trends. The market is expected to continue its strong growth trajectory, driven by technological innovation and increasing demand for efficient irrigation solutions.
Fertigation and Chemigation Market Segmentation
- 1. Production Analysis
- 2. Consumption Analysis
- 3. Import Market Analysis (Value & Volume)
- 4. Export Market Analysis (Value & Volume)
- 5. Price Trend Analysis
Fertigation and Chemigation Market Segmentation By Geography
-
1. North America
- 1.1. United States
- 1.2. Canada
- 1.3. Mexico
-
2. South America
- 2.1. Brazil
- 2.2. Argentina
- 2.3. Rest of South America
-
3. Europe
- 3.1. United Kingdom
- 3.2. Germany
- 3.3. France
- 3.4. Italy
- 3.5. Spain
- 3.6. Russia
- 3.7. Benelux
- 3.8. Nordics
- 3.9. Rest of Europe
-
4. Middle East & Africa
- 4.1. Turkey
- 4.2. Israel
- 4.3. GCC
- 4.4. North Africa
- 4.5. South Africa
- 4.6. Rest of Middle East & Africa
-
5. Asia Pacific
- 5.1. China
- 5.2. India
- 5.3. Japan
- 5.4. South Korea
- 5.5. ASEAN
- 5.6. Oceania
- 5.7. Rest of Asia Pacific
Fertigation and Chemigation Market Regional Market Share
Geographic Coverage of Fertigation and Chemigation Market
Fertigation and Chemigation Market REPORT HIGHLIGHTS
| Aspects | Details |
|---|---|
| Study Period | 2020-2034 |
| Base Year | 2025 |
| Estimated Year | 2026 |
| Forecast Period | 2026-2034 |
| Historical Period | 2020-2025 |
| Growth Rate | CAGR of 6.5% from 2020-2034 |
| Segmentation |
|
Table of Contents
- 1. Introduction
- 1.1. Research Scope
- 1.2. Market Segmentation
- 1.3. Research Methodology
- 1.4. Definitions and Assumptions
- 2. Executive Summary
- 2.1. Introduction
- 3. Market Dynamics
- 3.1. Introduction
- 3.2. Market Drivers
- 3.2.1. Increasing Legalization of Cannabis; Growing Focus on Health Benefits of Cannabis
- 3.3. Market Restrains
- 3.3.1. Lack of Data on Dosages and Results; Lack of Access to Financial Assistance
- 3.4. Market Trends
- 3.4.1. Increase in Awareness of Drip Irrigation System is Driving the Market
- 4. Market Factor Analysis
- 4.1. Porters Five Forces
- 4.2. Supply/Value Chain
- 4.3. PESTEL analysis
- 4.4. Market Entropy
- 4.5. Patent/Trademark Analysis
- 5. Global Fertigation and Chemigation Market Analysis, Insights and Forecast, 2020-2032
- 5.1. Market Analysis, Insights and Forecast - by Production Analysis
- 5.2. Market Analysis, Insights and Forecast - by Consumption Analysis
- 5.3. Market Analysis, Insights and Forecast - by Import Market Analysis (Value & Volume)
- 5.4. Market Analysis, Insights and Forecast - by Export Market Analysis (Value & Volume)
- 5.5. Market Analysis, Insights and Forecast - by Price Trend Analysis
- 5.6. Market Analysis, Insights and Forecast - by Region
- 5.6.1. North America
- 5.6.2. South America
- 5.6.3. Europe
- 5.6.4. Middle East & Africa
- 5.6.5. Asia Pacific
- 5.1. Market Analysis, Insights and Forecast - by Production Analysis
- 6. North America Fertigation and Chemigation Market Analysis, Insights and Forecast, 2020-2032
- 6.1. Market Analysis, Insights and Forecast - by Production Analysis
- 6.2. Market Analysis, Insights and Forecast - by Consumption Analysis
- 6.3. Market Analysis, Insights and Forecast - by Import Market Analysis (Value & Volume)
- 6.4. Market Analysis, Insights and Forecast - by Export Market Analysis (Value & Volume)
- 6.5. Market Analysis, Insights and Forecast - by Price Trend Analysis
- 6.1. Market Analysis, Insights and Forecast - by Production Analysis
- 7. South America Fertigation and Chemigation Market Analysis, Insights and Forecast, 2020-2032
- 7.1. Market Analysis, Insights and Forecast - by Production Analysis
- 7.2. Market Analysis, Insights and Forecast - by Consumption Analysis
- 7.3. Market Analysis, Insights and Forecast - by Import Market Analysis (Value & Volume)
- 7.4. Market Analysis, Insights and Forecast - by Export Market Analysis (Value & Volume)
- 7.5. Market Analysis, Insights and Forecast - by Price Trend Analysis
- 7.1. Market Analysis, Insights and Forecast - by Production Analysis
- 8. Europe Fertigation and Chemigation Market Analysis, Insights and Forecast, 2020-2032
- 8.1. Market Analysis, Insights and Forecast - by Production Analysis
- 8.2. Market Analysis, Insights and Forecast - by Consumption Analysis
- 8.3. Market Analysis, Insights and Forecast - by Import Market Analysis (Value & Volume)
- 8.4. Market Analysis, Insights and Forecast - by Export Market Analysis (Value & Volume)
- 8.5. Market Analysis, Insights and Forecast - by Price Trend Analysis
- 8.1. Market Analysis, Insights and Forecast - by Production Analysis
- 9. Middle East & Africa Fertigation and Chemigation Market Analysis, Insights and Forecast, 2020-2032
- 9.1. Market Analysis, Insights and Forecast - by Production Analysis
- 9.2. Market Analysis, Insights and Forecast - by Consumption Analysis
- 9.3. Market Analysis, Insights and Forecast - by Import Market Analysis (Value & Volume)
- 9.4. Market Analysis, Insights and Forecast - by Export Market Analysis (Value & Volume)
- 9.5. Market Analysis, Insights and Forecast - by Price Trend Analysis
- 9.1. Market Analysis, Insights and Forecast - by Production Analysis
- 10. Asia Pacific Fertigation and Chemigation Market Analysis, Insights and Forecast, 2020-2032
- 10.1. Market Analysis, Insights and Forecast - by Production Analysis
- 10.2. Market Analysis, Insights and Forecast - by Consumption Analysis
- 10.3. Market Analysis, Insights and Forecast - by Import Market Analysis (Value & Volume)
- 10.4. Market Analysis, Insights and Forecast - by Export Market Analysis (Value & Volume)
- 10.5. Market Analysis, Insights and Forecast - by Price Trend Analysis
- 10.1. Market Analysis, Insights and Forecast - by Production Analysis
- 11. Competitive Analysis
- 11.1. Global Market Share Analysis 2025
- 11.2. Company Profiles
- 11.2.1 The Toro Company
- 11.2.1.1. Overview
- 11.2.1.2. Products
- 11.2.1.3. SWOT Analysis
- 11.2.1.4. Recent Developments
- 11.2.1.5. Financials (Based on Availability)
- 11.2.2 Lindsay Corporation
- 11.2.2.1. Overview
- 11.2.2.2. Products
- 11.2.2.3. SWOT Analysis
- 11.2.2.4. Recent Developments
- 11.2.2.5. Financials (Based on Availability)
- 11.2.3 T-L Irrigation Co
- 11.2.3.1. Overview
- 11.2.3.2. Products
- 11.2.3.3. SWOT Analysis
- 11.2.3.4. Recent Developments
- 11.2.3.5. Financials (Based on Availability)
- 11.2.4 Rain Bird Corporation
- 11.2.4.1. Overview
- 11.2.4.2. Products
- 11.2.4.3. SWOT Analysis
- 11.2.4.4. Recent Developments
- 11.2.4.5. Financials (Based on Availability)
- 11.2.5 EPC Industrie Limite
- 11.2.5.1. Overview
- 11.2.5.2. Products
- 11.2.5.3. SWOT Analysis
- 11.2.5.4. Recent Developments
- 11.2.5.5. Financials (Based on Availability)
- 11.2.6 Nelson Irrigation Corporation
- 11.2.6.1. Overview
- 11.2.6.2. Products
- 11.2.6.3. SWOT Analysis
- 11.2.6.4. Recent Developments
- 11.2.6.5. Financials (Based on Availability)
- 11.2.7 Netafim
- 11.2.7.1. Overview
- 11.2.7.2. Products
- 11.2.7.3. SWOT Analysis
- 11.2.7.4. Recent Developments
- 11.2.7.5. Financials (Based on Availability)
- 11.2.8 Valmont Industries Inc
- 11.2.8.1. Overview
- 11.2.8.2. Products
- 11.2.8.3. SWOT Analysis
- 11.2.8.4. Recent Developments
- 11.2.8.5. Financials (Based on Availability)
- 11.2.9 Rivulis Irrigation
- 11.2.9.1. Overview
- 11.2.9.2. Products
- 11.2.9.3. SWOT Analysis
- 11.2.9.4. Recent Developments
- 11.2.9.5. Financials (Based on Availability)
- 11.2.10 Jain Irrigation Systems Limited
- 11.2.10.1. Overview
- 11.2.10.2. Products
- 11.2.10.3. SWOT Analysis
- 11.2.10.4. Recent Developments
- 11.2.10.5. Financials (Based on Availability)
- 11.2.1 The Toro Company
List of Figures
- Figure 1: Global Fertigation and Chemigation Market Revenue Breakdown (undefined, %) by Region 2025 & 2033
- Figure 2: North America Fertigation and Chemigation Market Revenue (undefined), by Production Analysis 2025 & 2033
- Figure 3: North America Fertigation and Chemigation Market Revenue Share (%), by Production Analysis 2025 & 2033
- Figure 4: North America Fertigation and Chemigation Market Revenue (undefined), by Consumption Analysis 2025 & 2033
- Figure 5: North America Fertigation and Chemigation Market Revenue Share (%), by Consumption Analysis 2025 & 2033
- Figure 6: North America Fertigation and Chemigation Market Revenue (undefined), by Import Market Analysis (Value & Volume) 2025 & 2033
- Figure 7: North America Fertigation and Chemigation Market Revenue Share (%), by Import Market Analysis (Value & Volume) 2025 & 2033
- Figure 8: North America Fertigation and Chemigation Market Revenue (undefined), by Export Market Analysis (Value & Volume) 2025 & 2033
- Figure 9: North America Fertigation and Chemigation Market Revenue Share (%), by Export Market Analysis (Value & Volume) 2025 & 2033
- Figure 10: North America Fertigation and Chemigation Market Revenue (undefined), by Price Trend Analysis 2025 & 2033
- Figure 11: North America Fertigation and Chemigation Market Revenue Share (%), by Price Trend Analysis 2025 & 2033
- Figure 12: North America Fertigation and Chemigation Market Revenue (undefined), by Country 2025 & 2033
- Figure 13: North America Fertigation and Chemigation Market Revenue Share (%), by Country 2025 & 2033
- Figure 14: South America Fertigation and Chemigation Market Revenue (undefined), by Production Analysis 2025 & 2033
- Figure 15: South America Fertigation and Chemigation Market Revenue Share (%), by Production Analysis 2025 & 2033
- Figure 16: South America Fertigation and Chemigation Market Revenue (undefined), by Consumption Analysis 2025 & 2033
- Figure 17: South America Fertigation and Chemigation Market Revenue Share (%), by Consumption Analysis 2025 & 2033
- Figure 18: South America Fertigation and Chemigation Market Revenue (undefined), by Import Market Analysis (Value & Volume) 2025 & 2033
- Figure 19: South America Fertigation and Chemigation Market Revenue Share (%), by Import Market Analysis (Value & Volume) 2025 & 2033
- Figure 20: South America Fertigation and Chemigation Market Revenue (undefined), by Export Market Analysis (Value & Volume) 2025 & 2033
- Figure 21: South America Fertigation and Chemigation Market Revenue Share (%), by Export Market Analysis (Value & Volume) 2025 & 2033
- Figure 22: South America Fertigation and Chemigation Market Revenue (undefined), by Price Trend Analysis 2025 & 2033
- Figure 23: South America Fertigation and Chemigation Market Revenue Share (%), by Price Trend Analysis 2025 & 2033
- Figure 24: South America Fertigation and Chemigation Market Revenue (undefined), by Country 2025 & 2033
- Figure 25: South America Fertigation and Chemigation Market Revenue Share (%), by Country 2025 & 2033
- Figure 26: Europe Fertigation and Chemigation Market Revenue (undefined), by Production Analysis 2025 & 2033
- Figure 27: Europe Fertigation and Chemigation Market Revenue Share (%), by Production Analysis 2025 & 2033
- Figure 28: Europe Fertigation and Chemigation Market Revenue (undefined), by Consumption Analysis 2025 & 2033
- Figure 29: Europe Fertigation and Chemigation Market Revenue Share (%), by Consumption Analysis 2025 & 2033
- Figure 30: Europe Fertigation and Chemigation Market Revenue (undefined), by Import Market Analysis (Value & Volume) 2025 & 2033
- Figure 31: Europe Fertigation and Chemigation Market Revenue Share (%), by Import Market Analysis (Value & Volume) 2025 & 2033
- Figure 32: Europe Fertigation and Chemigation Market Revenue (undefined), by Export Market Analysis (Value & Volume) 2025 & 2033
- Figure 33: Europe Fertigation and Chemigation Market Revenue Share (%), by Export Market Analysis (Value & Volume) 2025 & 2033
- Figure 34: Europe Fertigation and Chemigation Market Revenue (undefined), by Price Trend Analysis 2025 & 2033
- Figure 35: Europe Fertigation and Chemigation Market Revenue Share (%), by Price Trend Analysis 2025 & 2033
- Figure 36: Europe Fertigation and Chemigation Market Revenue (undefined), by Country 2025 & 2033
- Figure 37: Europe Fertigation and Chemigation Market Revenue Share (%), by Country 2025 & 2033
- Figure 38: Middle East & Africa Fertigation and Chemigation Market Revenue (undefined), by Production Analysis 2025 & 2033
- Figure 39: Middle East & Africa Fertigation and Chemigation Market Revenue Share (%), by Production Analysis 2025 & 2033
- Figure 40: Middle East & Africa Fertigation and Chemigation Market Revenue (undefined), by Consumption Analysis 2025 & 2033
- Figure 41: Middle East & Africa Fertigation and Chemigation Market Revenue Share (%), by Consumption Analysis 2025 & 2033
- Figure 42: Middle East & Africa Fertigation and Chemigation Market Revenue (undefined), by Import Market Analysis (Value & Volume) 2025 & 2033
- Figure 43: Middle East & Africa Fertigation and Chemigation Market Revenue Share (%), by Import Market Analysis (Value & Volume) 2025 & 2033
- Figure 44: Middle East & Africa Fertigation and Chemigation Market Revenue (undefined), by Export Market Analysis (Value & Volume) 2025 & 2033
- Figure 45: Middle East & Africa Fertigation and Chemigation Market Revenue Share (%), by Export Market Analysis (Value & Volume) 2025 & 2033
- Figure 46: Middle East & Africa Fertigation and Chemigation Market Revenue (undefined), by Price Trend Analysis 2025 & 2033
- Figure 47: Middle East & Africa Fertigation and Chemigation Market Revenue Share (%), by Price Trend Analysis 2025 & 2033
- Figure 48: Middle East & Africa Fertigation and Chemigation Market Revenue (undefined), by Country 2025 & 2033
- Figure 49: Middle East & Africa Fertigation and Chemigation Market Revenue Share (%), by Country 2025 & 2033
- Figure 50: Asia Pacific Fertigation and Chemigation Market Revenue (undefined), by Production Analysis 2025 & 2033
- Figure 51: Asia Pacific Fertigation and Chemigation Market Revenue Share (%), by Production Analysis 2025 & 2033
- Figure 52: Asia Pacific Fertigation and Chemigation Market Revenue (undefined), by Consumption Analysis 2025 & 2033
- Figure 53: Asia Pacific Fertigation and Chemigation Market Revenue Share (%), by Consumption Analysis 2025 & 2033
- Figure 54: Asia Pacific Fertigation and Chemigation Market Revenue (undefined), by Import Market Analysis (Value & Volume) 2025 & 2033
- Figure 55: Asia Pacific Fertigation and Chemigation Market Revenue Share (%), by Import Market Analysis (Value & Volume) 2025 & 2033
- Figure 56: Asia Pacific Fertigation and Chemigation Market Revenue (undefined), by Export Market Analysis (Value & Volume) 2025 & 2033
- Figure 57: Asia Pacific Fertigation and Chemigation Market Revenue Share (%), by Export Market Analysis (Value & Volume) 2025 & 2033
- Figure 58: Asia Pacific Fertigation and Chemigation Market Revenue (undefined), by Price Trend Analysis 2025 & 2033
- Figure 59: Asia Pacific Fertigation and Chemigation Market Revenue Share (%), by Price Trend Analysis 2025 & 2033
- Figure 60: Asia Pacific Fertigation and Chemigation Market Revenue (undefined), by Country 2025 & 2033
- Figure 61: Asia Pacific Fertigation and Chemigation Market Revenue Share (%), by Country 2025 & 2033
List of Tables
- Table 1: Global Fertigation and Chemigation Market Revenue undefined Forecast, by Production Analysis 2020 & 2033
- Table 2: Global Fertigation and Chemigation Market Revenue undefined Forecast, by Consumption Analysis 2020 & 2033
- Table 3: Global Fertigation and Chemigation Market Revenue undefined Forecast, by Import Market Analysis (Value & Volume) 2020 & 2033
- Table 4: Global Fertigation and Chemigation Market Revenue undefined Forecast, by Export Market Analysis (Value & Volume) 2020 & 2033
- Table 5: Global Fertigation and Chemigation Market Revenue undefined Forecast, by Price Trend Analysis 2020 & 2033
- Table 6: Global Fertigation and Chemigation Market Revenue undefined Forecast, by Region 2020 & 2033
- Table 7: Global Fertigation and Chemigation Market Revenue undefined Forecast, by Production Analysis 2020 & 2033
- Table 8: Global Fertigation and Chemigation Market Revenue undefined Forecast, by Consumption Analysis 2020 & 2033
- Table 9: Global Fertigation and Chemigation Market Revenue undefined Forecast, by Import Market Analysis (Value & Volume) 2020 & 2033
- Table 10: Global Fertigation and Chemigation Market Revenue undefined Forecast, by Export Market Analysis (Value & Volume) 2020 & 2033
- Table 11: Global Fertigation and Chemigation Market Revenue undefined Forecast, by Price Trend Analysis 2020 & 2033
- Table 12: Global Fertigation and Chemigation Market Revenue undefined Forecast, by Country 2020 & 2033
- Table 13: United States Fertigation and Chemigation Market Revenue (undefined) Forecast, by Application 2020 & 2033
- Table 14: Canada Fertigation and Chemigation Market Revenue (undefined) Forecast, by Application 2020 & 2033
- Table 15: Mexico Fertigation and Chemigation Market Revenue (undefined) Forecast, by Application 2020 & 2033
- Table 16: Global Fertigation and Chemigation Market Revenue undefined Forecast, by Production Analysis 2020 & 2033
- Table 17: Global Fertigation and Chemigation Market Revenue undefined Forecast, by Consumption Analysis 2020 & 2033
- Table 18: Global Fertigation and Chemigation Market Revenue undefined Forecast, by Import Market Analysis (Value & Volume) 2020 & 2033
- Table 19: Global Fertigation and Chemigation Market Revenue undefined Forecast, by Export Market Analysis (Value & Volume) 2020 & 2033
- Table 20: Global Fertigation and Chemigation Market Revenue undefined Forecast, by Price Trend Analysis 2020 & 2033
- Table 21: Global Fertigation and Chemigation Market Revenue undefined Forecast, by Country 2020 & 2033
- Table 22: Brazil Fertigation and Chemigation Market Revenue (undefined) Forecast, by Application 2020 & 2033
- Table 23: Argentina Fertigation and Chemigation Market Revenue (undefined) Forecast, by Application 2020 & 2033
- Table 24: Rest of South America Fertigation and Chemigation Market Revenue (undefined) Forecast, by Application 2020 & 2033
- Table 25: Global Fertigation and Chemigation Market Revenue undefined Forecast, by Production Analysis 2020 & 2033
- Table 26: Global Fertigation and Chemigation Market Revenue undefined Forecast, by Consumption Analysis 2020 & 2033
- Table 27: Global Fertigation and Chemigation Market Revenue undefined Forecast, by Import Market Analysis (Value & Volume) 2020 & 2033
- Table 28: Global Fertigation and Chemigation Market Revenue undefined Forecast, by Export Market Analysis (Value & Volume) 2020 & 2033
- Table 29: Global Fertigation and Chemigation Market Revenue undefined Forecast, by Price Trend Analysis 2020 & 2033
- Table 30: Global Fertigation and Chemigation Market Revenue undefined Forecast, by Country 2020 & 2033
- Table 31: United Kingdom Fertigation and Chemigation Market Revenue (undefined) Forecast, by Application 2020 & 2033
- Table 32: Germany Fertigation and Chemigation Market Revenue (undefined) Forecast, by Application 2020 & 2033
- Table 33: France Fertigation and Chemigation Market Revenue (undefined) Forecast, by Application 2020 & 2033
- Table 34: Italy Fertigation and Chemigation Market Revenue (undefined) Forecast, by Application 2020 & 2033
- Table 35: Spain Fertigation and Chemigation Market Revenue (undefined) Forecast, by Application 2020 & 2033
- Table 36: Russia Fertigation and Chemigation Market Revenue (undefined) Forecast, by Application 2020 & 2033
- Table 37: Benelux Fertigation and Chemigation Market Revenue (undefined) Forecast, by Application 2020 & 2033
- Table 38: Nordics Fertigation and Chemigation Market Revenue (undefined) Forecast, by Application 2020 & 2033
- Table 39: Rest of Europe Fertigation and Chemigation Market Revenue (undefined) Forecast, by Application 2020 & 2033
- Table 40: Global Fertigation and Chemigation Market Revenue undefined Forecast, by Production Analysis 2020 & 2033
- Table 41: Global Fertigation and Chemigation Market Revenue undefined Forecast, by Consumption Analysis 2020 & 2033
- Table 42: Global Fertigation and Chemigation Market Revenue undefined Forecast, by Import Market Analysis (Value & Volume) 2020 & 2033
- Table 43: Global Fertigation and Chemigation Market Revenue undefined Forecast, by Export Market Analysis (Value & Volume) 2020 & 2033
- Table 44: Global Fertigation and Chemigation Market Revenue undefined Forecast, by Price Trend Analysis 2020 & 2033
- Table 45: Global Fertigation and Chemigation Market Revenue undefined Forecast, by Country 2020 & 2033
- Table 46: Turkey Fertigation and Chemigation Market Revenue (undefined) Forecast, by Application 2020 & 2033
- Table 47: Israel Fertigation and Chemigation Market Revenue (undefined) Forecast, by Application 2020 & 2033
- Table 48: GCC Fertigation and Chemigation Market Revenue (undefined) Forecast, by Application 2020 & 2033
- Table 49: North Africa Fertigation and Chemigation Market Revenue (undefined) Forecast, by Application 2020 & 2033
- Table 50: South Africa Fertigation and Chemigation Market Revenue (undefined) Forecast, by Application 2020 & 2033
- Table 51: Rest of Middle East & Africa Fertigation and Chemigation Market Revenue (undefined) Forecast, by Application 2020 & 2033
- Table 52: Global Fertigation and Chemigation Market Revenue undefined Forecast, by Production Analysis 2020 & 2033
- Table 53: Global Fertigation and Chemigation Market Revenue undefined Forecast, by Consumption Analysis 2020 & 2033
- Table 54: Global Fertigation and Chemigation Market Revenue undefined Forecast, by Import Market Analysis (Value & Volume) 2020 & 2033
- Table 55: Global Fertigation and Chemigation Market Revenue undefined Forecast, by Export Market Analysis (Value & Volume) 2020 & 2033
- Table 56: Global Fertigation and Chemigation Market Revenue undefined Forecast, by Price Trend Analysis 2020 & 2033
- Table 57: Global Fertigation and Chemigation Market Revenue undefined Forecast, by Country 2020 & 2033
- Table 58: China Fertigation and Chemigation Market Revenue (undefined) Forecast, by Application 2020 & 2033
- Table 59: India Fertigation and Chemigation Market Revenue (undefined) Forecast, by Application 2020 & 2033
- Table 60: Japan Fertigation and Chemigation Market Revenue (undefined) Forecast, by Application 2020 & 2033
- Table 61: South Korea Fertigation and Chemigation Market Revenue (undefined) Forecast, by Application 2020 & 2033
- Table 62: ASEAN Fertigation and Chemigation Market Revenue (undefined) Forecast, by Application 2020 & 2033
- Table 63: Oceania Fertigation and Chemigation Market Revenue (undefined) Forecast, by Application 2020 & 2033
- Table 64: Rest of Asia Pacific Fertigation and Chemigation Market Revenue (undefined) Forecast, by Application 2020 & 2033
Frequently Asked Questions
1. What is the projected Compound Annual Growth Rate (CAGR) of the Fertigation and Chemigation Market?
The projected CAGR is approximately 6.5%.
2. Which companies are prominent players in the Fertigation and Chemigation Market?
Key companies in the market include The Toro Company, Lindsay Corporation, T-L Irrigation Co, Rain Bird Corporation, EPC Industrie Limite, Nelson Irrigation Corporation, Netafim, Valmont Industries Inc, Rivulis Irrigation, Jain Irrigation Systems Limited.
3. What are the main segments of the Fertigation and Chemigation Market?
The market segments include Production Analysis, Consumption Analysis, Import Market Analysis (Value & Volume), Export Market Analysis (Value & Volume), Price Trend Analysis.
4. Can you provide details about the market size?
The market size is estimated to be USD XXX N/A as of 2022.
5. What are some drivers contributing to market growth?
Increasing Legalization of Cannabis; Growing Focus on Health Benefits of Cannabis.
6. What are the notable trends driving market growth?
Increase in Awareness of Drip Irrigation System is Driving the Market.
7. Are there any restraints impacting market growth?
Lack of Data on Dosages and Results; Lack of Access to Financial Assistance.
8. Can you provide examples of recent developments in the market?
N/A
9. What pricing options are available for accessing the report?
Pricing options include single-user, multi-user, and enterprise licenses priced at USD 4750, USD 5250, and USD 8750 respectively.
10. Is the market size provided in terms of value or volume?
The market size is provided in terms of value, measured in N/A.
11. Are there any specific market keywords associated with the report?
Yes, the market keyword associated with the report is "Fertigation and Chemigation Market," which aids in identifying and referencing the specific market segment covered.
12. How do I determine which pricing option suits my needs best?
The pricing options vary based on user requirements and access needs. Individual users may opt for single-user licenses, while businesses requiring broader access may choose multi-user or enterprise licenses for cost-effective access to the report.
13. Are there any additional resources or data provided in the Fertigation and Chemigation Market report?
While the report offers comprehensive insights, it's advisable to review the specific contents or supplementary materials provided to ascertain if additional resources or data are available.
14. How can I stay updated on further developments or reports in the Fertigation and Chemigation Market?
To stay informed about further developments, trends, and reports in the Fertigation and Chemigation Market, consider subscribing to industry newsletters, following relevant companies and organizations, or regularly checking reputable industry news sources and publications.
Methodology
Step 1 - Identification of Relevant Samples Size from Population Database


Step 2 - Approaches for Defining Global Market Size (Value, Volume* & Price*)

Note*: In applicable scenarios
Step 3 - Data Sources
Primary Research
- Web Analytics
- Survey Reports
- Research Institute
- Latest Research Reports
- Opinion Leaders
Secondary Research
- Annual Reports
- White Paper
- Latest Press Release
- Industry Association
- Paid Database
- Investor Presentations

Step 4 - Data Triangulation
Involves using different sources of information in order to increase the validity of a study
These sources are likely to be stakeholders in a program - participants, other researchers, program staff, other community members, and so on.
Then we put all data in single framework & apply various statistical tools to find out the dynamic on the market.
During the analysis stage, feedback from the stakeholder groups would be compared to determine areas of agreement as well as areas of divergence