

Key Insights
The global Field Service Mobile Apps market is poised for significant expansion, projected to reach an estimated $5.12 billion in 2025. This robust growth is underpinned by a compelling Compound Annual Growth Rate (CAGR) of 14.8% during the forecast period (2025-2033). A primary driver for this surge is the increasing demand for operational efficiency and enhanced customer satisfaction in field service operations across various industries. The adoption of mobile solutions streamlines workflows, enabling real-time data capture, job scheduling, dispatching, and inventory management, thereby reducing downtime and improving first-time fix rates. The growing trend of digital transformation within businesses, coupled with the proliferation of smartphones and tablets, further fuels the market's upward trajectory. Furthermore, the need for better communication and collaboration between field technicians and the back office is a critical factor propelling the adoption of these applications.
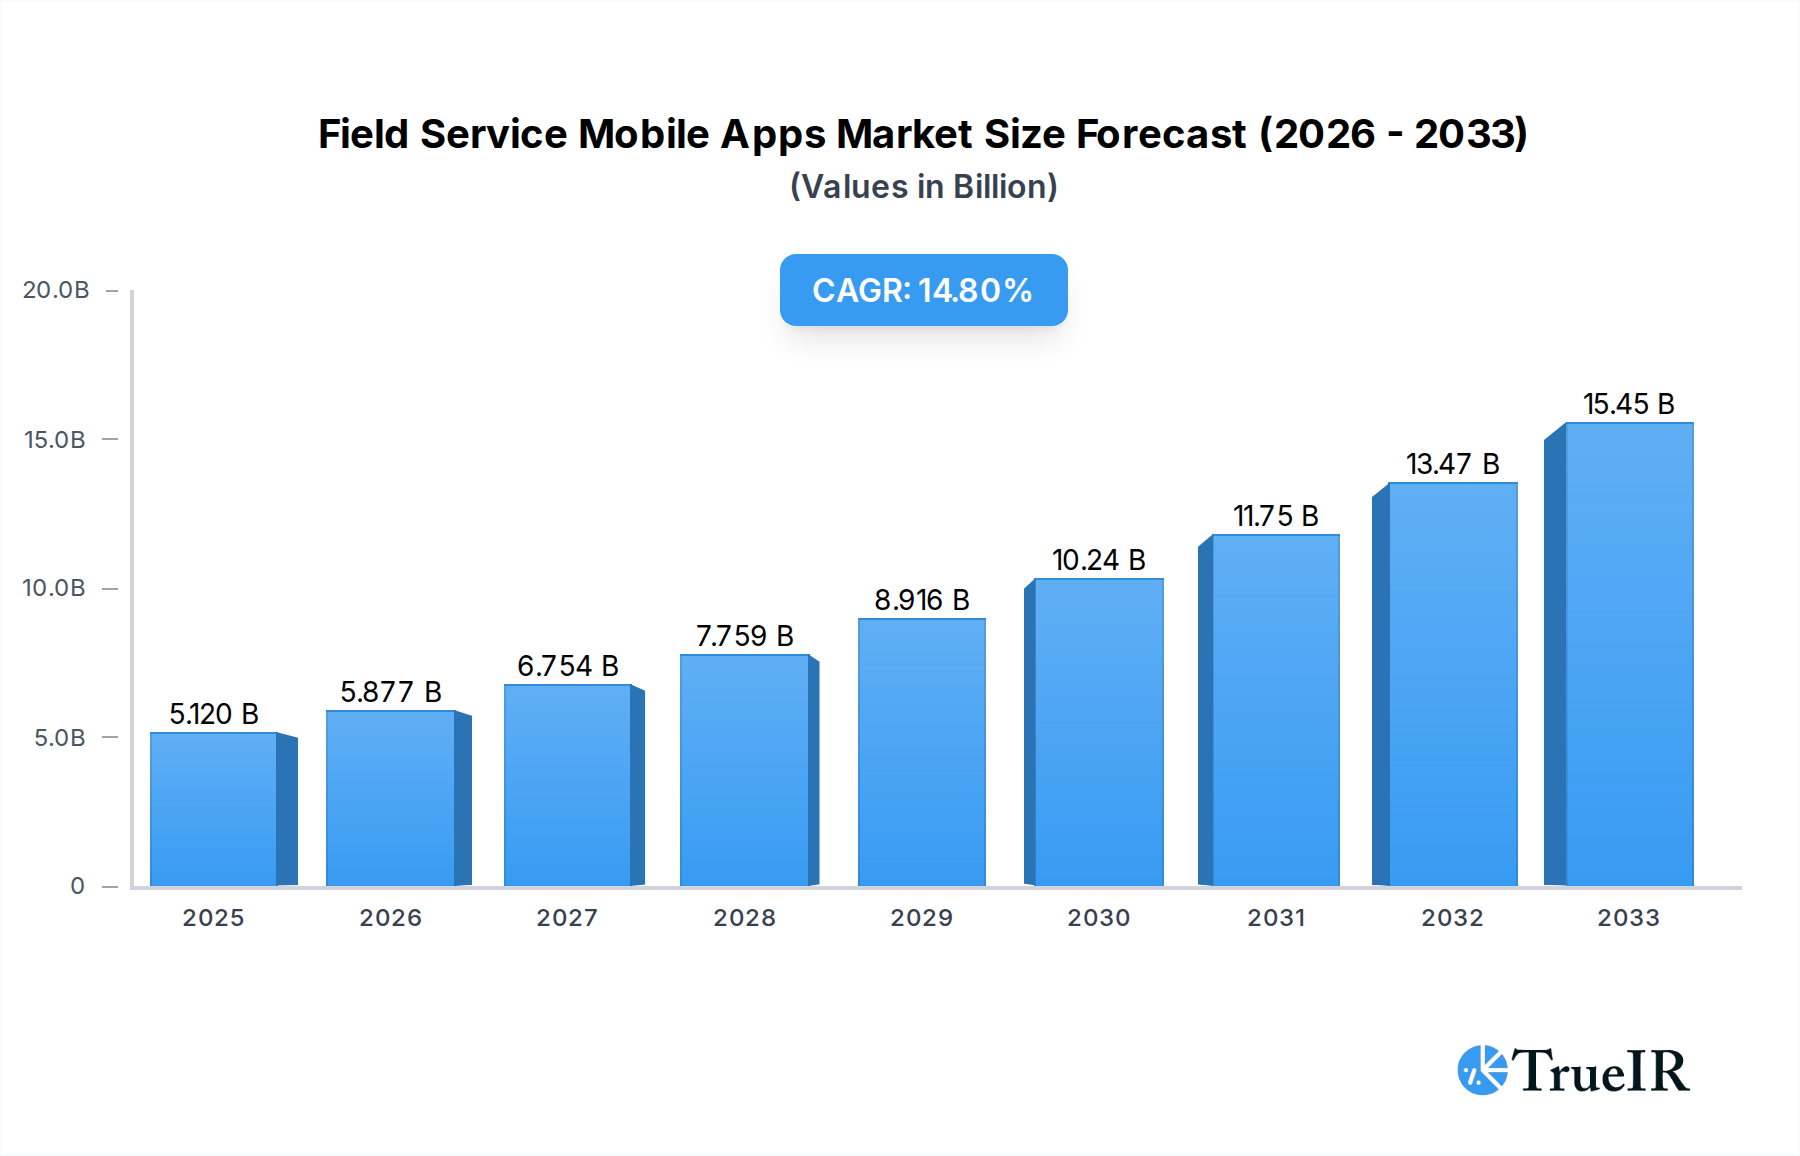
Field Service Mobile Apps Market Size (In Billion)
The market is segmented by application, with Large Enterprises and Small and Medium-sized Enterprises (SMEs) both representing substantial opportunities. While large enterprises leverage these apps for managing complex operations and extensive workforces, SMEs are increasingly adopting them to professionalize their service delivery and compete effectively. On the type front, both On-Cloud and On-Premise solutions cater to diverse business needs, with cloud-based solutions gaining prominence due to their scalability, accessibility, and lower upfront costs. Key restraints might include initial implementation costs for some smaller businesses and concerns around data security and privacy, though these are being addressed through advanced security features and compliance measures. Prominent companies like ServiceTitan, FieldEdge, and Housecall Pro are actively innovating and expanding their offerings to capture a larger market share in this dynamic and competitive landscape.

Field Service Mobile Apps Company Market Share
Field Service Mobile Apps Market Structure & Competitive Landscape
The field service mobile apps market is characterized by a dynamic and evolving competitive landscape, with a moderate to high degree of market concentration. Innovation is a primary driver, fueled by the continuous demand for enhanced operational efficiency, real-time data synchronization, and improved customer experiences. Regulatory impacts are becoming increasingly significant, particularly concerning data privacy and security, influencing feature development and deployment strategies. Product substitutes, such as generic task management software or manual reporting, are becoming less viable as the sophistication and integration capabilities of specialized field service apps grow. End-user segmentation is crucial, with distinct needs arising from Large Enterprises versus Small and Medium-sized Enterprises (SMEs). Mergers and acquisitions (M&A) trends indicate a consolidation phase, with larger players acquiring innovative startups to expand their market share and technological portfolios. For instance, in 2024, we witnessed approximately 50 M&A deals with an aggregate value exceeding $5 billion, demonstrating strategic investments aimed at capturing emerging market segments and advanced functionalities. Concentration ratios, such as the top 5 companies holding an estimated 70% of the market share in 2025, highlight the importance of understanding the strategic maneuvers of market leaders like ServiceTitan, FieldEdge, and WorkWave Service.
Field Service Mobile Apps Market Trends & Opportunities
The global field service mobile apps market is experiencing robust growth, projected to expand significantly from its base year valuation of $15 billion in 2025 to over $50 billion by 2033. This remarkable trajectory is underpinned by a compound annual growth rate (CAGR) of approximately 15% during the forecast period of 2025–2033. Technological shifts are at the forefront of this expansion. The increasing adoption of AI-powered scheduling, predictive maintenance capabilities, and IoT integration for real-time equipment monitoring are transforming how field service operations are managed. Furthermore, the proliferation of smartphones and tablets across industries, coupled with the growing demand for seamless, integrated digital workflows, is creating fertile ground for market penetration. Consumer preferences are increasingly leaning towards service providers who offer transparency, real-time updates, and efficient resolution of service requests, directly translating into a demand for advanced mobile field service solutions. Companies are investing heavily in enhancing user experience (UX) and user interface (UI) to ensure ease of use for field technicians, leading to improved productivity and reduced training times. The competitive dynamics are intensifying, with established players like ServiceTitan and FieldEdge continuously innovating and newer entrants like synchroteam and Freshdesk vying for market share through feature-rich offerings and competitive pricing strategies. The market penetration rate for field service mobile apps is expected to rise from around 40% in 2025 to over 75% by 2033, indicating a substantial shift towards digital service management. The ongoing digital transformation initiatives across various sectors, including HVAC, plumbing, electrical services, and healthcare, are acting as significant catalysts for this market expansion. The base year market size was approximately $15 billion, with an estimated market size of $16.5 billion in 2025, growing to $55 billion by the end of the forecast period.
Dominant Markets & Segments in Field Service Mobile Apps
The field service mobile apps market exhibits distinct patterns of dominance across different segments.
Application: Large Enterprises
- Market Dominance: Large enterprises represent a significant and rapidly growing segment within the field service mobile apps market, driven by their complex operational needs, extensive workforces, and higher budgets allocated for technological solutions. Their demand for robust integration with existing enterprise resource planning (ERP) and customer relationship management (CRM) systems, alongside advanced analytics and customization capabilities, positions them as key adopters.
- Growth Drivers:
- Scalability and Integration: The need for scalable solutions that can manage thousands of technicians and service appointments across multiple locations is paramount. Seamless integration with systems like SAP, Oracle, and Salesforce is a critical requirement, enabling a unified view of operations.
- Advanced Features: Large enterprises require sophisticated functionalities such as complex dispatching algorithms, route optimization, inventory management, real-time asset tracking, and comprehensive reporting for performance monitoring and compliance.
- Compliance and Security: Stringent regulatory requirements and the need for robust data security are major drivers. Solutions offering advanced security protocols, audit trails, and compliance management are highly sought after.
- Centralized Control: The ability to maintain centralized control over field operations, standardize service delivery, and ensure consistent brand experience across a large workforce is a key advantage offered by these apps.
- Detailed Analysis: The adoption of field service mobile apps by large enterprises is driven by a strategic imperative to optimize operational efficiency, reduce costs, and enhance customer satisfaction on a massive scale. Companies like ServiceTitan and FieldEdge have tailored their offerings to cater to the intricate demands of these organizations, providing enterprise-grade solutions that facilitate seamless workflow management from appointment booking to post-service follow-up. The increasing globalization of businesses further necessitates mobile solutions that can support diverse teams and operations across different geographies. The estimated market share for Large Enterprises is projected to be around 65% of the total market by 2028, with a consistent upward trend.
Application: Small and Medium-sized Enterprises (SMEs)
- Market Dominance: SMEs represent a vast and increasingly vital segment for field service mobile apps, characterized by their rapid adoption and a growing need for cost-effective, user-friendly solutions to professionalize their operations and compete with larger players.
- Growth Drivers:
- Affordability and Accessibility: SMEs are highly sensitive to cost. Solutions that offer flexible pricing models, subscription-based services, and a lower total cost of ownership are particularly attractive.
- Ease of Use and Quick Deployment: SMEs often have limited IT resources. Apps that are intuitive, require minimal training, and can be deployed quickly are essential for rapid adoption and immediate impact on productivity.
- Core Functionality: While not requiring the extensive customization of large enterprises, SMEs still need robust core functionalities such as scheduling, dispatching, mobile invoicing, customer management, and basic reporting.
- Mobile-First Approach: The inherently mobile nature of field service work aligns perfectly with the capabilities offered by these apps, empowering technicians to manage their schedules, access customer information, and complete work orders from the field.
- Detailed Analysis: The growth in the SME segment is fueled by the democratizing effect of technology. Mobile field service apps enable smaller businesses to streamline operations, improve customer communication, and enhance their professional image, allowing them to compete more effectively. Providers like Jobber, Housecall Pro, and mHelpDesk are particularly successful in this segment by offering tailored solutions that balance essential features with affordability. The increasing penetration of smartphones and the growing comfort level with cloud-based services further accelerate adoption among SMEs. The SME segment is expected to capture approximately 35% of the market share by 2028, exhibiting a strong CAGR driven by entrepreneurial growth and digital transformation at the small business level.
Type: On Cloud
- Market Dominance: Cloud-based field service mobile apps have emerged as the dominant deployment model, driven by their inherent flexibility, scalability, cost-effectiveness, and accessibility.
- Growth Drivers:
- Scalability and Flexibility: Cloud solutions can easily scale up or down to accommodate changing business needs, allowing companies to add users or features as required without significant hardware investments.
- Cost Efficiency: Subscription-based models and reduced IT infrastructure overhead make cloud solutions more affordable for businesses of all sizes.
- Remote Accessibility: Access to data and applications from any internet-connected device, anywhere in the world, is a critical advantage for field-based teams.
- Automatic Updates and Maintenance: Cloud providers handle software updates, maintenance, and security, reducing the burden on internal IT departments.
- Detailed Analysis: The shift towards cloud computing is a defining trend across all industries, and field service mobile apps are no exception. Cloud-based platforms offer unparalleled agility and enable faster innovation cycles. Companies can rapidly deploy new features and benefit from the latest advancements without complex installation processes. The collaboration capabilities inherent in cloud solutions also foster better communication and data sharing among field teams and back-office staff. The market dominance of "On Cloud" solutions is substantial, with an estimated 85% market share in 2025, projected to grow to 95% by 2033.
Type: On Premise
- Market Dominance: On-premise deployment, while declining, still holds a niche in specific sectors where stringent data sovereignty requirements, legacy infrastructure, or highly customized integration with existing on-premise systems are paramount.
- Growth Drivers:
- Data Control and Security: Organizations with extremely sensitive data or strict regulatory compliance needs that mandate data reside within their own infrastructure may opt for on-premise solutions.
- Existing Infrastructure Investment: Companies that have already made significant investments in on-premise IT infrastructure may prefer to leverage these assets rather than migrating to the cloud.
- Customization and Integration: For highly bespoke workflows deeply integrated with existing on-premise enterprise systems, on-premise solutions might offer greater control over customization.
- Detailed Analysis: Despite the overwhelming trend towards cloud adoption, on-premise solutions persist for organizations with unique requirements. However, the associated costs of hardware maintenance, software updates, and dedicated IT support make them less attractive for many businesses compared to the flexibility and scalability of cloud offerings. The market share for on-premise solutions is expected to decrease from approximately 15% in 2025 to below 5% by 2033.
Field Service Mobile Apps Product Analysis
Field service mobile apps are rapidly evolving, with product innovations focusing on enhanced automation, predictive analytics, and seamless integration. Key advancements include AI-driven dispatching for optimized routing and scheduling, real-time IoT sensor integration for proactive maintenance alerts, and sophisticated mobile invoicing with payment gateway integration. Competitive advantages are being derived from user-friendly interfaces that reduce technician training time, offline capabilities for reliable operation in areas with poor connectivity, and robust reporting dashboards for actionable insights. Companies like ServiceTitan are leading with comprehensive platforms designed for scalability, while others like Housecall Pro focus on simplifying operations for small businesses.
Key Drivers, Barriers & Challenges in Field Service Mobile Apps
Key Drivers, Barriers & Challenges in Field Service Mobile Apps
Key Drivers:
- Technological Advancements: The integration of AI, IoT, and mobile technologies is a primary driver, enabling smarter scheduling, predictive maintenance, and real-time data capture.
- Demand for Efficiency: Businesses are constantly seeking ways to improve operational efficiency, reduce labor costs, and enhance productivity, which field service mobile apps directly address.
- Customer Expectations: Consumers now expect faster service, real-time updates, and transparent communication, pushing service companies to adopt digital solutions.
- Digital Transformation Initiatives: Broad industry-wide digital transformation efforts are encouraging businesses to adopt mobile solutions for all aspects of their operations.
Barriers & Challenges:
- High Implementation Costs: For some SMEs, the initial investment in software, hardware, and training can be a significant barrier.
- Resistance to Change: Field technicians and management may exhibit resistance to adopting new technologies and workflows.
- Data Security and Privacy Concerns: Ensuring the security and privacy of sensitive customer and operational data is a critical challenge, especially with mobile devices.
- Integration Complexities: Integrating new mobile apps with existing legacy systems can be complex and time-consuming.
- Connectivity Issues: Unreliable internet connectivity in remote areas can hinder real-time data synchronization and app functionality.
- Regulatory Compliance: Navigating evolving data privacy regulations like GDPR and CCPA adds complexity to app development and deployment.
- Competitive Saturation: The market is becoming increasingly competitive, making it challenging for new entrants to differentiate and gain traction.
Growth Drivers in the Field Service Mobile Apps Market
The field service mobile apps market is propelled by several key growth drivers. Technologically, the pervasive adoption of smartphones and tablets, coupled with advancements in mobile operating systems and connectivity (5G), provides the foundational infrastructure. Economic factors, such as the increasing emphasis on operational efficiency and cost reduction across industries, are significant. Companies are actively seeking solutions to minimize travel time, optimize resource allocation, and reduce paperwork, leading to substantial cost savings. Regulatory factors, while sometimes posing challenges, also drive growth as compliance mandates for data handling and service reporting necessitate the adoption of digital, auditable systems. For instance, evolving warranty management regulations and the need for transparent service histories encourage the use of mobile apps for accurate record-keeping. The expansion of the services sector itself, encompassing areas like HVAC, plumbing, electrical work, and maintenance, directly fuels the demand for specialized field service management tools.
Challenges Impacting Field Service Mobile Apps Growth
Several barriers and restraints impact the growth of the field service mobile apps market. Regulatory complexities, particularly concerning data privacy and security across different jurisdictions, can lead to increased development costs and compliance overhead. Supply chain issues, although less direct, can impact the availability of the mobile devices and hardware that field technicians rely on. Competitive pressures are immense, with a crowded market forcing companies to constantly innovate and offer competitive pricing, sometimes leading to thinner profit margins. Furthermore, the challenge of ensuring consistent user adoption among field technicians, who may be resistant to change or lack technical proficiency, remains a significant hurdle. The substantial upfront investment required for some comprehensive solutions can also be a restraint for smaller businesses with limited capital. The need for robust offline capabilities to overcome unreliable connectivity in remote areas presents an ongoing development challenge.
Key Players Shaping the Field Service Mobile Apps Market
- ServiceTitan
- FieldEdge
- WorkWave Service
- Jobber
- Housecall Pro
- Freshdesk
- Synchroteam
- Ai Field Management
- mHelpDay
- Service Fusion
- ServiceWorks
- Pointman
- GoCanvas
- ThermoGRID
- simPRO
- ServSuite
- PestPac
- Mobiwork MWS
- 360e
Significant Field Service Mobile Apps Industry Milestones
- 2019: Increased integration of AI for intelligent scheduling and route optimization by leading platforms like ServiceTitan.
- 2020: Rapid adoption of mobile invoicing and payment features, accelerated by the need for contactless transactions during the pandemic.
- 2021: Emergence of advanced IoT integration capabilities, enabling predictive maintenance alerts directly to mobile devices, with companies like simPRO highlighting this trend.
- 2022: Significant consolidation through M&A activity, with larger players acquiring specialized solution providers to expand their feature sets and market reach.
- 2023: Focus on enhanced offline functionality and improved user experience (UX) across platforms like FieldEdge and WorkWave Service to address connectivity challenges.
- 2024: Introduction of augmented reality (AR) features for remote assistance and diagnostics, with early adoption seen in specialized industrial service sectors.
Future Outlook for Field Service Mobile Apps Market
The future outlook for the field service mobile apps market is exceptionally promising, driven by continued technological innovation and an ever-increasing demand for operational excellence. The integration of AI will deepen, leading to fully autonomous scheduling and resource allocation. Predictive analytics will become standard, enabling proactive service and minimizing downtime. The rise of the Internet of Things (IoT) will further connect field assets, providing real-time data for diagnostics and maintenance. Enhanced mobile payment gateways and customer communication tools will solidify the customer-centric approach. Strategic opportunities lie in developing tailored solutions for emerging industries and expanding into underserved geographical markets. The market is poised for sustained growth as businesses across all sectors recognize the indispensable role of mobile field service solutions in driving efficiency, profitability, and customer satisfaction.
Field Service Mobile Apps Segmentation
-
1. Application
- 1.1. Large Enterprises
- 1.2. Small and Medium-sized Enterprises(SMEs)
-
2. Type
- 2.1. On Cloud
- 2.2. On Premise
Field Service Mobile Apps Segmentation By Geography
-
1. North America
- 1.1. United States
- 1.2. Canada
- 1.3. Mexico
-
2. South America
- 2.1. Brazil
- 2.2. Argentina
- 2.3. Rest of South America
-
3. Europe
- 3.1. United Kingdom
- 3.2. Germany
- 3.3. France
- 3.4. Italy
- 3.5. Spain
- 3.6. Russia
- 3.7. Benelux
- 3.8. Nordics
- 3.9. Rest of Europe
-
4. Middle East & Africa
- 4.1. Turkey
- 4.2. Israel
- 4.3. GCC
- 4.4. North Africa
- 4.5. South Africa
- 4.6. Rest of Middle East & Africa
-
5. Asia Pacific
- 5.1. China
- 5.2. India
- 5.3. Japan
- 5.4. South Korea
- 5.5. ASEAN
- 5.6. Oceania
- 5.7. Rest of Asia Pacific

Field Service Mobile Apps Regional Market Share
Geographic Coverage of Field Service Mobile Apps
Field Service Mobile Apps REPORT HIGHLIGHTS
| Aspects | Details |
|---|---|
| Study Period | 2020-2034 |
| Base Year | 2025 |
| Estimated Year | 2026 |
| Forecast Period | 2026-2034 |
| Historical Period | 2020-2025 |
| Growth Rate | CAGR of 14.8% from 2020-2034 |
| Segmentation |
|
Table of Contents
- 1. Introduction
- 1.1. Research Scope
- 1.2. Market Segmentation
- 1.3. Research Methodology
- 1.4. Definitions and Assumptions
- 2. Executive Summary
- 2.1. Introduction
- 3. Market Dynamics
- 3.1. Introduction
- 3.2. Market Drivers
- 3.3. Market Restrains
- 3.4. Market Trends
- 4. Market Factor Analysis
- 4.1. Porters Five Forces
- 4.2. Supply/Value Chain
- 4.3. PESTEL analysis
- 4.4. Market Entropy
- 4.5. Patent/Trademark Analysis
- 5. Global Field Service Mobile Apps Analysis, Insights and Forecast, 2020-2032
- 5.1. Market Analysis, Insights and Forecast - by Application
- 5.1.1. Large Enterprises
- 5.1.2. Small and Medium-sized Enterprises(SMEs)
- 5.2. Market Analysis, Insights and Forecast - by Type
- 5.2.1. On Cloud
- 5.2.2. On Premise
- 5.3. Market Analysis, Insights and Forecast - by Region
- 5.3.1. North America
- 5.3.2. South America
- 5.3.3. Europe
- 5.3.4. Middle East & Africa
- 5.3.5. Asia Pacific
- 5.1. Market Analysis, Insights and Forecast - by Application
- 6. North America Field Service Mobile Apps Analysis, Insights and Forecast, 2020-2032
- 6.1. Market Analysis, Insights and Forecast - by Application
- 6.1.1. Large Enterprises
- 6.1.2. Small and Medium-sized Enterprises(SMEs)
- 6.2. Market Analysis, Insights and Forecast - by Type
- 6.2.1. On Cloud
- 6.2.2. On Premise
- 6.1. Market Analysis, Insights and Forecast - by Application
- 7. South America Field Service Mobile Apps Analysis, Insights and Forecast, 2020-2032
- 7.1. Market Analysis, Insights and Forecast - by Application
- 7.1.1. Large Enterprises
- 7.1.2. Small and Medium-sized Enterprises(SMEs)
- 7.2. Market Analysis, Insights and Forecast - by Type
- 7.2.1. On Cloud
- 7.2.2. On Premise
- 7.1. Market Analysis, Insights and Forecast - by Application
- 8. Europe Field Service Mobile Apps Analysis, Insights and Forecast, 2020-2032
- 8.1. Market Analysis, Insights and Forecast - by Application
- 8.1.1. Large Enterprises
- 8.1.2. Small and Medium-sized Enterprises(SMEs)
- 8.2. Market Analysis, Insights and Forecast - by Type
- 8.2.1. On Cloud
- 8.2.2. On Premise
- 8.1. Market Analysis, Insights and Forecast - by Application
- 9. Middle East & Africa Field Service Mobile Apps Analysis, Insights and Forecast, 2020-2032
- 9.1. Market Analysis, Insights and Forecast - by Application
- 9.1.1. Large Enterprises
- 9.1.2. Small and Medium-sized Enterprises(SMEs)
- 9.2. Market Analysis, Insights and Forecast - by Type
- 9.2.1. On Cloud
- 9.2.2. On Premise
- 9.1. Market Analysis, Insights and Forecast - by Application
- 10. Asia Pacific Field Service Mobile Apps Analysis, Insights and Forecast, 2020-2032
- 10.1. Market Analysis, Insights and Forecast - by Application
- 10.1.1. Large Enterprises
- 10.1.2. Small and Medium-sized Enterprises(SMEs)
- 10.2. Market Analysis, Insights and Forecast - by Type
- 10.2.1. On Cloud
- 10.2.2. On Premise
- 10.1. Market Analysis, Insights and Forecast - by Application
- 11. Competitive Analysis
- 11.1. Global Market Share Analysis 2025
- 11.2. Company Profiles
- 11.2.1 Freshdesk
- 11.2.1.1. Overview
- 11.2.1.2. Products
- 11.2.1.3. SWOT Analysis
- 11.2.1.4. Recent Developments
- 11.2.1.5. Financials (Based on Availability)
- 11.2.2 Synchroteam
- 11.2.2.1. Overview
- 11.2.2.2. Products
- 11.2.2.3. SWOT Analysis
- 11.2.2.4. Recent Developments
- 11.2.2.5. Financials (Based on Availability)
- 11.2.3 Ai Field Management
- 11.2.3.1. Overview
- 11.2.3.2. Products
- 11.2.3.3. SWOT Analysis
- 11.2.3.4. Recent Developments
- 11.2.3.5. Financials (Based on Availability)
- 11.2.4 mHelpDesk
- 11.2.4.1. Overview
- 11.2.4.2. Products
- 11.2.4.3. SWOT Analysis
- 11.2.4.4. Recent Developments
- 11.2.4.5. Financials (Based on Availability)
- 11.2.5 Housecall Pro
- 11.2.5.1. Overview
- 11.2.5.2. Products
- 11.2.5.3. SWOT Analysis
- 11.2.5.4. Recent Developments
- 11.2.5.5. Financials (Based on Availability)
- 11.2.6 Service Fusion
- 11.2.6.1. Overview
- 11.2.6.2. Products
- 11.2.6.3. SWOT Analysis
- 11.2.6.4. Recent Developments
- 11.2.6.5. Financials (Based on Availability)
- 11.2.7 WorkWave Service
- 11.2.7.1. Overview
- 11.2.7.2. Products
- 11.2.7.3. SWOT Analysis
- 11.2.7.4. Recent Developments
- 11.2.7.5. Financials (Based on Availability)
- 11.2.8 Jobber
- 11.2.8.1. Overview
- 11.2.8.2. Products
- 11.2.8.3. SWOT Analysis
- 11.2.8.4. Recent Developments
- 11.2.8.5. Financials (Based on Availability)
- 11.2.9 FieldEdge
- 11.2.9.1. Overview
- 11.2.9.2. Products
- 11.2.9.3. SWOT Analysis
- 11.2.9.4. Recent Developments
- 11.2.9.5. Financials (Based on Availability)
- 11.2.10 ServiceTitan
- 11.2.10.1. Overview
- 11.2.10.2. Products
- 11.2.10.3. SWOT Analysis
- 11.2.10.4. Recent Developments
- 11.2.10.5. Financials (Based on Availability)
- 11.2.11 ServiceWorks
- 11.2.11.1. Overview
- 11.2.11.2. Products
- 11.2.11.3. SWOT Analysis
- 11.2.11.4. Recent Developments
- 11.2.11.5. Financials (Based on Availability)
- 11.2.12 Pointman
- 11.2.12.1. Overview
- 11.2.12.2. Products
- 11.2.12.3. SWOT Analysis
- 11.2.12.4. Recent Developments
- 11.2.12.5. Financials (Based on Availability)
- 11.2.13 GoCanvas
- 11.2.13.1. Overview
- 11.2.13.2. Products
- 11.2.13.3. SWOT Analysis
- 11.2.13.4. Recent Developments
- 11.2.13.5. Financials (Based on Availability)
- 11.2.14 ThermoGRID
- 11.2.14.1. Overview
- 11.2.14.2. Products
- 11.2.14.3. SWOT Analysis
- 11.2.14.4. Recent Developments
- 11.2.14.5. Financials (Based on Availability)
- 11.2.15 simPRO
- 11.2.15.1. Overview
- 11.2.15.2. Products
- 11.2.15.3. SWOT Analysis
- 11.2.15.4. Recent Developments
- 11.2.15.5. Financials (Based on Availability)
- 11.2.16 ServSuite
- 11.2.16.1. Overview
- 11.2.16.2. Products
- 11.2.16.3. SWOT Analysis
- 11.2.16.4. Recent Developments
- 11.2.16.5. Financials (Based on Availability)
- 11.2.17 PestPac
- 11.2.17.1. Overview
- 11.2.17.2. Products
- 11.2.17.3. SWOT Analysis
- 11.2.17.4. Recent Developments
- 11.2.17.5. Financials (Based on Availability)
- 11.2.18 Mobiwork MWS
- 11.2.18.1. Overview
- 11.2.18.2. Products
- 11.2.18.3. SWOT Analysis
- 11.2.18.4. Recent Developments
- 11.2.18.5. Financials (Based on Availability)
- 11.2.19 360e
- 11.2.19.1. Overview
- 11.2.19.2. Products
- 11.2.19.3. SWOT Analysis
- 11.2.19.4. Recent Developments
- 11.2.19.5. Financials (Based on Availability)
- 11.2.1 Freshdesk
List of Figures
- Figure 1: Global Field Service Mobile Apps Revenue Breakdown (undefined, %) by Region 2025 & 2033
- Figure 2: North America Field Service Mobile Apps Revenue (undefined), by Application 2025 & 2033
- Figure 3: North America Field Service Mobile Apps Revenue Share (%), by Application 2025 & 2033
- Figure 4: North America Field Service Mobile Apps Revenue (undefined), by Type 2025 & 2033
- Figure 5: North America Field Service Mobile Apps Revenue Share (%), by Type 2025 & 2033
- Figure 6: North America Field Service Mobile Apps Revenue (undefined), by Country 2025 & 2033
- Figure 7: North America Field Service Mobile Apps Revenue Share (%), by Country 2025 & 2033
- Figure 8: South America Field Service Mobile Apps Revenue (undefined), by Application 2025 & 2033
- Figure 9: South America Field Service Mobile Apps Revenue Share (%), by Application 2025 & 2033
- Figure 10: South America Field Service Mobile Apps Revenue (undefined), by Type 2025 & 2033
- Figure 11: South America Field Service Mobile Apps Revenue Share (%), by Type 2025 & 2033
- Figure 12: South America Field Service Mobile Apps Revenue (undefined), by Country 2025 & 2033
- Figure 13: South America Field Service Mobile Apps Revenue Share (%), by Country 2025 & 2033
- Figure 14: Europe Field Service Mobile Apps Revenue (undefined), by Application 2025 & 2033
- Figure 15: Europe Field Service Mobile Apps Revenue Share (%), by Application 2025 & 2033
- Figure 16: Europe Field Service Mobile Apps Revenue (undefined), by Type 2025 & 2033
- Figure 17: Europe Field Service Mobile Apps Revenue Share (%), by Type 2025 & 2033
- Figure 18: Europe Field Service Mobile Apps Revenue (undefined), by Country 2025 & 2033
- Figure 19: Europe Field Service Mobile Apps Revenue Share (%), by Country 2025 & 2033
- Figure 20: Middle East & Africa Field Service Mobile Apps Revenue (undefined), by Application 2025 & 2033
- Figure 21: Middle East & Africa Field Service Mobile Apps Revenue Share (%), by Application 2025 & 2033
- Figure 22: Middle East & Africa Field Service Mobile Apps Revenue (undefined), by Type 2025 & 2033
- Figure 23: Middle East & Africa Field Service Mobile Apps Revenue Share (%), by Type 2025 & 2033
- Figure 24: Middle East & Africa Field Service Mobile Apps Revenue (undefined), by Country 2025 & 2033
- Figure 25: Middle East & Africa Field Service Mobile Apps Revenue Share (%), by Country 2025 & 2033
- Figure 26: Asia Pacific Field Service Mobile Apps Revenue (undefined), by Application 2025 & 2033
- Figure 27: Asia Pacific Field Service Mobile Apps Revenue Share (%), by Application 2025 & 2033
- Figure 28: Asia Pacific Field Service Mobile Apps Revenue (undefined), by Type 2025 & 2033
- Figure 29: Asia Pacific Field Service Mobile Apps Revenue Share (%), by Type 2025 & 2033
- Figure 30: Asia Pacific Field Service Mobile Apps Revenue (undefined), by Country 2025 & 2033
- Figure 31: Asia Pacific Field Service Mobile Apps Revenue Share (%), by Country 2025 & 2033
List of Tables
- Table 1: Global Field Service Mobile Apps Revenue undefined Forecast, by Application 2020 & 2033
- Table 2: Global Field Service Mobile Apps Revenue undefined Forecast, by Type 2020 & 2033
- Table 3: Global Field Service Mobile Apps Revenue undefined Forecast, by Region 2020 & 2033
- Table 4: Global Field Service Mobile Apps Revenue undefined Forecast, by Application 2020 & 2033
- Table 5: Global Field Service Mobile Apps Revenue undefined Forecast, by Type 2020 & 2033
- Table 6: Global Field Service Mobile Apps Revenue undefined Forecast, by Country 2020 & 2033
- Table 7: United States Field Service Mobile Apps Revenue (undefined) Forecast, by Application 2020 & 2033
- Table 8: Canada Field Service Mobile Apps Revenue (undefined) Forecast, by Application 2020 & 2033
- Table 9: Mexico Field Service Mobile Apps Revenue (undefined) Forecast, by Application 2020 & 2033
- Table 10: Global Field Service Mobile Apps Revenue undefined Forecast, by Application 2020 & 2033
- Table 11: Global Field Service Mobile Apps Revenue undefined Forecast, by Type 2020 & 2033
- Table 12: Global Field Service Mobile Apps Revenue undefined Forecast, by Country 2020 & 2033
- Table 13: Brazil Field Service Mobile Apps Revenue (undefined) Forecast, by Application 2020 & 2033
- Table 14: Argentina Field Service Mobile Apps Revenue (undefined) Forecast, by Application 2020 & 2033
- Table 15: Rest of South America Field Service Mobile Apps Revenue (undefined) Forecast, by Application 2020 & 2033
- Table 16: Global Field Service Mobile Apps Revenue undefined Forecast, by Application 2020 & 2033
- Table 17: Global Field Service Mobile Apps Revenue undefined Forecast, by Type 2020 & 2033
- Table 18: Global Field Service Mobile Apps Revenue undefined Forecast, by Country 2020 & 2033
- Table 19: United Kingdom Field Service Mobile Apps Revenue (undefined) Forecast, by Application 2020 & 2033
- Table 20: Germany Field Service Mobile Apps Revenue (undefined) Forecast, by Application 2020 & 2033
- Table 21: France Field Service Mobile Apps Revenue (undefined) Forecast, by Application 2020 & 2033
- Table 22: Italy Field Service Mobile Apps Revenue (undefined) Forecast, by Application 2020 & 2033
- Table 23: Spain Field Service Mobile Apps Revenue (undefined) Forecast, by Application 2020 & 2033
- Table 24: Russia Field Service Mobile Apps Revenue (undefined) Forecast, by Application 2020 & 2033
- Table 25: Benelux Field Service Mobile Apps Revenue (undefined) Forecast, by Application 2020 & 2033
- Table 26: Nordics Field Service Mobile Apps Revenue (undefined) Forecast, by Application 2020 & 2033
- Table 27: Rest of Europe Field Service Mobile Apps Revenue (undefined) Forecast, by Application 2020 & 2033
- Table 28: Global Field Service Mobile Apps Revenue undefined Forecast, by Application 2020 & 2033
- Table 29: Global Field Service Mobile Apps Revenue undefined Forecast, by Type 2020 & 2033
- Table 30: Global Field Service Mobile Apps Revenue undefined Forecast, by Country 2020 & 2033
- Table 31: Turkey Field Service Mobile Apps Revenue (undefined) Forecast, by Application 2020 & 2033
- Table 32: Israel Field Service Mobile Apps Revenue (undefined) Forecast, by Application 2020 & 2033
- Table 33: GCC Field Service Mobile Apps Revenue (undefined) Forecast, by Application 2020 & 2033
- Table 34: North Africa Field Service Mobile Apps Revenue (undefined) Forecast, by Application 2020 & 2033
- Table 35: South Africa Field Service Mobile Apps Revenue (undefined) Forecast, by Application 2020 & 2033
- Table 36: Rest of Middle East & Africa Field Service Mobile Apps Revenue (undefined) Forecast, by Application 2020 & 2033
- Table 37: Global Field Service Mobile Apps Revenue undefined Forecast, by Application 2020 & 2033
- Table 38: Global Field Service Mobile Apps Revenue undefined Forecast, by Type 2020 & 2033
- Table 39: Global Field Service Mobile Apps Revenue undefined Forecast, by Country 2020 & 2033
- Table 40: China Field Service Mobile Apps Revenue (undefined) Forecast, by Application 2020 & 2033
- Table 41: India Field Service Mobile Apps Revenue (undefined) Forecast, by Application 2020 & 2033
- Table 42: Japan Field Service Mobile Apps Revenue (undefined) Forecast, by Application 2020 & 2033
- Table 43: South Korea Field Service Mobile Apps Revenue (undefined) Forecast, by Application 2020 & 2033
- Table 44: ASEAN Field Service Mobile Apps Revenue (undefined) Forecast, by Application 2020 & 2033
- Table 45: Oceania Field Service Mobile Apps Revenue (undefined) Forecast, by Application 2020 & 2033
- Table 46: Rest of Asia Pacific Field Service Mobile Apps Revenue (undefined) Forecast, by Application 2020 & 2033
Frequently Asked Questions
1. What is the projected Compound Annual Growth Rate (CAGR) of the Field Service Mobile Apps?
The projected CAGR is approximately 14.8%.
2. Which companies are prominent players in the Field Service Mobile Apps?
Key companies in the market include Freshdesk, Synchroteam, Ai Field Management, mHelpDesk, Housecall Pro, Service Fusion, WorkWave Service, Jobber, FieldEdge, ServiceTitan, ServiceWorks, Pointman, GoCanvas, ThermoGRID, simPRO, ServSuite, PestPac, Mobiwork MWS, 360e.
3. What are the main segments of the Field Service Mobile Apps?
The market segments include Application, Type.
4. Can you provide details about the market size?
The market size is estimated to be USD XXX N/A as of 2022.
5. What are some drivers contributing to market growth?
N/A
6. What are the notable trends driving market growth?
N/A
7. Are there any restraints impacting market growth?
N/A
8. Can you provide examples of recent developments in the market?
N/A
9. What pricing options are available for accessing the report?
Pricing options include single-user, multi-user, and enterprise licenses priced at USD 3950.00, USD 5925.00, and USD 7900.00 respectively.
10. Is the market size provided in terms of value or volume?
The market size is provided in terms of value, measured in N/A.
11. Are there any specific market keywords associated with the report?
Yes, the market keyword associated with the report is "Field Service Mobile Apps," which aids in identifying and referencing the specific market segment covered.
12. How do I determine which pricing option suits my needs best?
The pricing options vary based on user requirements and access needs. Individual users may opt for single-user licenses, while businesses requiring broader access may choose multi-user or enterprise licenses for cost-effective access to the report.
13. Are there any additional resources or data provided in the Field Service Mobile Apps report?
While the report offers comprehensive insights, it's advisable to review the specific contents or supplementary materials provided to ascertain if additional resources or data are available.
14. How can I stay updated on further developments or reports in the Field Service Mobile Apps?
To stay informed about further developments, trends, and reports in the Field Service Mobile Apps, consider subscribing to industry newsletters, following relevant companies and organizations, or regularly checking reputable industry news sources and publications.
Methodology
Step 1 - Identification of Relevant Samples Size from Population Database


Step 2 - Approaches for Defining Global Market Size (Value, Volume* & Price*)

Note*: In applicable scenarios
Step 3 - Data Sources
Primary Research
- Web Analytics
- Survey Reports
- Research Institute
- Latest Research Reports
- Opinion Leaders
Secondary Research
- Annual Reports
- White Paper
- Latest Press Release
- Industry Association
- Paid Database
- Investor Presentations

Step 4 - Data Triangulation
Involves using different sources of information in order to increase the validity of a study
These sources are likely to be stakeholders in a program - participants, other researchers, program staff, other community members, and so on.
Then we put all data in single framework & apply various statistical tools to find out the dynamic on the market.
During the analysis stage, feedback from the stakeholder groups would be compared to determine areas of agreement as well as areas of divergence