

Key Insights
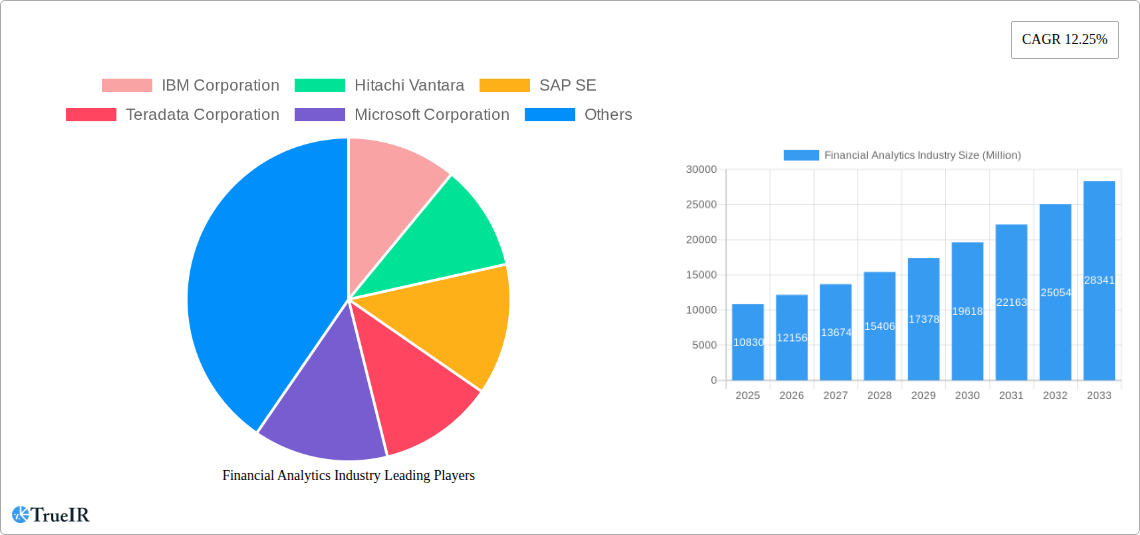
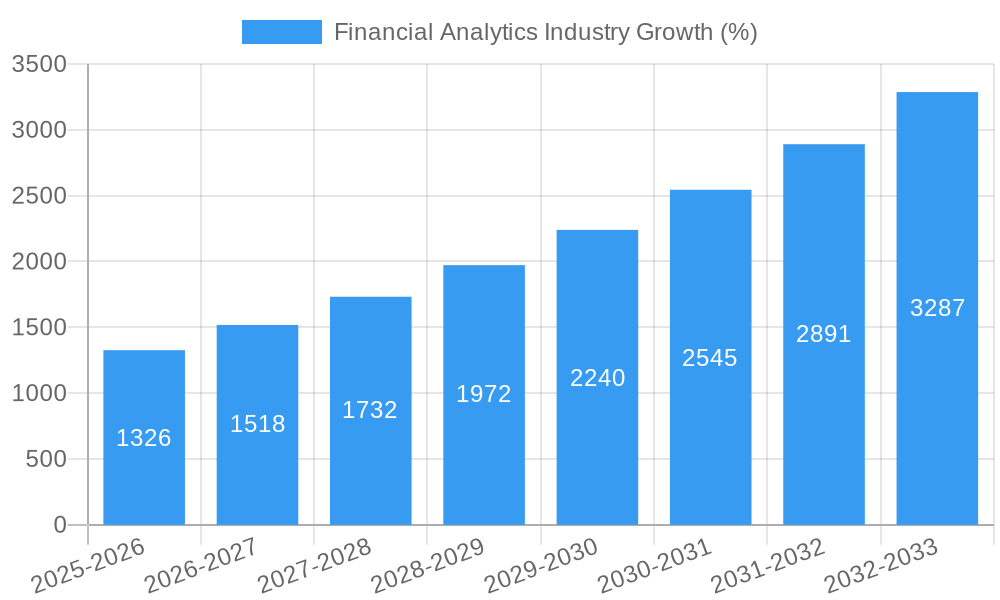
The global financial analytics market, valued at $10.83 billion in 2025, is projected to experience robust growth, driven by increasing regulatory compliance needs, the rising adoption of advanced analytics techniques (like AI and machine learning) for risk management and fraud detection, and the expanding use of cloud-based solutions for enhanced scalability and accessibility. The market's Compound Annual Growth Rate (CAGR) of 12.25% from 2025 to 2033 indicates significant expansion opportunities. Key growth drivers include the need for improved decision-making through data-driven insights, the increasing complexity of financial markets, and the growing demand for real-time analytics capabilities. The BFSI sector remains a dominant end-user vertical, fueled by the imperative for efficient risk assessment, customer relationship management, and regulatory compliance. However, the market also sees considerable traction in healthcare, manufacturing, and government sectors, as these industries leverage analytics for cost optimization, operational efficiency, and improved strategic planning. While the cloud deployment model is gaining popularity for its flexibility and cost-effectiveness, on-premise solutions continue to hold a significant market share, particularly among large enterprises with stringent security requirements.
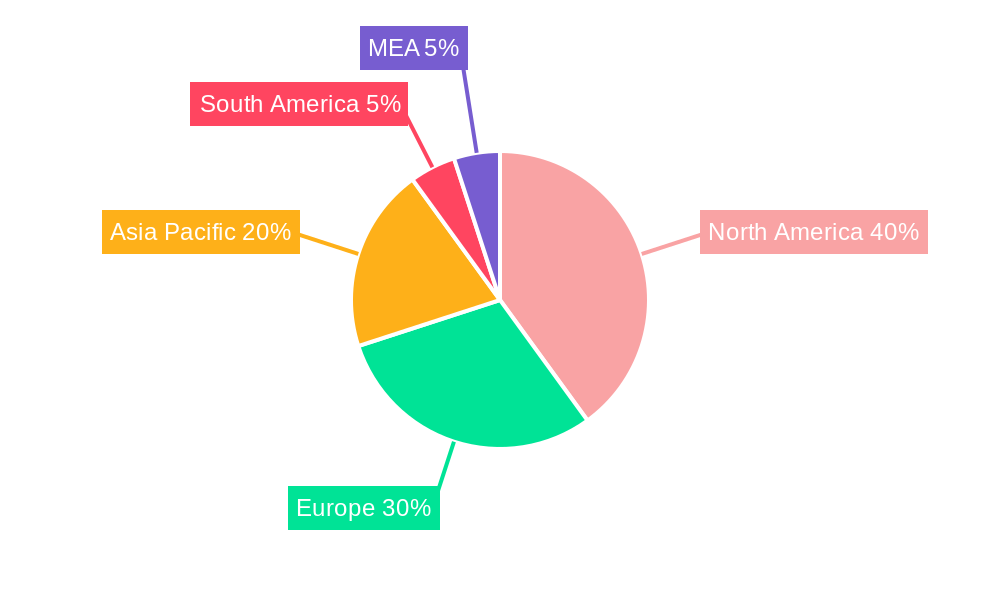
Segmentation within the market highlights the importance of specialized solutions. Database management and planning tools form a crucial segment, underpinning the entire analytics workflow. Analysis and reporting solutions, crucial for deriving meaningful insights, constitute another significant segment. The competitive landscape is populated by major technology players such as IBM, Hitachi Vantara, SAP, Teradata, Microsoft, SAS, Oracle, and FICO, all vying for market share through innovation and strategic partnerships. Geographic distribution shows a strong presence in North America and Europe, reflecting the maturity of financial markets and technology adoption in these regions. However, the Asia-Pacific region is poised for rapid growth, driven by increasing digitalization and economic development. The forecast period of 2025-2033 anticipates further market expansion, driven by continuous technological advancements and the growing adoption of financial analytics across diverse industries.
Financial Analytics Industry Market Report: 2019-2033
This comprehensive report provides a detailed analysis of the Financial Analytics industry, covering market size, segmentation, competitive landscape, and future outlook. The study period spans from 2019 to 2033, with 2025 serving as the base and estimated year. The forecast period is 2025-2033, and the historical period covers 2019-2024. The report utilizes a multitude of data points to offer insights into this dynamic market, projected to reach xx Million by 2033.
Financial Analytics Industry Market Structure & Competitive Landscape
The Financial Analytics market exhibits a moderately concentrated structure, with a few major players holding significant market share. The Herfindahl-Hirschman Index (HHI) is estimated at xx, indicating a moderately competitive landscape. Innovation is a key driver, with companies constantly developing new analytical tools and techniques leveraging AI, machine learning, and big data technologies. Regulatory changes, particularly those related to data privacy and security (like GDPR and CCPA), significantly impact market dynamics. Product substitutes, such as simpler spreadsheet-based analysis tools, exist but offer limited functionality compared to sophisticated analytics platforms.
The market is segmented by deployment type (on-premise and cloud), solution type (database management and planning, analysis and reporting, and other types), and end-user vertical (BFSI, healthcare, manufacturing, government, IT and telecom, and others). Mergers and acquisitions (M&A) activity has been relatively high in recent years, with approximately xx Million in deal value recorded between 2019 and 2024. This consolidation is expected to continue as larger players seek to expand their market share and product offerings.
- Market Concentration: HHI estimated at xx.
- Innovation Drivers: AI, Machine Learning, Big Data.
- Regulatory Impacts: GDPR, CCPA, and other data privacy regulations.
- Product Substitutes: Spreadsheet software, basic statistical packages.
- M&A Activity: Approximately xx Million in deal value (2019-2024).
Financial Analytics Industry Market Trends & Opportunities
The global Financial Analytics market is experiencing robust growth, driven by several factors. The market size was valued at xx Million in 2024 and is projected to reach xx Million by 2033, exhibiting a Compound Annual Growth Rate (CAGR) of xx% during the forecast period. Technological advancements, including the rise of cloud computing and advanced analytics techniques, are transforming the industry. Consumer preferences are shifting towards more user-friendly, accessible, and insightful analytics solutions. The increasing adoption of cloud-based solutions and the growing demand for real-time analytics are key market trends. Competitive dynamics are intensifying as established players and new entrants vie for market share, leading to innovation and improved offerings. Market penetration rates vary significantly across different segments and geographies, with the highest penetration observed in developed economies and the BFSI sector.
Dominant Markets & Segments in Financial Analytics Industry
The BFSI sector dominates the Financial Analytics market, accounting for approximately xx% of the total market value in 2024. The cloud deployment model is experiencing the fastest growth, surpassing on-premise deployments in terms of market share. The analysis and reporting solution type maintains the largest market share, followed by database management and planning solutions. North America currently holds the largest regional market share, driven by strong technological advancements and high adoption rates.
- Key Growth Drivers (BFSI): Stringent regulatory compliance needs, increasing demand for fraud detection and risk management solutions.
- Key Growth Drivers (Cloud): Scalability, cost-effectiveness, accessibility, and enhanced collaboration capabilities.
- Key Growth Drivers (Analysis & Reporting): Growing need for data-driven decision-making and improved business insights.
- Key Growth Drivers (North America): Early adoption of advanced technologies, strong technological infrastructure.
Financial Analytics Industry Product Analysis
Recent product innovations center around AI-powered predictive analytics, advanced visualization tools, and automated reporting capabilities. These advancements enable businesses to extract greater value from their data and make more informed decisions. Key competitive advantages include ease of use, integration with existing systems, and the ability to handle large volumes of data efficiently. The market is increasingly moving towards solutions that provide comprehensive, integrated analytics platforms rather than standalone tools.
Key Drivers, Barriers & Challenges in Financial Analytics Industry
Key Drivers: The increasing availability of data, advancements in analytical technologies (AI, Machine Learning), and the growing need for data-driven decision-making are key drivers. Government initiatives promoting digital transformation and data analytics further propel market growth.
Challenges: Data security and privacy concerns present significant barriers to adoption. The complexity of implementing and integrating advanced analytics solutions, along with the high cost of skilled professionals, also constrain market growth. Competition from established players and new entrants continues to intensify. Supply chain disruptions can impact the availability and cost of hardware and software components, affecting market growth. Stringent regulatory requirements, particularly those related to data privacy, add to the complexity of market operations. The estimated impact of these challenges on market growth is a reduction of xx% in the projected market value by 2033.
Growth Drivers in the Financial Analytics Industry Market
Technological advancements (AI, ML), the increasing volume and availability of data, rising demand for data-driven insights, and supportive government policies are all major drivers of growth. The BFSI sector's emphasis on risk management and fraud detection further fuels the demand for sophisticated analytical tools.
Challenges Impacting Financial Analytics Industry Growth
Data security concerns, high implementation costs, and the skills gap in data analytics are significant barriers. Regulatory compliance complexities and intense competition further challenge market growth. Supply chain vulnerabilities, particularly related to semiconductor chips, also pose a significant threat to market expansion.
Key Players Shaping the Financial Analytics Industry Market
- IBM Corporation
- Hitachi Vantara
- SAP SE
- Teradata Corporation
- Microsoft Corporation
- SAS Institute
- Oracle Corporation
- FICO
Significant Financial Analytics Industry Industry Milestones
- July 2023: Dobin, an AI-powered FinTech solution, launched in Southeast Asia, utilizing open finance and advanced data analytics to provide users with a unified view of their finances. This signifies a move towards more accessible and user-friendly financial analytics tools.
Future Outlook for Financial Analytics Industry Market
The Financial Analytics market is poised for continued growth, driven by ongoing technological innovation, increased data availability, and the growing demand for data-driven decision-making across various sectors. Strategic partnerships, acquisitions, and the development of innovative analytical solutions will further shape the market landscape. The market's potential is vast, with opportunities for growth across different regions and industry verticals. The focus will shift towards more personalized and contextualized analytics solutions, catering to the specific needs of individual businesses.
Financial Analytics Industry Segmentation
-
1. Deployment Type
- 1.1. On-premise
- 1.2. Cloud
-
2. Solution Type
- 2.1. Database Management and Planning
- 2.2. Analysis and Reporting
- 2.3. Other Type
-
3. End-user Vertical
- 3.1. BFSI
- 3.2. Healthcare
- 3.3. Manufacturing
- 3.4. Government
- 3.5. IT and Telecom
- 3.6. Other End-user Verticals
Financial Analytics Industry Segmentation By Geography
-
1. North America
- 1.1. United States
- 1.2. Canada
-
2. Europe
- 2.1. United Kingdom
- 2.2. Germany
- 2.3. France
- 2.4. Rest of Europe
-
3. Asia Pacific
- 3.1. China
- 3.2. Japan
- 3.3. Singapore
- 3.4. India
- 3.5. South Korea
- 3.6. Rest of Asia Pacific
-
4. Latin America
- 4.1. Mexico
- 4.2. Brazil
- 4.3. Rest of Latin America
-
5. Middle East and Africa
- 5.1. United Arab Emirates
- 5.2. South Africa
- 5.3. Rest of Middle East and Africa
Financial Analytics Industry REPORT HIGHLIGHTS
| Aspects | Details |
|---|---|
| Study Period | 2019-2033 |
| Base Year | 2024 |
| Estimated Year | 2025 |
| Forecast Period | 2025-2033 |
| Historical Period | 2019-2024 |
| Growth Rate | CAGR of 12.25% from 2019-2033 |
| Segmentation |
|
Table of Contents
- 1. Introduction
- 1.1. Research Scope
- 1.2. Market Segmentation
- 1.3. Research Methodology
- 1.4. Definitions and Assumptions
- 2. Executive Summary
- 2.1. Introduction
- 3. Market Dynamics
- 3.1. Introduction
- 3.2. Market Drivers
- 3.2.1. Advancement in BI and Business Analytics Tools; Growing Focus on Data Driven Financial Decisions in End Users
- 3.3. Market Restrains
- 3.3.1. Lack of Awareness Regarding Fraud Detection Solutions
- 3.4. Market Trends
- 3.4.1. Cloud Based Solutions are Expected to Gain Significant Traction
- 4. Market Factor Analysis
- 4.1. Porters Five Forces
- 4.2. Supply/Value Chain
- 4.3. PESTEL analysis
- 4.4. Market Entropy
- 4.5. Patent/Trademark Analysis
- 5. Global Financial Analytics Industry Analysis, Insights and Forecast, 2019-2031
- 5.1. Market Analysis, Insights and Forecast - by Deployment Type
- 5.1.1. On-premise
- 5.1.2. Cloud
- 5.2. Market Analysis, Insights and Forecast - by Solution Type
- 5.2.1. Database Management and Planning
- 5.2.2. Analysis and Reporting
- 5.2.3. Other Type
- 5.3. Market Analysis, Insights and Forecast - by End-user Vertical
- 5.3.1. BFSI
- 5.3.2. Healthcare
- 5.3.3. Manufacturing
- 5.3.4. Government
- 5.3.5. IT and Telecom
- 5.3.6. Other End-user Verticals
- 5.4. Market Analysis, Insights and Forecast - by Region
- 5.4.1. North America
- 5.4.2. Europe
- 5.4.3. Asia Pacific
- 5.4.4. Latin America
- 5.4.5. Middle East and Africa
- 5.1. Market Analysis, Insights and Forecast - by Deployment Type
- 6. North America Financial Analytics Industry Analysis, Insights and Forecast, 2019-2031
- 6.1. Market Analysis, Insights and Forecast - by Deployment Type
- 6.1.1. On-premise
- 6.1.2. Cloud
- 6.2. Market Analysis, Insights and Forecast - by Solution Type
- 6.2.1. Database Management and Planning
- 6.2.2. Analysis and Reporting
- 6.2.3. Other Type
- 6.3. Market Analysis, Insights and Forecast - by End-user Vertical
- 6.3.1. BFSI
- 6.3.2. Healthcare
- 6.3.3. Manufacturing
- 6.3.4. Government
- 6.3.5. IT and Telecom
- 6.3.6. Other End-user Verticals
- 6.1. Market Analysis, Insights and Forecast - by Deployment Type
- 7. Europe Financial Analytics Industry Analysis, Insights and Forecast, 2019-2031
- 7.1. Market Analysis, Insights and Forecast - by Deployment Type
- 7.1.1. On-premise
- 7.1.2. Cloud
- 7.2. Market Analysis, Insights and Forecast - by Solution Type
- 7.2.1. Database Management and Planning
- 7.2.2. Analysis and Reporting
- 7.2.3. Other Type
- 7.3. Market Analysis, Insights and Forecast - by End-user Vertical
- 7.3.1. BFSI
- 7.3.2. Healthcare
- 7.3.3. Manufacturing
- 7.3.4. Government
- 7.3.5. IT and Telecom
- 7.3.6. Other End-user Verticals
- 7.1. Market Analysis, Insights and Forecast - by Deployment Type
- 8. Asia Pacific Financial Analytics Industry Analysis, Insights and Forecast, 2019-2031
- 8.1. Market Analysis, Insights and Forecast - by Deployment Type
- 8.1.1. On-premise
- 8.1.2. Cloud
- 8.2. Market Analysis, Insights and Forecast - by Solution Type
- 8.2.1. Database Management and Planning
- 8.2.2. Analysis and Reporting
- 8.2.3. Other Type
- 8.3. Market Analysis, Insights and Forecast - by End-user Vertical
- 8.3.1. BFSI
- 8.3.2. Healthcare
- 8.3.3. Manufacturing
- 8.3.4. Government
- 8.3.5. IT and Telecom
- 8.3.6. Other End-user Verticals
- 8.1. Market Analysis, Insights and Forecast - by Deployment Type
- 9. Latin America Financial Analytics Industry Analysis, Insights and Forecast, 2019-2031
- 9.1. Market Analysis, Insights and Forecast - by Deployment Type
- 9.1.1. On-premise
- 9.1.2. Cloud
- 9.2. Market Analysis, Insights and Forecast - by Solution Type
- 9.2.1. Database Management and Planning
- 9.2.2. Analysis and Reporting
- 9.2.3. Other Type
- 9.3. Market Analysis, Insights and Forecast - by End-user Vertical
- 9.3.1. BFSI
- 9.3.2. Healthcare
- 9.3.3. Manufacturing
- 9.3.4. Government
- 9.3.5. IT and Telecom
- 9.3.6. Other End-user Verticals
- 9.1. Market Analysis, Insights and Forecast - by Deployment Type
- 10. Middle East and Africa Financial Analytics Industry Analysis, Insights and Forecast, 2019-2031
- 10.1. Market Analysis, Insights and Forecast - by Deployment Type
- 10.1.1. On-premise
- 10.1.2. Cloud
- 10.2. Market Analysis, Insights and Forecast - by Solution Type
- 10.2.1. Database Management and Planning
- 10.2.2. Analysis and Reporting
- 10.2.3. Other Type
- 10.3. Market Analysis, Insights and Forecast - by End-user Vertical
- 10.3.1. BFSI
- 10.3.2. Healthcare
- 10.3.3. Manufacturing
- 10.3.4. Government
- 10.3.5. IT and Telecom
- 10.3.6. Other End-user Verticals
- 10.1. Market Analysis, Insights and Forecast - by Deployment Type
- 11. North America Financial Analytics Industry Analysis, Insights and Forecast, 2019-2031
- 11.1. Market Analysis, Insights and Forecast - By Country/Sub-region
- 11.1.1 United States
- 11.1.2 Canada
- 11.1.3 Mexico
- 12. Europe Financial Analytics Industry Analysis, Insights and Forecast, 2019-2031
- 12.1. Market Analysis, Insights and Forecast - By Country/Sub-region
- 12.1.1 Germany
- 12.1.2 United Kingdom
- 12.1.3 France
- 12.1.4 Spain
- 12.1.5 Italy
- 12.1.6 Spain
- 12.1.7 Belgium
- 12.1.8 Netherland
- 12.1.9 Nordics
- 12.1.10 Rest of Europe
- 13. Asia Pacific Financial Analytics Industry Analysis, Insights and Forecast, 2019-2031
- 13.1. Market Analysis, Insights and Forecast - By Country/Sub-region
- 13.1.1 China
- 13.1.2 Japan
- 13.1.3 India
- 13.1.4 South Korea
- 13.1.5 Southeast Asia
- 13.1.6 Australia
- 13.1.7 Indonesia
- 13.1.8 Phillipes
- 13.1.9 Singapore
- 13.1.10 Thailandc
- 13.1.11 Rest of Asia Pacific
- 14. South America Financial Analytics Industry Analysis, Insights and Forecast, 2019-2031
- 14.1. Market Analysis, Insights and Forecast - By Country/Sub-region
- 14.1.1 Brazil
- 14.1.2 Argentina
- 14.1.3 Peru
- 14.1.4 Chile
- 14.1.5 Colombia
- 14.1.6 Ecuador
- 14.1.7 Venezuela
- 14.1.8 Rest of South America
- 15. North America Financial Analytics Industry Analysis, Insights and Forecast, 2019-2031
- 15.1. Market Analysis, Insights and Forecast - By Country/Sub-region
- 15.1.1 United States
- 15.1.2 Canada
- 15.1.3 Mexico
- 16. MEA Financial Analytics Industry Analysis, Insights and Forecast, 2019-2031
- 16.1. Market Analysis, Insights and Forecast - By Country/Sub-region
- 16.1.1 United Arab Emirates
- 16.1.2 Saudi Arabia
- 16.1.3 South Africa
- 16.1.4 Rest of Middle East and Africa
- 17. Competitive Analysis
- 17.1. Global Market Share Analysis 2024
- 17.2. Company Profiles
- 17.2.1 IBM Corporation
- 17.2.1.1. Overview
- 17.2.1.2. Products
- 17.2.1.3. SWOT Analysis
- 17.2.1.4. Recent Developments
- 17.2.1.5. Financials (Based on Availability)
- 17.2.2 Hitachi Vantara
- 17.2.2.1. Overview
- 17.2.2.2. Products
- 17.2.2.3. SWOT Analysis
- 17.2.2.4. Recent Developments
- 17.2.2.5. Financials (Based on Availability)
- 17.2.3 SAP SE
- 17.2.3.1. Overview
- 17.2.3.2. Products
- 17.2.3.3. SWOT Analysis
- 17.2.3.4. Recent Developments
- 17.2.3.5. Financials (Based on Availability)
- 17.2.4 Teradata Corporation
- 17.2.4.1. Overview
- 17.2.4.2. Products
- 17.2.4.3. SWOT Analysis
- 17.2.4.4. Recent Developments
- 17.2.4.5. Financials (Based on Availability)
- 17.2.5 Microsoft Corporation
- 17.2.5.1. Overview
- 17.2.5.2. Products
- 17.2.5.3. SWOT Analysis
- 17.2.5.4. Recent Developments
- 17.2.5.5. Financials (Based on Availability)
- 17.2.6 SAS Institute
- 17.2.6.1. Overview
- 17.2.6.2. Products
- 17.2.6.3. SWOT Analysis
- 17.2.6.4. Recent Developments
- 17.2.6.5. Financials (Based on Availability)
- 17.2.7 Oracle Corporation
- 17.2.7.1. Overview
- 17.2.7.2. Products
- 17.2.7.3. SWOT Analysis
- 17.2.7.4. Recent Developments
- 17.2.7.5. Financials (Based on Availability)
- 17.2.8 FICO
- 17.2.8.1. Overview
- 17.2.8.2. Products
- 17.2.8.3. SWOT Analysis
- 17.2.8.4. Recent Developments
- 17.2.8.5. Financials (Based on Availability)
- 17.2.1 IBM Corporation
List of Figures
- Figure 1: Global Financial Analytics Industry Revenue Breakdown (Million, %) by Region 2024 & 2032
- Figure 2: North America Financial Analytics Industry Revenue (Million), by Country 2024 & 2032
- Figure 3: North America Financial Analytics Industry Revenue Share (%), by Country 2024 & 2032
- Figure 4: Europe Financial Analytics Industry Revenue (Million), by Country 2024 & 2032
- Figure 5: Europe Financial Analytics Industry Revenue Share (%), by Country 2024 & 2032
- Figure 6: Asia Pacific Financial Analytics Industry Revenue (Million), by Country 2024 & 2032
- Figure 7: Asia Pacific Financial Analytics Industry Revenue Share (%), by Country 2024 & 2032
- Figure 8: South America Financial Analytics Industry Revenue (Million), by Country 2024 & 2032
- Figure 9: South America Financial Analytics Industry Revenue Share (%), by Country 2024 & 2032
- Figure 10: North America Financial Analytics Industry Revenue (Million), by Country 2024 & 2032
- Figure 11: North America Financial Analytics Industry Revenue Share (%), by Country 2024 & 2032
- Figure 12: MEA Financial Analytics Industry Revenue (Million), by Country 2024 & 2032
- Figure 13: MEA Financial Analytics Industry Revenue Share (%), by Country 2024 & 2032
- Figure 14: North America Financial Analytics Industry Revenue (Million), by Deployment Type 2024 & 2032
- Figure 15: North America Financial Analytics Industry Revenue Share (%), by Deployment Type 2024 & 2032
- Figure 16: North America Financial Analytics Industry Revenue (Million), by Solution Type 2024 & 2032
- Figure 17: North America Financial Analytics Industry Revenue Share (%), by Solution Type 2024 & 2032
- Figure 18: North America Financial Analytics Industry Revenue (Million), by End-user Vertical 2024 & 2032
- Figure 19: North America Financial Analytics Industry Revenue Share (%), by End-user Vertical 2024 & 2032
- Figure 20: North America Financial Analytics Industry Revenue (Million), by Country 2024 & 2032
- Figure 21: North America Financial Analytics Industry Revenue Share (%), by Country 2024 & 2032
- Figure 22: Europe Financial Analytics Industry Revenue (Million), by Deployment Type 2024 & 2032
- Figure 23: Europe Financial Analytics Industry Revenue Share (%), by Deployment Type 2024 & 2032
- Figure 24: Europe Financial Analytics Industry Revenue (Million), by Solution Type 2024 & 2032
- Figure 25: Europe Financial Analytics Industry Revenue Share (%), by Solution Type 2024 & 2032
- Figure 26: Europe Financial Analytics Industry Revenue (Million), by End-user Vertical 2024 & 2032
- Figure 27: Europe Financial Analytics Industry Revenue Share (%), by End-user Vertical 2024 & 2032
- Figure 28: Europe Financial Analytics Industry Revenue (Million), by Country 2024 & 2032
- Figure 29: Europe Financial Analytics Industry Revenue Share (%), by Country 2024 & 2032
- Figure 30: Asia Pacific Financial Analytics Industry Revenue (Million), by Deployment Type 2024 & 2032
- Figure 31: Asia Pacific Financial Analytics Industry Revenue Share (%), by Deployment Type 2024 & 2032
- Figure 32: Asia Pacific Financial Analytics Industry Revenue (Million), by Solution Type 2024 & 2032
- Figure 33: Asia Pacific Financial Analytics Industry Revenue Share (%), by Solution Type 2024 & 2032
- Figure 34: Asia Pacific Financial Analytics Industry Revenue (Million), by End-user Vertical 2024 & 2032
- Figure 35: Asia Pacific Financial Analytics Industry Revenue Share (%), by End-user Vertical 2024 & 2032
- Figure 36: Asia Pacific Financial Analytics Industry Revenue (Million), by Country 2024 & 2032
- Figure 37: Asia Pacific Financial Analytics Industry Revenue Share (%), by Country 2024 & 2032
- Figure 38: Latin America Financial Analytics Industry Revenue (Million), by Deployment Type 2024 & 2032
- Figure 39: Latin America Financial Analytics Industry Revenue Share (%), by Deployment Type 2024 & 2032
- Figure 40: Latin America Financial Analytics Industry Revenue (Million), by Solution Type 2024 & 2032
- Figure 41: Latin America Financial Analytics Industry Revenue Share (%), by Solution Type 2024 & 2032
- Figure 42: Latin America Financial Analytics Industry Revenue (Million), by End-user Vertical 2024 & 2032
- Figure 43: Latin America Financial Analytics Industry Revenue Share (%), by End-user Vertical 2024 & 2032
- Figure 44: Latin America Financial Analytics Industry Revenue (Million), by Country 2024 & 2032
- Figure 45: Latin America Financial Analytics Industry Revenue Share (%), by Country 2024 & 2032
- Figure 46: Middle East and Africa Financial Analytics Industry Revenue (Million), by Deployment Type 2024 & 2032
- Figure 47: Middle East and Africa Financial Analytics Industry Revenue Share (%), by Deployment Type 2024 & 2032
- Figure 48: Middle East and Africa Financial Analytics Industry Revenue (Million), by Solution Type 2024 & 2032
- Figure 49: Middle East and Africa Financial Analytics Industry Revenue Share (%), by Solution Type 2024 & 2032
- Figure 50: Middle East and Africa Financial Analytics Industry Revenue (Million), by End-user Vertical 2024 & 2032
- Figure 51: Middle East and Africa Financial Analytics Industry Revenue Share (%), by End-user Vertical 2024 & 2032
- Figure 52: Middle East and Africa Financial Analytics Industry Revenue (Million), by Country 2024 & 2032
- Figure 53: Middle East and Africa Financial Analytics Industry Revenue Share (%), by Country 2024 & 2032
List of Tables
- Table 1: Global Financial Analytics Industry Revenue Million Forecast, by Region 2019 & 2032
- Table 2: Global Financial Analytics Industry Revenue Million Forecast, by Deployment Type 2019 & 2032
- Table 3: Global Financial Analytics Industry Revenue Million Forecast, by Solution Type 2019 & 2032
- Table 4: Global Financial Analytics Industry Revenue Million Forecast, by End-user Vertical 2019 & 2032
- Table 5: Global Financial Analytics Industry Revenue Million Forecast, by Region 2019 & 2032
- Table 6: Global Financial Analytics Industry Revenue Million Forecast, by Country 2019 & 2032
- Table 7: United States Financial Analytics Industry Revenue (Million) Forecast, by Application 2019 & 2032
- Table 8: Canada Financial Analytics Industry Revenue (Million) Forecast, by Application 2019 & 2032
- Table 9: Mexico Financial Analytics Industry Revenue (Million) Forecast, by Application 2019 & 2032
- Table 10: Global Financial Analytics Industry Revenue Million Forecast, by Country 2019 & 2032
- Table 11: Germany Financial Analytics Industry Revenue (Million) Forecast, by Application 2019 & 2032
- Table 12: United Kingdom Financial Analytics Industry Revenue (Million) Forecast, by Application 2019 & 2032
- Table 13: France Financial Analytics Industry Revenue (Million) Forecast, by Application 2019 & 2032
- Table 14: Spain Financial Analytics Industry Revenue (Million) Forecast, by Application 2019 & 2032
- Table 15: Italy Financial Analytics Industry Revenue (Million) Forecast, by Application 2019 & 2032
- Table 16: Spain Financial Analytics Industry Revenue (Million) Forecast, by Application 2019 & 2032
- Table 17: Belgium Financial Analytics Industry Revenue (Million) Forecast, by Application 2019 & 2032
- Table 18: Netherland Financial Analytics Industry Revenue (Million) Forecast, by Application 2019 & 2032
- Table 19: Nordics Financial Analytics Industry Revenue (Million) Forecast, by Application 2019 & 2032
- Table 20: Rest of Europe Financial Analytics Industry Revenue (Million) Forecast, by Application 2019 & 2032
- Table 21: Global Financial Analytics Industry Revenue Million Forecast, by Country 2019 & 2032
- Table 22: China Financial Analytics Industry Revenue (Million) Forecast, by Application 2019 & 2032
- Table 23: Japan Financial Analytics Industry Revenue (Million) Forecast, by Application 2019 & 2032
- Table 24: India Financial Analytics Industry Revenue (Million) Forecast, by Application 2019 & 2032
- Table 25: South Korea Financial Analytics Industry Revenue (Million) Forecast, by Application 2019 & 2032
- Table 26: Southeast Asia Financial Analytics Industry Revenue (Million) Forecast, by Application 2019 & 2032
- Table 27: Australia Financial Analytics Industry Revenue (Million) Forecast, by Application 2019 & 2032
- Table 28: Indonesia Financial Analytics Industry Revenue (Million) Forecast, by Application 2019 & 2032
- Table 29: Phillipes Financial Analytics Industry Revenue (Million) Forecast, by Application 2019 & 2032
- Table 30: Singapore Financial Analytics Industry Revenue (Million) Forecast, by Application 2019 & 2032
- Table 31: Thailandc Financial Analytics Industry Revenue (Million) Forecast, by Application 2019 & 2032
- Table 32: Rest of Asia Pacific Financial Analytics Industry Revenue (Million) Forecast, by Application 2019 & 2032
- Table 33: Global Financial Analytics Industry Revenue Million Forecast, by Country 2019 & 2032
- Table 34: Brazil Financial Analytics Industry Revenue (Million) Forecast, by Application 2019 & 2032
- Table 35: Argentina Financial Analytics Industry Revenue (Million) Forecast, by Application 2019 & 2032
- Table 36: Peru Financial Analytics Industry Revenue (Million) Forecast, by Application 2019 & 2032
- Table 37: Chile Financial Analytics Industry Revenue (Million) Forecast, by Application 2019 & 2032
- Table 38: Colombia Financial Analytics Industry Revenue (Million) Forecast, by Application 2019 & 2032
- Table 39: Ecuador Financial Analytics Industry Revenue (Million) Forecast, by Application 2019 & 2032
- Table 40: Venezuela Financial Analytics Industry Revenue (Million) Forecast, by Application 2019 & 2032
- Table 41: Rest of South America Financial Analytics Industry Revenue (Million) Forecast, by Application 2019 & 2032
- Table 42: Global Financial Analytics Industry Revenue Million Forecast, by Country 2019 & 2032
- Table 43: United States Financial Analytics Industry Revenue (Million) Forecast, by Application 2019 & 2032
- Table 44: Canada Financial Analytics Industry Revenue (Million) Forecast, by Application 2019 & 2032
- Table 45: Mexico Financial Analytics Industry Revenue (Million) Forecast, by Application 2019 & 2032
- Table 46: Global Financial Analytics Industry Revenue Million Forecast, by Country 2019 & 2032
- Table 47: United Arab Emirates Financial Analytics Industry Revenue (Million) Forecast, by Application 2019 & 2032
- Table 48: Saudi Arabia Financial Analytics Industry Revenue (Million) Forecast, by Application 2019 & 2032
- Table 49: South Africa Financial Analytics Industry Revenue (Million) Forecast, by Application 2019 & 2032
- Table 50: Rest of Middle East and Africa Financial Analytics Industry Revenue (Million) Forecast, by Application 2019 & 2032
- Table 51: Global Financial Analytics Industry Revenue Million Forecast, by Deployment Type 2019 & 2032
- Table 52: Global Financial Analytics Industry Revenue Million Forecast, by Solution Type 2019 & 2032
- Table 53: Global Financial Analytics Industry Revenue Million Forecast, by End-user Vertical 2019 & 2032
- Table 54: Global Financial Analytics Industry Revenue Million Forecast, by Country 2019 & 2032
- Table 55: United States Financial Analytics Industry Revenue (Million) Forecast, by Application 2019 & 2032
- Table 56: Canada Financial Analytics Industry Revenue (Million) Forecast, by Application 2019 & 2032
- Table 57: Global Financial Analytics Industry Revenue Million Forecast, by Deployment Type 2019 & 2032
- Table 58: Global Financial Analytics Industry Revenue Million Forecast, by Solution Type 2019 & 2032
- Table 59: Global Financial Analytics Industry Revenue Million Forecast, by End-user Vertical 2019 & 2032
- Table 60: Global Financial Analytics Industry Revenue Million Forecast, by Country 2019 & 2032
- Table 61: United Kingdom Financial Analytics Industry Revenue (Million) Forecast, by Application 2019 & 2032
- Table 62: Germany Financial Analytics Industry Revenue (Million) Forecast, by Application 2019 & 2032
- Table 63: France Financial Analytics Industry Revenue (Million) Forecast, by Application 2019 & 2032
- Table 64: Rest of Europe Financial Analytics Industry Revenue (Million) Forecast, by Application 2019 & 2032
- Table 65: Global Financial Analytics Industry Revenue Million Forecast, by Deployment Type 2019 & 2032
- Table 66: Global Financial Analytics Industry Revenue Million Forecast, by Solution Type 2019 & 2032
- Table 67: Global Financial Analytics Industry Revenue Million Forecast, by End-user Vertical 2019 & 2032
- Table 68: Global Financial Analytics Industry Revenue Million Forecast, by Country 2019 & 2032
- Table 69: China Financial Analytics Industry Revenue (Million) Forecast, by Application 2019 & 2032
- Table 70: Japan Financial Analytics Industry Revenue (Million) Forecast, by Application 2019 & 2032
- Table 71: Singapore Financial Analytics Industry Revenue (Million) Forecast, by Application 2019 & 2032
- Table 72: India Financial Analytics Industry Revenue (Million) Forecast, by Application 2019 & 2032
- Table 73: South Korea Financial Analytics Industry Revenue (Million) Forecast, by Application 2019 & 2032
- Table 74: Rest of Asia Pacific Financial Analytics Industry Revenue (Million) Forecast, by Application 2019 & 2032
- Table 75: Global Financial Analytics Industry Revenue Million Forecast, by Deployment Type 2019 & 2032
- Table 76: Global Financial Analytics Industry Revenue Million Forecast, by Solution Type 2019 & 2032
- Table 77: Global Financial Analytics Industry Revenue Million Forecast, by End-user Vertical 2019 & 2032
- Table 78: Global Financial Analytics Industry Revenue Million Forecast, by Country 2019 & 2032
- Table 79: Mexico Financial Analytics Industry Revenue (Million) Forecast, by Application 2019 & 2032
- Table 80: Brazil Financial Analytics Industry Revenue (Million) Forecast, by Application 2019 & 2032
- Table 81: Rest of Latin America Financial Analytics Industry Revenue (Million) Forecast, by Application 2019 & 2032
- Table 82: Global Financial Analytics Industry Revenue Million Forecast, by Deployment Type 2019 & 2032
- Table 83: Global Financial Analytics Industry Revenue Million Forecast, by Solution Type 2019 & 2032
- Table 84: Global Financial Analytics Industry Revenue Million Forecast, by End-user Vertical 2019 & 2032
- Table 85: Global Financial Analytics Industry Revenue Million Forecast, by Country 2019 & 2032
- Table 86: United Arab Emirates Financial Analytics Industry Revenue (Million) Forecast, by Application 2019 & 2032
- Table 87: South Africa Financial Analytics Industry Revenue (Million) Forecast, by Application 2019 & 2032
- Table 88: Rest of Middle East and Africa Financial Analytics Industry Revenue (Million) Forecast, by Application 2019 & 2032
Frequently Asked Questions
1. What is the projected Compound Annual Growth Rate (CAGR) of the Financial Analytics Industry?
The projected CAGR is approximately 12.25%.
2. Which companies are prominent players in the Financial Analytics Industry?
Key companies in the market include IBM Corporation, Hitachi Vantara, SAP SE, Teradata Corporation, Microsoft Corporation, SAS Institute, Oracle Corporation, FICO.
3. What are the main segments of the Financial Analytics Industry?
The market segments include Deployment Type, Solution Type, End-user Vertical.
4. Can you provide details about the market size?
The market size is estimated to be USD 10.83 Million as of 2022.
5. What are some drivers contributing to market growth?
Advancement in BI and Business Analytics Tools; Growing Focus on Data Driven Financial Decisions in End Users.
6. What are the notable trends driving market growth?
Cloud Based Solutions are Expected to Gain Significant Traction.
7. Are there any restraints impacting market growth?
Lack of Awareness Regarding Fraud Detection Solutions.
8. Can you provide examples of recent developments in the market?
July 2023 - Dobin, an AI-powered FinTech solution, announced its launch. Dobin is the first Southeast Asian company to use open finance and advanced data analytics to give users a single view of their finances, create unique anonymized customer insights, and empower users to get value from their financial data.
9. What pricing options are available for accessing the report?
Pricing options include single-user, multi-user, and enterprise licenses priced at USD 4750, USD 5250, and USD 8750 respectively.
10. Is the market size provided in terms of value or volume?
The market size is provided in terms of value, measured in Million.
11. Are there any specific market keywords associated with the report?
Yes, the market keyword associated with the report is "Financial Analytics Industry," which aids in identifying and referencing the specific market segment covered.
12. How do I determine which pricing option suits my needs best?
The pricing options vary based on user requirements and access needs. Individual users may opt for single-user licenses, while businesses requiring broader access may choose multi-user or enterprise licenses for cost-effective access to the report.
13. Are there any additional resources or data provided in the Financial Analytics Industry report?
While the report offers comprehensive insights, it's advisable to review the specific contents or supplementary materials provided to ascertain if additional resources or data are available.
14. How can I stay updated on further developments or reports in the Financial Analytics Industry?
To stay informed about further developments, trends, and reports in the Financial Analytics Industry, consider subscribing to industry newsletters, following relevant companies and organizations, or regularly checking reputable industry news sources and publications.
Methodology
Step 1 - Identification of Relevant Samples Size from Population Database


Step 2 - Approaches for Defining Global Market Size (Value, Volume* & Price*)

Note*: In applicable scenarios
Step 3 - Data Sources
Primary Research
- Web Analytics
- Survey Reports
- Research Institute
- Latest Research Reports
- Opinion Leaders
Secondary Research
- Annual Reports
- White Paper
- Latest Press Release
- Industry Association
- Paid Database
- Investor Presentations

Step 4 - Data Triangulation
Involves using different sources of information in order to increase the validity of a study
These sources are likely to be stakeholders in a program - participants, other researchers, program staff, other community members, and so on.
Then we put all data in single framework & apply various statistical tools to find out the dynamic on the market.
During the analysis stage, feedback from the stakeholder groups would be compared to determine areas of agreement as well as areas of divergence
