

Key Insights
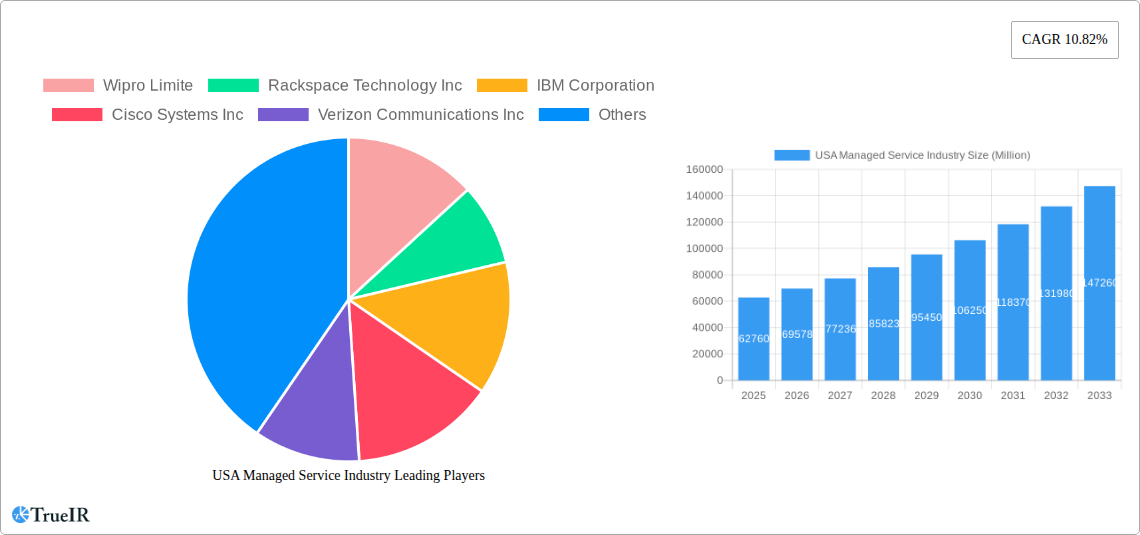
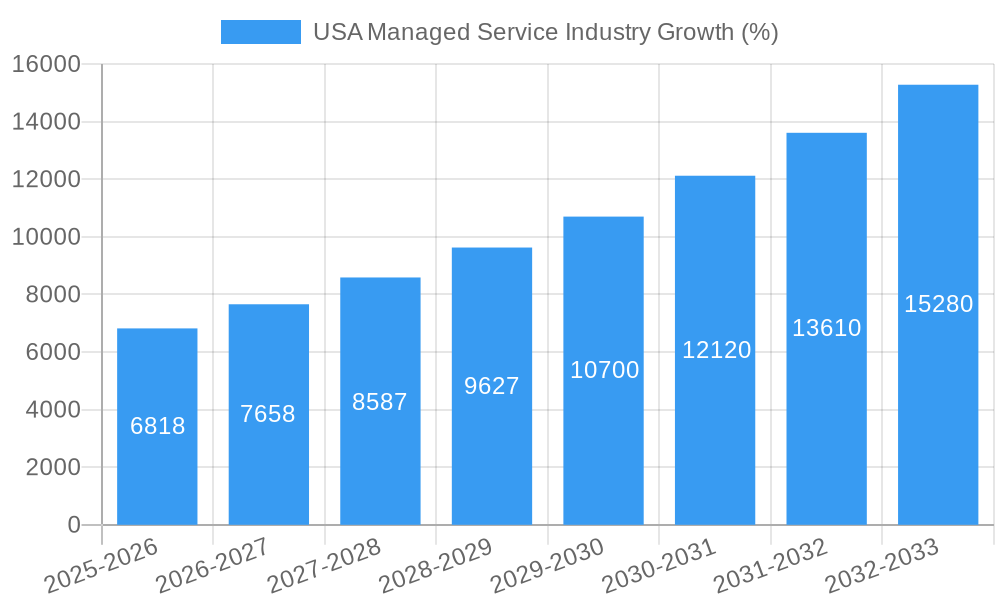
The US managed services market, valued at $62.76 billion in 2025, is experiencing robust growth, projected to expand at a compound annual growth rate (CAGR) of 10.82% from 2025 to 2033. This significant expansion is driven by several key factors. Increasing adoption of cloud computing necessitates reliable managed services for security, infrastructure, and network management. The growing complexity of IT infrastructures, particularly for large enterprises and across diverse sectors like BFSI (Banking, Financial Services, and Insurance), IT and Telecom, and Healthcare, fuels the demand for expert managed services providers to optimize performance and minimize operational risks. Furthermore, the escalating cyber-threat landscape is pushing organizations to outsource security management to specialized firms, boosting the Managed Security segment's growth within the market. The preference for flexible, scalable solutions like cloud-based managed services is another prominent trend contributing to market expansion. While some restraints may exist, such as concerns about vendor lock-in or data security with third-party providers, the overall market trajectory remains strongly positive.
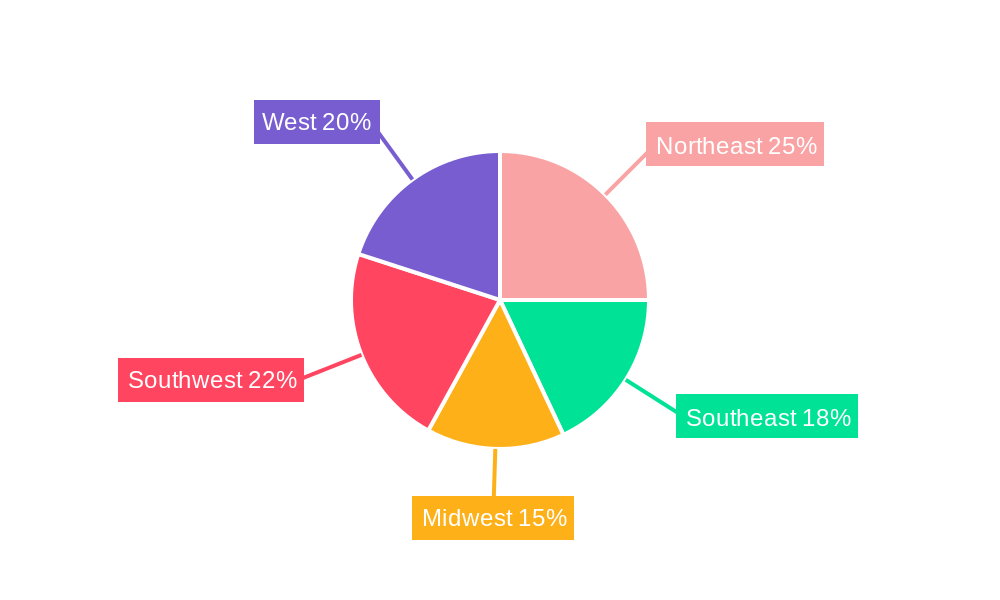
The market is segmented by deployment (on-premise and cloud), service type (managed data center, security, communications, network, infrastructure, mobility), enterprise size (SMEs and large enterprises), and end-user vertical. The cloud segment is expected to dominate due to its inherent scalability, cost-effectiveness, and accessibility. Large enterprises are a key driver, demanding comprehensive managed service solutions across multiple aspects of their IT operations. Geographically, the US market is further divided into Northeast, Southeast, Midwest, Southwest, and West regions, with the Northeast and West Coast likely demonstrating higher growth due to the concentration of technology hubs and large enterprises. Major players like Wipro, Rackspace, IBM, Cisco, Verizon, Microsoft, HP, Fujitsu, TCS, Dell, AT&T, and Citrix are actively competing in this dynamic market, constantly innovating and expanding their service portfolios to meet evolving customer needs and capitalize on emerging technological advancements.
USA Managed Service Industry Market Report: 2019-2033
This comprehensive report provides a detailed analysis of the USA Managed Service Industry, offering invaluable insights for businesses, investors, and industry stakeholders. The report covers market size and growth projections, competitive landscapes, segment performance, and key industry developments, utilizing data from the historical period (2019-2024), base year (2025), and forecast period (2025-2033). The study period spans 2019-2033, offering a long-term perspective on industry trends. The estimated market size in 2025 is projected to be $XX Million.
USA Managed Service Industry Market Structure & Competitive Landscape
The USA Managed Service Industry is characterized by a moderately concentrated market structure, with several multinational corporations holding significant market share. The Herfindahl-Hirschman Index (HHI) for the industry is estimated at XX, indicating a moderately competitive landscape. Innovation is a key driver, with companies continually developing new offerings in areas such as cloud-managed services and AI-powered security solutions. Regulatory changes, particularly concerning data privacy and cybersecurity, significantly influence market dynamics. Product substitution is also a factor, with companies offering increasingly integrated and comprehensive solutions. Mergers and acquisitions (M&A) activity is relatively high, reflecting the industry’s consolidation trend. The total value of M&A transactions within the period 2019-2024 is estimated at $XX Million.
- Market Concentration: Moderately concentrated, with HHI at XX.
- Innovation Drivers: Cloud computing, AI, automation, enhanced security.
- Regulatory Impacts: Data privacy regulations (e.g., CCPA, GDPR), cybersecurity standards.
- Product Substitutes: In-house IT departments, specialized service providers.
- End-User Segmentation: BFSI, IT & Telecom, Healthcare, Retail, Manufacturing, Government.
- M&A Trends: High levels of M&A activity, driving consolidation. 2019-2024 saw $XX Million in M&A transactions.
USA Managed Service Industry Market Trends & Opportunities
The USA Managed Service Industry is experiencing robust growth, driven by several key factors. The market is projected to expand at a Compound Annual Growth Rate (CAGR) of XX% during the forecast period (2025-2033). This growth is fueled by the increasing adoption of cloud technologies, the rising demand for enhanced cybersecurity measures, and the growing need for efficient IT infrastructure management across various industries. The market penetration rate of managed services is expected to reach XX% by 2033. Technological advancements, such as AI-powered automation and the Internet of Things (IoT), are transforming the industry. Consumer preferences are shifting towards flexible and scalable managed services. Intense competition compels providers to continually innovate and optimize their offerings. The shift towards hybrid and multi-cloud environments presents significant opportunities for market expansion.
Dominant Markets & Segments in USA Managed Service Industry
The Cloud segment is the dominant deployment model, driven by scalability, cost-effectiveness, and accessibility. Within service types, Managed Security and Managed Cloud services demonstrate the fastest growth. Large Enterprises represent the most significant market segment by enterprise size, due to their greater IT budgets and complex needs. The BFSI (Banking, Financial Services, and Insurance) sector is a leading end-user vertical, followed closely by the IT and Telecom sectors.
- By Deployment: Cloud dominates, followed by On-premise. Growth drivers include cloud adoption and hybrid cloud strategies.
- By Type: Managed Security and Managed Cloud demonstrate the fastest growth. Drivers include heightened cybersecurity threats and increased cloud adoption.
- By Enterprise Size: Large Enterprises are the dominant segment, fueled by larger IT budgets and complex infrastructure. SMEs are showing steady growth, driven by the need for cost-effective IT solutions.
- By End-user Vertical: BFSI and IT & Telecom are leading verticals, driven by stringent regulatory requirements and the need for reliable infrastructure. Growth in Healthcare and Retail sectors is driven by digital transformation initiatives and data security concerns.
USA Managed Service Industry Product Analysis
Product innovation is centered around enhanced automation, AI-driven analytics, and improved security features. Managed services are increasingly integrated, offering comprehensive solutions that address diverse IT needs. Competitive advantages are derived from advanced technological capabilities, strong customer support, and robust service level agreements.
Key Drivers, Barriers & Challenges in USA Managed Service Industry
Key Drivers: Increased adoption of cloud computing, heightened cybersecurity concerns, growing demand for efficient IT infrastructure management, and the rise of AI-powered solutions. The increasing complexity of IT infrastructure drives demand for outsourced expertise, creating a strong impetus for growth.
Key Challenges: Intense competition, skilled labor shortages, evolving cybersecurity threats, and the need for continuous innovation to remain competitive. Supply chain disruptions impacting the availability of critical hardware and software components can lead to project delays and increased costs.
Growth Drivers in the USA Managed Service Industry Market
Growth is propelled by rising cloud adoption, heightened security concerns, and the need for optimized IT infrastructure management, resulting in an estimated $XX Million market size in 2025. Government initiatives promoting digital transformation further fuel market expansion.
Challenges Impacting USA Managed Service Industry Growth
Competition, especially from global players, places downward pressure on pricing. Skilled labor shortages create challenges in service delivery. Rapid technological changes necessitate continuous investment in training and infrastructure upgrades. These factors present significant hurdles to growth.
Key Players Shaping the USA Managed Service Industry Market
- Wipro Limited
- Rackspace Technology Inc
- IBM Corporation
- Cisco Systems Inc
- Verizon Communications Inc
- Microsoft Corporation
- HP Inc
- Fujitsu Limited
- Tata Consultancy Services Limited
- Dell Technologies Inc
- AT&T Inc
- Citrix Systems Inc
Significant USA Managed Service Industry Industry Milestones
- October 2023: Rackspace Technology launched Rackspace Managed Cloud (RMC), a comprehensive cloud management service.
- August 2023: Verizon Business partnered with HCLTech for global Managed Network Services (MNS), enhancing wireline service delivery.
Future Outlook for USA Managed Service Industry Market
The USA Managed Service Industry is poised for continued growth, driven by ongoing digital transformation and the increasing adoption of cloud and AI-powered solutions. Strategic partnerships and investments in R&D will be crucial for maintaining competitiveness. The market presents significant opportunities for companies offering innovative, secure, and scalable managed services.
USA Managed Service Industry Segmentation
-
1. Deployment
- 1.1. On-premise
- 1.2. Cloud
-
2. Type
- 2.1. Managed Data Center
- 2.2. Managed Security
- 2.3. Managed Communications
- 2.4. Managed Network
- 2.5. Managed Infrastructure
- 2.6. Managed Mobility
-
3. Enterprise Size
- 3.1. Small and Medium Enterprises
- 3.2. Large Enterprises
-
4. End-user Vertical
- 4.1. BFSI
- 4.2. IT and Telecom
- 4.3. Healthcare
- 4.4. Entertainment and Media
- 4.5. Retail
- 4.6. Manufacturing
- 4.7. Government
- 4.8. Other End-user Verticals
USA Managed Service Industry Segmentation By Geography
-
1. North America
- 1.1. United States
- 1.2. Canada
- 1.3. Mexico
-
2. South America
- 2.1. Brazil
- 2.2. Argentina
- 2.3. Rest of South America
-
3. Europe
- 3.1. United Kingdom
- 3.2. Germany
- 3.3. France
- 3.4. Italy
- 3.5. Spain
- 3.6. Russia
- 3.7. Benelux
- 3.8. Nordics
- 3.9. Rest of Europe
-
4. Middle East & Africa
- 4.1. Turkey
- 4.2. Israel
- 4.3. GCC
- 4.4. North Africa
- 4.5. South Africa
- 4.6. Rest of Middle East & Africa
-
5. Asia Pacific
- 5.1. China
- 5.2. India
- 5.3. Japan
- 5.4. South Korea
- 5.5. ASEAN
- 5.6. Oceania
- 5.7. Rest of Asia Pacific
USA Managed Service Industry REPORT HIGHLIGHTS
| Aspects | Details |
|---|---|
| Study Period | 2019-2033 |
| Base Year | 2024 |
| Estimated Year | 2025 |
| Forecast Period | 2025-2033 |
| Historical Period | 2019-2024 |
| Growth Rate | CAGR of 10.82% from 2019-2033 |
| Segmentation |
|
Table of Contents
- 1. Introduction
- 1.1. Research Scope
- 1.2. Market Segmentation
- 1.3. Research Methodology
- 1.4. Definitions and Assumptions
- 2. Executive Summary
- 2.1. Introduction
- 3. Market Dynamics
- 3.1. Introduction
- 3.2. Market Drivers
- 3.2.1. Increasing Shift to Hybrid IT; Improved Cost and Operational Efficiency
- 3.3. Market Restrains
- 3.3.1 High Risk of Radiation Since it uses Gamma Rays
- 3.3.2 X-Rays; High Deployment Costs
- 3.4. Market Trends
- 3.4.1. Cloud to Witness Significant Growth
- 4. Market Factor Analysis
- 4.1. Porters Five Forces
- 4.2. Supply/Value Chain
- 4.3. PESTEL analysis
- 4.4. Market Entropy
- 4.5. Patent/Trademark Analysis
- 5. Global USA Managed Service Industry Analysis, Insights and Forecast, 2019-2031
- 5.1. Market Analysis, Insights and Forecast - by Deployment
- 5.1.1. On-premise
- 5.1.2. Cloud
- 5.2. Market Analysis, Insights and Forecast - by Type
- 5.2.1. Managed Data Center
- 5.2.2. Managed Security
- 5.2.3. Managed Communications
- 5.2.4. Managed Network
- 5.2.5. Managed Infrastructure
- 5.2.6. Managed Mobility
- 5.3. Market Analysis, Insights and Forecast - by Enterprise Size
- 5.3.1. Small and Medium Enterprises
- 5.3.2. Large Enterprises
- 5.4. Market Analysis, Insights and Forecast - by End-user Vertical
- 5.4.1. BFSI
- 5.4.2. IT and Telecom
- 5.4.3. Healthcare
- 5.4.4. Entertainment and Media
- 5.4.5. Retail
- 5.4.6. Manufacturing
- 5.4.7. Government
- 5.4.8. Other End-user Verticals
- 5.5. Market Analysis, Insights and Forecast - by Region
- 5.5.1. North America
- 5.5.2. South America
- 5.5.3. Europe
- 5.5.4. Middle East & Africa
- 5.5.5. Asia Pacific
- 5.1. Market Analysis, Insights and Forecast - by Deployment
- 6. North America USA Managed Service Industry Analysis, Insights and Forecast, 2019-2031
- 6.1. Market Analysis, Insights and Forecast - by Deployment
- 6.1.1. On-premise
- 6.1.2. Cloud
- 6.2. Market Analysis, Insights and Forecast - by Type
- 6.2.1. Managed Data Center
- 6.2.2. Managed Security
- 6.2.3. Managed Communications
- 6.2.4. Managed Network
- 6.2.5. Managed Infrastructure
- 6.2.6. Managed Mobility
- 6.3. Market Analysis, Insights and Forecast - by Enterprise Size
- 6.3.1. Small and Medium Enterprises
- 6.3.2. Large Enterprises
- 6.4. Market Analysis, Insights and Forecast - by End-user Vertical
- 6.4.1. BFSI
- 6.4.2. IT and Telecom
- 6.4.3. Healthcare
- 6.4.4. Entertainment and Media
- 6.4.5. Retail
- 6.4.6. Manufacturing
- 6.4.7. Government
- 6.4.8. Other End-user Verticals
- 6.1. Market Analysis, Insights and Forecast - by Deployment
- 7. South America USA Managed Service Industry Analysis, Insights and Forecast, 2019-2031
- 7.1. Market Analysis, Insights and Forecast - by Deployment
- 7.1.1. On-premise
- 7.1.2. Cloud
- 7.2. Market Analysis, Insights and Forecast - by Type
- 7.2.1. Managed Data Center
- 7.2.2. Managed Security
- 7.2.3. Managed Communications
- 7.2.4. Managed Network
- 7.2.5. Managed Infrastructure
- 7.2.6. Managed Mobility
- 7.3. Market Analysis, Insights and Forecast - by Enterprise Size
- 7.3.1. Small and Medium Enterprises
- 7.3.2. Large Enterprises
- 7.4. Market Analysis, Insights and Forecast - by End-user Vertical
- 7.4.1. BFSI
- 7.4.2. IT and Telecom
- 7.4.3. Healthcare
- 7.4.4. Entertainment and Media
- 7.4.5. Retail
- 7.4.6. Manufacturing
- 7.4.7. Government
- 7.4.8. Other End-user Verticals
- 7.1. Market Analysis, Insights and Forecast - by Deployment
- 8. Europe USA Managed Service Industry Analysis, Insights and Forecast, 2019-2031
- 8.1. Market Analysis, Insights and Forecast - by Deployment
- 8.1.1. On-premise
- 8.1.2. Cloud
- 8.2. Market Analysis, Insights and Forecast - by Type
- 8.2.1. Managed Data Center
- 8.2.2. Managed Security
- 8.2.3. Managed Communications
- 8.2.4. Managed Network
- 8.2.5. Managed Infrastructure
- 8.2.6. Managed Mobility
- 8.3. Market Analysis, Insights and Forecast - by Enterprise Size
- 8.3.1. Small and Medium Enterprises
- 8.3.2. Large Enterprises
- 8.4. Market Analysis, Insights and Forecast - by End-user Vertical
- 8.4.1. BFSI
- 8.4.2. IT and Telecom
- 8.4.3. Healthcare
- 8.4.4. Entertainment and Media
- 8.4.5. Retail
- 8.4.6. Manufacturing
- 8.4.7. Government
- 8.4.8. Other End-user Verticals
- 8.1. Market Analysis, Insights and Forecast - by Deployment
- 9. Middle East & Africa USA Managed Service Industry Analysis, Insights and Forecast, 2019-2031
- 9.1. Market Analysis, Insights and Forecast - by Deployment
- 9.1.1. On-premise
- 9.1.2. Cloud
- 9.2. Market Analysis, Insights and Forecast - by Type
- 9.2.1. Managed Data Center
- 9.2.2. Managed Security
- 9.2.3. Managed Communications
- 9.2.4. Managed Network
- 9.2.5. Managed Infrastructure
- 9.2.6. Managed Mobility
- 9.3. Market Analysis, Insights and Forecast - by Enterprise Size
- 9.3.1. Small and Medium Enterprises
- 9.3.2. Large Enterprises
- 9.4. Market Analysis, Insights and Forecast - by End-user Vertical
- 9.4.1. BFSI
- 9.4.2. IT and Telecom
- 9.4.3. Healthcare
- 9.4.4. Entertainment and Media
- 9.4.5. Retail
- 9.4.6. Manufacturing
- 9.4.7. Government
- 9.4.8. Other End-user Verticals
- 9.1. Market Analysis, Insights and Forecast - by Deployment
- 10. Asia Pacific USA Managed Service Industry Analysis, Insights and Forecast, 2019-2031
- 10.1. Market Analysis, Insights and Forecast - by Deployment
- 10.1.1. On-premise
- 10.1.2. Cloud
- 10.2. Market Analysis, Insights and Forecast - by Type
- 10.2.1. Managed Data Center
- 10.2.2. Managed Security
- 10.2.3. Managed Communications
- 10.2.4. Managed Network
- 10.2.5. Managed Infrastructure
- 10.2.6. Managed Mobility
- 10.3. Market Analysis, Insights and Forecast - by Enterprise Size
- 10.3.1. Small and Medium Enterprises
- 10.3.2. Large Enterprises
- 10.4. Market Analysis, Insights and Forecast - by End-user Vertical
- 10.4.1. BFSI
- 10.4.2. IT and Telecom
- 10.4.3. Healthcare
- 10.4.4. Entertainment and Media
- 10.4.5. Retail
- 10.4.6. Manufacturing
- 10.4.7. Government
- 10.4.8. Other End-user Verticals
- 10.1. Market Analysis, Insights and Forecast - by Deployment
- 11. Northeast USA Managed Service Industry Analysis, Insights and Forecast, 2019-2031
- 12. Southeast USA Managed Service Industry Analysis, Insights and Forecast, 2019-2031
- 13. Midwest USA Managed Service Industry Analysis, Insights and Forecast, 2019-2031
- 14. Southwest USA Managed Service Industry Analysis, Insights and Forecast, 2019-2031
- 15. West USA Managed Service Industry Analysis, Insights and Forecast, 2019-2031
- 16. Competitive Analysis
- 16.1. Global Market Share Analysis 2024
- 16.2. Company Profiles
- 16.2.1 Wipro Limite
- 16.2.1.1. Overview
- 16.2.1.2. Products
- 16.2.1.3. SWOT Analysis
- 16.2.1.4. Recent Developments
- 16.2.1.5. Financials (Based on Availability)
- 16.2.2 Rackspace Technology Inc
- 16.2.2.1. Overview
- 16.2.2.2. Products
- 16.2.2.3. SWOT Analysis
- 16.2.2.4. Recent Developments
- 16.2.2.5. Financials (Based on Availability)
- 16.2.3 IBM Corporation
- 16.2.3.1. Overview
- 16.2.3.2. Products
- 16.2.3.3. SWOT Analysis
- 16.2.3.4. Recent Developments
- 16.2.3.5. Financials (Based on Availability)
- 16.2.4 Cisco Systems Inc
- 16.2.4.1. Overview
- 16.2.4.2. Products
- 16.2.4.3. SWOT Analysis
- 16.2.4.4. Recent Developments
- 16.2.4.5. Financials (Based on Availability)
- 16.2.5 Verizon Communications Inc
- 16.2.5.1. Overview
- 16.2.5.2. Products
- 16.2.5.3. SWOT Analysis
- 16.2.5.4. Recent Developments
- 16.2.5.5. Financials (Based on Availability)
- 16.2.6 Microsoft Corporation
- 16.2.6.1. Overview
- 16.2.6.2. Products
- 16.2.6.3. SWOT Analysis
- 16.2.6.4. Recent Developments
- 16.2.6.5. Financials (Based on Availability)
- 16.2.7 HP Inc
- 16.2.7.1. Overview
- 16.2.7.2. Products
- 16.2.7.3. SWOT Analysis
- 16.2.7.4. Recent Developments
- 16.2.7.5. Financials (Based on Availability)
- 16.2.8 Fujitsu Limited
- 16.2.8.1. Overview
- 16.2.8.2. Products
- 16.2.8.3. SWOT Analysis
- 16.2.8.4. Recent Developments
- 16.2.8.5. Financials (Based on Availability)
- 16.2.9 Tata Consultancy Services Limited
- 16.2.9.1. Overview
- 16.2.9.2. Products
- 16.2.9.3. SWOT Analysis
- 16.2.9.4. Recent Developments
- 16.2.9.5. Financials (Based on Availability)
- 16.2.10 Dell Technologies Inc
- 16.2.10.1. Overview
- 16.2.10.2. Products
- 16.2.10.3. SWOT Analysis
- 16.2.10.4. Recent Developments
- 16.2.10.5. Financials (Based on Availability)
- 16.2.11 AT&T Inc
- 16.2.11.1. Overview
- 16.2.11.2. Products
- 16.2.11.3. SWOT Analysis
- 16.2.11.4. Recent Developments
- 16.2.11.5. Financials (Based on Availability)
- 16.2.12 Citrix Systems Inc
- 16.2.12.1. Overview
- 16.2.12.2. Products
- 16.2.12.3. SWOT Analysis
- 16.2.12.4. Recent Developments
- 16.2.12.5. Financials (Based on Availability)
- 16.2.1 Wipro Limite
List of Figures
- Figure 1: Global USA Managed Service Industry Revenue Breakdown (Million, %) by Region 2024 & 2032
- Figure 2: United states USA Managed Service Industry Revenue (Million), by Country 2024 & 2032
- Figure 3: United states USA Managed Service Industry Revenue Share (%), by Country 2024 & 2032
- Figure 4: North America USA Managed Service Industry Revenue (Million), by Deployment 2024 & 2032
- Figure 5: North America USA Managed Service Industry Revenue Share (%), by Deployment 2024 & 2032
- Figure 6: North America USA Managed Service Industry Revenue (Million), by Type 2024 & 2032
- Figure 7: North America USA Managed Service Industry Revenue Share (%), by Type 2024 & 2032
- Figure 8: North America USA Managed Service Industry Revenue (Million), by Enterprise Size 2024 & 2032
- Figure 9: North America USA Managed Service Industry Revenue Share (%), by Enterprise Size 2024 & 2032
- Figure 10: North America USA Managed Service Industry Revenue (Million), by End-user Vertical 2024 & 2032
- Figure 11: North America USA Managed Service Industry Revenue Share (%), by End-user Vertical 2024 & 2032
- Figure 12: North America USA Managed Service Industry Revenue (Million), by Country 2024 & 2032
- Figure 13: North America USA Managed Service Industry Revenue Share (%), by Country 2024 & 2032
- Figure 14: South America USA Managed Service Industry Revenue (Million), by Deployment 2024 & 2032
- Figure 15: South America USA Managed Service Industry Revenue Share (%), by Deployment 2024 & 2032
- Figure 16: South America USA Managed Service Industry Revenue (Million), by Type 2024 & 2032
- Figure 17: South America USA Managed Service Industry Revenue Share (%), by Type 2024 & 2032
- Figure 18: South America USA Managed Service Industry Revenue (Million), by Enterprise Size 2024 & 2032
- Figure 19: South America USA Managed Service Industry Revenue Share (%), by Enterprise Size 2024 & 2032
- Figure 20: South America USA Managed Service Industry Revenue (Million), by End-user Vertical 2024 & 2032
- Figure 21: South America USA Managed Service Industry Revenue Share (%), by End-user Vertical 2024 & 2032
- Figure 22: South America USA Managed Service Industry Revenue (Million), by Country 2024 & 2032
- Figure 23: South America USA Managed Service Industry Revenue Share (%), by Country 2024 & 2032
- Figure 24: Europe USA Managed Service Industry Revenue (Million), by Deployment 2024 & 2032
- Figure 25: Europe USA Managed Service Industry Revenue Share (%), by Deployment 2024 & 2032
- Figure 26: Europe USA Managed Service Industry Revenue (Million), by Type 2024 & 2032
- Figure 27: Europe USA Managed Service Industry Revenue Share (%), by Type 2024 & 2032
- Figure 28: Europe USA Managed Service Industry Revenue (Million), by Enterprise Size 2024 & 2032
- Figure 29: Europe USA Managed Service Industry Revenue Share (%), by Enterprise Size 2024 & 2032
- Figure 30: Europe USA Managed Service Industry Revenue (Million), by End-user Vertical 2024 & 2032
- Figure 31: Europe USA Managed Service Industry Revenue Share (%), by End-user Vertical 2024 & 2032
- Figure 32: Europe USA Managed Service Industry Revenue (Million), by Country 2024 & 2032
- Figure 33: Europe USA Managed Service Industry Revenue Share (%), by Country 2024 & 2032
- Figure 34: Middle East & Africa USA Managed Service Industry Revenue (Million), by Deployment 2024 & 2032
- Figure 35: Middle East & Africa USA Managed Service Industry Revenue Share (%), by Deployment 2024 & 2032
- Figure 36: Middle East & Africa USA Managed Service Industry Revenue (Million), by Type 2024 & 2032
- Figure 37: Middle East & Africa USA Managed Service Industry Revenue Share (%), by Type 2024 & 2032
- Figure 38: Middle East & Africa USA Managed Service Industry Revenue (Million), by Enterprise Size 2024 & 2032
- Figure 39: Middle East & Africa USA Managed Service Industry Revenue Share (%), by Enterprise Size 2024 & 2032
- Figure 40: Middle East & Africa USA Managed Service Industry Revenue (Million), by End-user Vertical 2024 & 2032
- Figure 41: Middle East & Africa USA Managed Service Industry Revenue Share (%), by End-user Vertical 2024 & 2032
- Figure 42: Middle East & Africa USA Managed Service Industry Revenue (Million), by Country 2024 & 2032
- Figure 43: Middle East & Africa USA Managed Service Industry Revenue Share (%), by Country 2024 & 2032
- Figure 44: Asia Pacific USA Managed Service Industry Revenue (Million), by Deployment 2024 & 2032
- Figure 45: Asia Pacific USA Managed Service Industry Revenue Share (%), by Deployment 2024 & 2032
- Figure 46: Asia Pacific USA Managed Service Industry Revenue (Million), by Type 2024 & 2032
- Figure 47: Asia Pacific USA Managed Service Industry Revenue Share (%), by Type 2024 & 2032
- Figure 48: Asia Pacific USA Managed Service Industry Revenue (Million), by Enterprise Size 2024 & 2032
- Figure 49: Asia Pacific USA Managed Service Industry Revenue Share (%), by Enterprise Size 2024 & 2032
- Figure 50: Asia Pacific USA Managed Service Industry Revenue (Million), by End-user Vertical 2024 & 2032
- Figure 51: Asia Pacific USA Managed Service Industry Revenue Share (%), by End-user Vertical 2024 & 2032
- Figure 52: Asia Pacific USA Managed Service Industry Revenue (Million), by Country 2024 & 2032
- Figure 53: Asia Pacific USA Managed Service Industry Revenue Share (%), by Country 2024 & 2032
List of Tables
- Table 1: Global USA Managed Service Industry Revenue Million Forecast, by Region 2019 & 2032
- Table 2: Global USA Managed Service Industry Revenue Million Forecast, by Deployment 2019 & 2032
- Table 3: Global USA Managed Service Industry Revenue Million Forecast, by Type 2019 & 2032
- Table 4: Global USA Managed Service Industry Revenue Million Forecast, by Enterprise Size 2019 & 2032
- Table 5: Global USA Managed Service Industry Revenue Million Forecast, by End-user Vertical 2019 & 2032
- Table 6: Global USA Managed Service Industry Revenue Million Forecast, by Region 2019 & 2032
- Table 7: Global USA Managed Service Industry Revenue Million Forecast, by Country 2019 & 2032
- Table 8: Northeast USA Managed Service Industry Revenue (Million) Forecast, by Application 2019 & 2032
- Table 9: Southeast USA Managed Service Industry Revenue (Million) Forecast, by Application 2019 & 2032
- Table 10: Midwest USA Managed Service Industry Revenue (Million) Forecast, by Application 2019 & 2032
- Table 11: Southwest USA Managed Service Industry Revenue (Million) Forecast, by Application 2019 & 2032
- Table 12: West USA Managed Service Industry Revenue (Million) Forecast, by Application 2019 & 2032
- Table 13: Global USA Managed Service Industry Revenue Million Forecast, by Deployment 2019 & 2032
- Table 14: Global USA Managed Service Industry Revenue Million Forecast, by Type 2019 & 2032
- Table 15: Global USA Managed Service Industry Revenue Million Forecast, by Enterprise Size 2019 & 2032
- Table 16: Global USA Managed Service Industry Revenue Million Forecast, by End-user Vertical 2019 & 2032
- Table 17: Global USA Managed Service Industry Revenue Million Forecast, by Country 2019 & 2032
- Table 18: United States USA Managed Service Industry Revenue (Million) Forecast, by Application 2019 & 2032
- Table 19: Canada USA Managed Service Industry Revenue (Million) Forecast, by Application 2019 & 2032
- Table 20: Mexico USA Managed Service Industry Revenue (Million) Forecast, by Application 2019 & 2032
- Table 21: Global USA Managed Service Industry Revenue Million Forecast, by Deployment 2019 & 2032
- Table 22: Global USA Managed Service Industry Revenue Million Forecast, by Type 2019 & 2032
- Table 23: Global USA Managed Service Industry Revenue Million Forecast, by Enterprise Size 2019 & 2032
- Table 24: Global USA Managed Service Industry Revenue Million Forecast, by End-user Vertical 2019 & 2032
- Table 25: Global USA Managed Service Industry Revenue Million Forecast, by Country 2019 & 2032
- Table 26: Brazil USA Managed Service Industry Revenue (Million) Forecast, by Application 2019 & 2032
- Table 27: Argentina USA Managed Service Industry Revenue (Million) Forecast, by Application 2019 & 2032
- Table 28: Rest of South America USA Managed Service Industry Revenue (Million) Forecast, by Application 2019 & 2032
- Table 29: Global USA Managed Service Industry Revenue Million Forecast, by Deployment 2019 & 2032
- Table 30: Global USA Managed Service Industry Revenue Million Forecast, by Type 2019 & 2032
- Table 31: Global USA Managed Service Industry Revenue Million Forecast, by Enterprise Size 2019 & 2032
- Table 32: Global USA Managed Service Industry Revenue Million Forecast, by End-user Vertical 2019 & 2032
- Table 33: Global USA Managed Service Industry Revenue Million Forecast, by Country 2019 & 2032
- Table 34: United Kingdom USA Managed Service Industry Revenue (Million) Forecast, by Application 2019 & 2032
- Table 35: Germany USA Managed Service Industry Revenue (Million) Forecast, by Application 2019 & 2032
- Table 36: France USA Managed Service Industry Revenue (Million) Forecast, by Application 2019 & 2032
- Table 37: Italy USA Managed Service Industry Revenue (Million) Forecast, by Application 2019 & 2032
- Table 38: Spain USA Managed Service Industry Revenue (Million) Forecast, by Application 2019 & 2032
- Table 39: Russia USA Managed Service Industry Revenue (Million) Forecast, by Application 2019 & 2032
- Table 40: Benelux USA Managed Service Industry Revenue (Million) Forecast, by Application 2019 & 2032
- Table 41: Nordics USA Managed Service Industry Revenue (Million) Forecast, by Application 2019 & 2032
- Table 42: Rest of Europe USA Managed Service Industry Revenue (Million) Forecast, by Application 2019 & 2032
- Table 43: Global USA Managed Service Industry Revenue Million Forecast, by Deployment 2019 & 2032
- Table 44: Global USA Managed Service Industry Revenue Million Forecast, by Type 2019 & 2032
- Table 45: Global USA Managed Service Industry Revenue Million Forecast, by Enterprise Size 2019 & 2032
- Table 46: Global USA Managed Service Industry Revenue Million Forecast, by End-user Vertical 2019 & 2032
- Table 47: Global USA Managed Service Industry Revenue Million Forecast, by Country 2019 & 2032
- Table 48: Turkey USA Managed Service Industry Revenue (Million) Forecast, by Application 2019 & 2032
- Table 49: Israel USA Managed Service Industry Revenue (Million) Forecast, by Application 2019 & 2032
- Table 50: GCC USA Managed Service Industry Revenue (Million) Forecast, by Application 2019 & 2032
- Table 51: North Africa USA Managed Service Industry Revenue (Million) Forecast, by Application 2019 & 2032
- Table 52: South Africa USA Managed Service Industry Revenue (Million) Forecast, by Application 2019 & 2032
- Table 53: Rest of Middle East & Africa USA Managed Service Industry Revenue (Million) Forecast, by Application 2019 & 2032
- Table 54: Global USA Managed Service Industry Revenue Million Forecast, by Deployment 2019 & 2032
- Table 55: Global USA Managed Service Industry Revenue Million Forecast, by Type 2019 & 2032
- Table 56: Global USA Managed Service Industry Revenue Million Forecast, by Enterprise Size 2019 & 2032
- Table 57: Global USA Managed Service Industry Revenue Million Forecast, by End-user Vertical 2019 & 2032
- Table 58: Global USA Managed Service Industry Revenue Million Forecast, by Country 2019 & 2032
- Table 59: China USA Managed Service Industry Revenue (Million) Forecast, by Application 2019 & 2032
- Table 60: India USA Managed Service Industry Revenue (Million) Forecast, by Application 2019 & 2032
- Table 61: Japan USA Managed Service Industry Revenue (Million) Forecast, by Application 2019 & 2032
- Table 62: South Korea USA Managed Service Industry Revenue (Million) Forecast, by Application 2019 & 2032
- Table 63: ASEAN USA Managed Service Industry Revenue (Million) Forecast, by Application 2019 & 2032
- Table 64: Oceania USA Managed Service Industry Revenue (Million) Forecast, by Application 2019 & 2032
- Table 65: Rest of Asia Pacific USA Managed Service Industry Revenue (Million) Forecast, by Application 2019 & 2032
Frequently Asked Questions
1. What is the projected Compound Annual Growth Rate (CAGR) of the USA Managed Service Industry?
The projected CAGR is approximately 10.82%.
2. Which companies are prominent players in the USA Managed Service Industry?
Key companies in the market include Wipro Limite, Rackspace Technology Inc, IBM Corporation, Cisco Systems Inc, Verizon Communications Inc, Microsoft Corporation, HP Inc, Fujitsu Limited, Tata Consultancy Services Limited, Dell Technologies Inc, AT&T Inc, Citrix Systems Inc.
3. What are the main segments of the USA Managed Service Industry?
The market segments include Deployment, Type, Enterprise Size, End-user Vertical.
4. Can you provide details about the market size?
The market size is estimated to be USD 62.76 Million as of 2022.
5. What are some drivers contributing to market growth?
Increasing Shift to Hybrid IT; Improved Cost and Operational Efficiency.
6. What are the notable trends driving market growth?
Cloud to Witness Significant Growth.
7. Are there any restraints impacting market growth?
High Risk of Radiation Since it uses Gamma Rays. X-Rays; High Deployment Costs.
8. Can you provide examples of recent developments in the market?
October 2023 - Rackspace Technology introduced Rackspace Managed Cloud (RMC), an all-inclusive service enabling customers to delegate their cloud environments' management and operations. This comprehensive solution is tailored for organizations utilizing platforms such as AWS, Azure, Google Cloud, Rackspace Private Cloud, and on-premises infrastructure.
9. What pricing options are available for accessing the report?
Pricing options include single-user, multi-user, and enterprise licenses priced at USD 3800, USD 4500, and USD 5800 respectively.
10. Is the market size provided in terms of value or volume?
The market size is provided in terms of value, measured in Million.
11. Are there any specific market keywords associated with the report?
Yes, the market keyword associated with the report is "USA Managed Service Industry," which aids in identifying and referencing the specific market segment covered.
12. How do I determine which pricing option suits my needs best?
The pricing options vary based on user requirements and access needs. Individual users may opt for single-user licenses, while businesses requiring broader access may choose multi-user or enterprise licenses for cost-effective access to the report.
13. Are there any additional resources or data provided in the USA Managed Service Industry report?
While the report offers comprehensive insights, it's advisable to review the specific contents or supplementary materials provided to ascertain if additional resources or data are available.
14. How can I stay updated on further developments or reports in the USA Managed Service Industry?
To stay informed about further developments, trends, and reports in the USA Managed Service Industry, consider subscribing to industry newsletters, following relevant companies and organizations, or regularly checking reputable industry news sources and publications.
Methodology
Step 1 - Identification of Relevant Samples Size from Population Database


Step 2 - Approaches for Defining Global Market Size (Value, Volume* & Price*)

Note*: In applicable scenarios
Step 3 - Data Sources
Primary Research
- Web Analytics
- Survey Reports
- Research Institute
- Latest Research Reports
- Opinion Leaders
Secondary Research
- Annual Reports
- White Paper
- Latest Press Release
- Industry Association
- Paid Database
- Investor Presentations

Step 4 - Data Triangulation
Involves using different sources of information in order to increase the validity of a study
These sources are likely to be stakeholders in a program - participants, other researchers, program staff, other community members, and so on.
Then we put all data in single framework & apply various statistical tools to find out the dynamic on the market.
During the analysis stage, feedback from the stakeholder groups would be compared to determine areas of agreement as well as areas of divergence
