

Key Insights
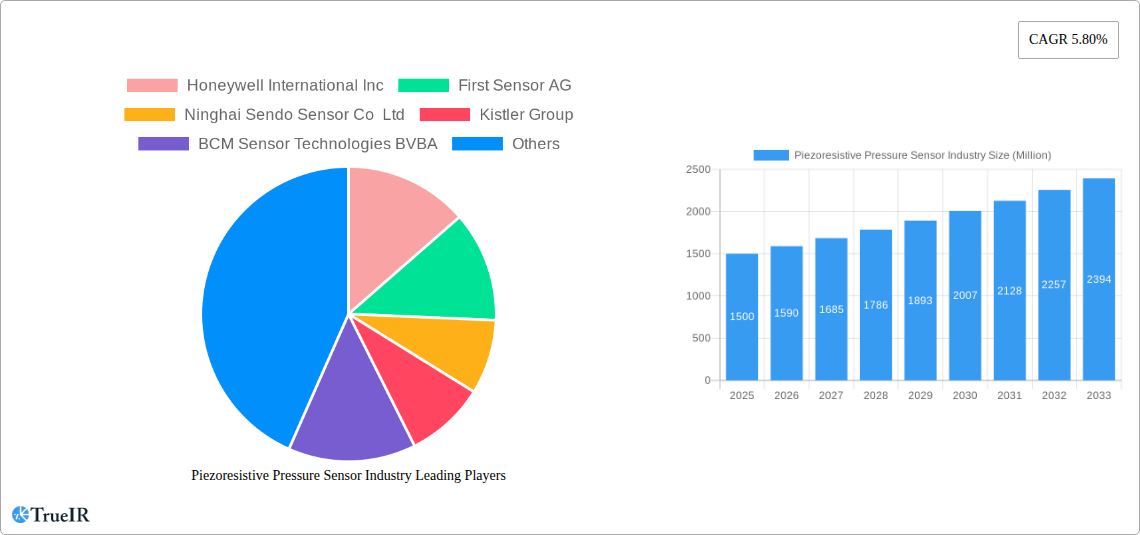
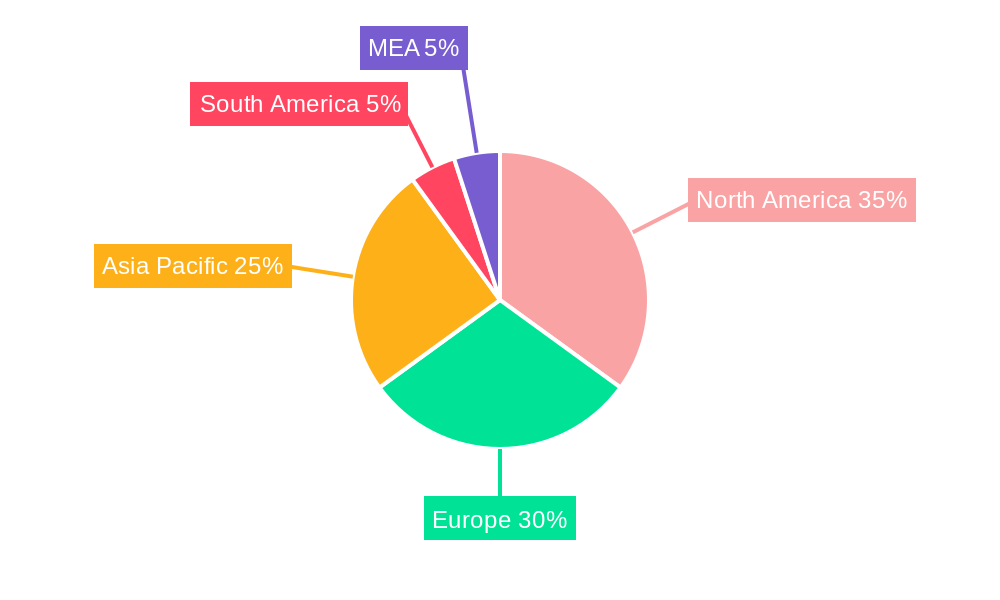
The piezoresistive pressure sensor market is experiencing robust growth, projected to maintain a Compound Annual Growth Rate (CAGR) of 5.80% from 2025 to 2033. This expansion is driven by several key factors. The automotive industry's increasing adoption of advanced driver-assistance systems (ADAS) and electric vehicles (EVs) fuels significant demand for precise and reliable pressure sensors. Similarly, the healthcare sector's reliance on minimally invasive procedures and remote patient monitoring technologies is boosting the market. Industrial automation, particularly in process control and manufacturing, further contributes to the growth trajectory. The rising demand for energy efficiency and enhanced safety measures in the oil and gas sector also plays a role. While material costs and technological advancements in competing sensor technologies represent potential restraints, the overall market outlook remains positive due to the diverse applications and continuous innovation in sensor design and manufacturing. The silicon material segment currently dominates due to its cost-effectiveness and performance characteristics, although ceramic materials are gaining traction in applications requiring higher temperature resistance and durability. Geographically, North America and Europe currently hold significant market share, but the Asia-Pacific region, driven by rapid industrialization and technological advancements in countries like China and India, is projected to witness the most substantial growth in the forecast period.
The market segmentation reveals a strong presence of established players like Honeywell International Inc. and Emerson Electric Company (Rosemount Inc.), alongside several specialized sensor manufacturers. This competitive landscape fosters innovation and drives down costs, making piezoresistive pressure sensors accessible to a wider range of applications. Future growth will depend on the continued development of miniaturization technologies, improved sensor accuracy and reliability, and expansion into emerging markets. The integration of advanced functionalities such as integrated signal processing and wireless connectivity will further enhance the appeal of piezoresistive pressure sensors across various end-use sectors. Industry collaborations and strategic acquisitions are expected to shape the competitive landscape in the coming years. Furthermore, regulatory compliance and safety standards continue to play an important role in shaping the market's trajectory.
This comprehensive report provides an in-depth analysis of the global piezoresistive pressure sensor industry, offering invaluable insights for businesses, investors, and researchers. Covering the period from 2019 to 2033, with a focus on 2025, this report meticulously examines market size, growth drivers, competitive dynamics, and future trends. The study leverages extensive primary and secondary research to deliver accurate and actionable intelligence, equipping stakeholders with the knowledge to make informed strategic decisions.
Piezoresistive Pressure Sensor Industry Market Structure & Competitive Landscape
The global piezoresistive pressure sensor market exhibits a moderately concentrated structure, with key players like Honeywell International Inc, First Sensor AG, and Kistler Group holding significant market share. The market concentration ratio (CR4) in 2025 is estimated at xx%. Innovation in sensor materials (e.g., silicon-on-insulator technology), miniaturization, and improved accuracy are key drivers. Regulatory changes concerning safety and environmental standards impact the industry, necessitating compliance with evolving guidelines. Product substitutes, such as capacitive and optical pressure sensors, pose competitive challenges.
The market is segmented by end-user industry, including automotive, healthcare, industrial, oil and gas, and others. The automotive segment dominates, driven by the increasing adoption of advanced driver-assistance systems (ADAS) and electronic control units (ECUs). Mergers and acquisitions (M&A) activity has been moderate in recent years, with xx major deals recorded between 2019 and 2024, primarily focused on strengthening technological capabilities and expanding market reach. The average deal size was approximately $xx Million.
- Market Concentration: CR4 (2025) estimated at xx%
- Innovation Drivers: Miniaturization, improved accuracy, new materials
- Regulatory Impacts: Compliance with safety and environmental standards
- Product Substitutes: Capacitive, optical sensors
- M&A Activity: xx major deals (2019-2024), average deal size $xx Million
Piezoresistive Pressure Sensor Industry Market Trends & Opportunities
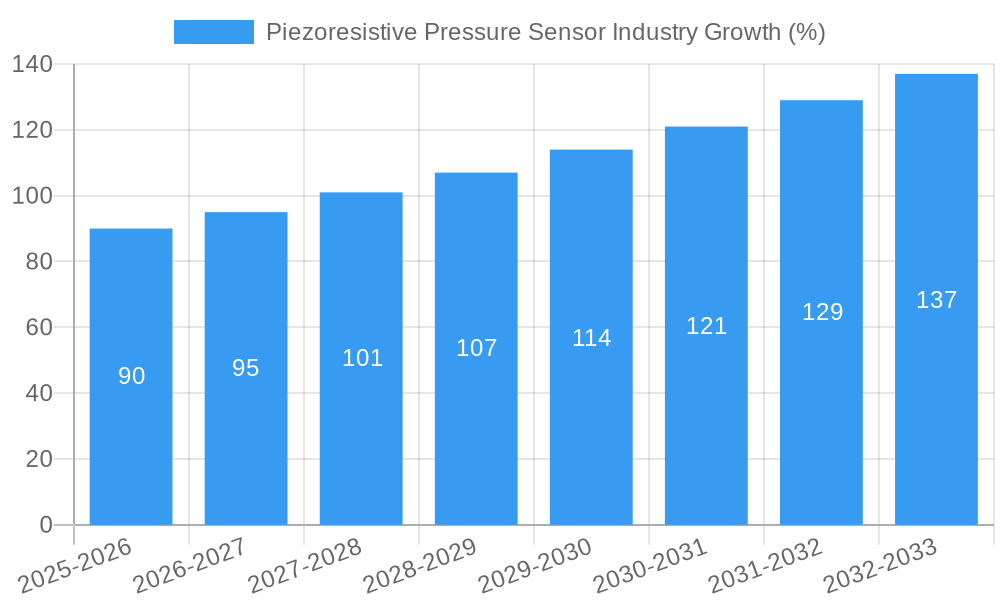
The global piezoresistive pressure sensor market is experiencing robust growth, with a Compound Annual Growth Rate (CAGR) of xx% projected from 2025 to 2033. The market size is estimated at $xx Million in 2025 and is expected to reach $xx Million by 2033. Technological advancements, such as the development of high-precision sensors with improved temperature compensation and enhanced durability, are driving market expansion. Growing demand from key end-user segments, particularly the automotive and industrial sectors, further fuels market growth. The increasing integration of sensors in IoT (Internet of Things) devices and the rising adoption of Industry 4.0 technologies present significant opportunities for market expansion. Competitive dynamics are characterized by ongoing product innovation, strategic partnerships, and geographical expansion by major players. Market penetration rates vary across different segments, with the automotive segment exhibiting the highest penetration rate, followed by the industrial segment.
Dominant Markets & Segments in Piezoresistive Pressure Sensor Industry
The Asia-Pacific region is expected to dominate the piezoresistive pressure sensor market during the forecast period, driven by rapid industrialization and automotive production growth in countries like China, India, and Japan. Within materials, silicon dominates the market due to its cost-effectiveness, excellent performance, and widespread availability. The automotive segment holds the largest market share amongst end-users, fueled by rising vehicle production and the increasing adoption of advanced driver-assistance systems (ADAS).
- Key Growth Drivers (Asia-Pacific):
- Rapid industrialization
- Automotive production growth
- Increasing infrastructure development
- Favorable government policies
- Silicon Material Dominance: Cost-effectiveness, performance, availability
- Automotive Segment Leadership: ADAS adoption, rising vehicle production
Piezoresistive Pressure Sensor Industry Product Analysis
Recent product innovations have focused on enhancing sensor accuracy, miniaturization, and improved temperature stability. Advances in microelectromechanical systems (MEMS) technology have enabled the development of smaller, more cost-effective sensors with improved performance characteristics. These advancements have broadened the application range of piezoresistive pressure sensors, extending their use in various industrial and consumer applications. The competitive advantage is derived from superior accuracy, reliability, and cost-effectiveness compared to alternative technologies.
Key Drivers, Barriers & Challenges in Piezoresistive Pressure Sensor Industry
Key Drivers:
- Technological advancements in MEMS technology.
- Growing demand from automotive and industrial sectors.
- Increasing adoption of IoT devices and Industry 4.0.
Challenges:
- Intense competition from alternative technologies (capacitive, optical).
- Supply chain disruptions impacting material availability and cost.
- Stringent regulatory requirements impacting product development and certification. This leads to approximately xx% increase in development cost.
Growth Drivers in the Piezoresistive Pressure Sensor Industry Market
Technological advancements, especially in MEMS technology, coupled with increasing demand from diverse sectors like automotive and industrial automation are key growth drivers. Government initiatives promoting industrial automation and smart city projects further propel market expansion. The rising adoption of IoT and Industry 4.0 technologies presents significant opportunities for growth.
Challenges Impacting Piezoresistive Pressure Sensor Industry Growth
Significant challenges include intense competition from alternative sensor technologies and potential supply chain disruptions affecting raw material costs and availability. Stringent regulatory requirements increase development costs and lead times, hindering rapid market penetration in certain regions.
Key Players Shaping the Piezoresistive Pressure Sensor Industry Market
- Honeywell International Inc
- First Sensor AG
- Ninghai Sendo Sensor Co Ltd
- Kistler Group
- BCM Sensor Technologies BVBA
- Metallux SA
- Impress Sensors and Systems Ltd
- BD Sensors GmBH
- Pewatron AG
- All Sensors Corporation
- Rosemount Inc (Emerson Electric Company)
Significant Piezoresistive Pressure Sensor Industry Milestones
- 2020: Honeywell launches a new line of high-accuracy piezoresistive pressure sensors for automotive applications.
- 2022: First Sensor acquires a smaller sensor company, expanding its product portfolio.
- 2023: New regulations on sensor accuracy are implemented in the EU.
- 2024: Kistler introduces a miniaturized piezoresistive pressure sensor for medical applications.
Future Outlook for Piezoresistive Pressure Sensor Industry Market
The piezoresistive pressure sensor market is poised for continued growth, driven by technological innovations, increasing demand from various end-user industries, and supportive government policies promoting automation and smart technologies. The integration of these sensors into advanced systems will create lucrative opportunities for market players. Strategic partnerships and investments in research and development will be crucial for sustained success in this competitive landscape.
Piezoresistive Pressure Sensor Industry Segmentation
-
1. Material
- 1.1. Silicon
- 1.2. Ceramic
- 1.3. Other Materials
-
2. End User
- 2.1. Automotive
- 2.2. Healthcare
- 2.3. Industrial
- 2.4. Oil and Gas
- 2.5. Other End Users
Piezoresistive Pressure Sensor Industry Segmentation By Geography
- 1. North America
- 2. Europe
- 3. Asia Pacific
- 4. Latin America
- 5. Middle East and Africa
Piezoresistive Pressure Sensor Industry REPORT HIGHLIGHTS
| Aspects | Details |
|---|---|
| Study Period | 2019-2033 |
| Base Year | 2024 |
| Estimated Year | 2025 |
| Forecast Period | 2025-2033 |
| Historical Period | 2019-2024 |
| Growth Rate | CAGR of 5.80% from 2019-2033 |
| Segmentation |
|
Table of Contents
- 1. Introduction
- 1.1. Research Scope
- 1.2. Market Segmentation
- 1.3. Research Methodology
- 1.4. Definitions and Assumptions
- 2. Executive Summary
- 2.1. Introduction
- 3. Market Dynamics
- 3.1. Introduction
- 3.2. Market Drivers
- 3.2.1. ; Rising Emphasis on Miniaturization of Equipment; Need for Robust Design and Enhanced Performance in Rugged Environment
- 3.3. Market Restrains
- 3.3.1. ; Technical Issues associated with the involvement of Smaller Components
- 3.4. Market Trends
- 3.4.1. Automotive Industry is Expected to Significantly Drive the Market Growth
- 4. Market Factor Analysis
- 4.1. Porters Five Forces
- 4.2. Supply/Value Chain
- 4.3. PESTEL analysis
- 4.4. Market Entropy
- 4.5. Patent/Trademark Analysis
- 5. Global Piezoresistive Pressure Sensor Industry Analysis, Insights and Forecast, 2019-2031
- 5.1. Market Analysis, Insights and Forecast - by Material
- 5.1.1. Silicon
- 5.1.2. Ceramic
- 5.1.3. Other Materials
- 5.2. Market Analysis, Insights and Forecast - by End User
- 5.2.1. Automotive
- 5.2.2. Healthcare
- 5.2.3. Industrial
- 5.2.4. Oil and Gas
- 5.2.5. Other End Users
- 5.3. Market Analysis, Insights and Forecast - by Region
- 5.3.1. North America
- 5.3.2. Europe
- 5.3.3. Asia Pacific
- 5.3.4. Latin America
- 5.3.5. Middle East and Africa
- 5.1. Market Analysis, Insights and Forecast - by Material
- 6. North America Piezoresistive Pressure Sensor Industry Analysis, Insights and Forecast, 2019-2031
- 6.1. Market Analysis, Insights and Forecast - by Material
- 6.1.1. Silicon
- 6.1.2. Ceramic
- 6.1.3. Other Materials
- 6.2. Market Analysis, Insights and Forecast - by End User
- 6.2.1. Automotive
- 6.2.2. Healthcare
- 6.2.3. Industrial
- 6.2.4. Oil and Gas
- 6.2.5. Other End Users
- 6.1. Market Analysis, Insights and Forecast - by Material
- 7. Europe Piezoresistive Pressure Sensor Industry Analysis, Insights and Forecast, 2019-2031
- 7.1. Market Analysis, Insights and Forecast - by Material
- 7.1.1. Silicon
- 7.1.2. Ceramic
- 7.1.3. Other Materials
- 7.2. Market Analysis, Insights and Forecast - by End User
- 7.2.1. Automotive
- 7.2.2. Healthcare
- 7.2.3. Industrial
- 7.2.4. Oil and Gas
- 7.2.5. Other End Users
- 7.1. Market Analysis, Insights and Forecast - by Material
- 8. Asia Pacific Piezoresistive Pressure Sensor Industry Analysis, Insights and Forecast, 2019-2031
- 8.1. Market Analysis, Insights and Forecast - by Material
- 8.1.1. Silicon
- 8.1.2. Ceramic
- 8.1.3. Other Materials
- 8.2. Market Analysis, Insights and Forecast - by End User
- 8.2.1. Automotive
- 8.2.2. Healthcare
- 8.2.3. Industrial
- 8.2.4. Oil and Gas
- 8.2.5. Other End Users
- 8.1. Market Analysis, Insights and Forecast - by Material
- 9. Latin America Piezoresistive Pressure Sensor Industry Analysis, Insights and Forecast, 2019-2031
- 9.1. Market Analysis, Insights and Forecast - by Material
- 9.1.1. Silicon
- 9.1.2. Ceramic
- 9.1.3. Other Materials
- 9.2. Market Analysis, Insights and Forecast - by End User
- 9.2.1. Automotive
- 9.2.2. Healthcare
- 9.2.3. Industrial
- 9.2.4. Oil and Gas
- 9.2.5. Other End Users
- 9.1. Market Analysis, Insights and Forecast - by Material
- 10. Middle East and Africa Piezoresistive Pressure Sensor Industry Analysis, Insights and Forecast, 2019-2031
- 10.1. Market Analysis, Insights and Forecast - by Material
- 10.1.1. Silicon
- 10.1.2. Ceramic
- 10.1.3. Other Materials
- 10.2. Market Analysis, Insights and Forecast - by End User
- 10.2.1. Automotive
- 10.2.2. Healthcare
- 10.2.3. Industrial
- 10.2.4. Oil and Gas
- 10.2.5. Other End Users
- 10.1. Market Analysis, Insights and Forecast - by Material
- 11. North America Piezoresistive Pressure Sensor Industry Analysis, Insights and Forecast, 2019-2031
- 11.1. Market Analysis, Insights and Forecast - By Country/Sub-region
- 11.1.1 United States
- 11.1.2 Canada
- 11.1.3 Mexico
- 12. Europe Piezoresistive Pressure Sensor Industry Analysis, Insights and Forecast, 2019-2031
- 12.1. Market Analysis, Insights and Forecast - By Country/Sub-region
- 12.1.1 Germany
- 12.1.2 United Kingdom
- 12.1.3 France
- 12.1.4 Spain
- 12.1.5 Italy
- 12.1.6 Spain
- 12.1.7 Belgium
- 12.1.8 Netherland
- 12.1.9 Nordics
- 12.1.10 Rest of Europe
- 13. Asia Pacific Piezoresistive Pressure Sensor Industry Analysis, Insights and Forecast, 2019-2031
- 13.1. Market Analysis, Insights and Forecast - By Country/Sub-region
- 13.1.1 China
- 13.1.2 Japan
- 13.1.3 India
- 13.1.4 South Korea
- 13.1.5 Southeast Asia
- 13.1.6 Australia
- 13.1.7 Indonesia
- 13.1.8 Phillipes
- 13.1.9 Singapore
- 13.1.10 Thailandc
- 13.1.11 Rest of Asia Pacific
- 14. South America Piezoresistive Pressure Sensor Industry Analysis, Insights and Forecast, 2019-2031
- 14.1. Market Analysis, Insights and Forecast - By Country/Sub-region
- 14.1.1 Brazil
- 14.1.2 Argentina
- 14.1.3 Peru
- 14.1.4 Chile
- 14.1.5 Colombia
- 14.1.6 Ecuador
- 14.1.7 Venezuela
- 14.1.8 Rest of South America
- 15. North America Piezoresistive Pressure Sensor Industry Analysis, Insights and Forecast, 2019-2031
- 15.1. Market Analysis, Insights and Forecast - By Country/Sub-region
- 15.1.1 United States
- 15.1.2 Canada
- 15.1.3 Mexico
- 16. MEA Piezoresistive Pressure Sensor Industry Analysis, Insights and Forecast, 2019-2031
- 16.1. Market Analysis, Insights and Forecast - By Country/Sub-region
- 16.1.1 United Arab Emirates
- 16.1.2 Saudi Arabia
- 16.1.3 South Africa
- 16.1.4 Rest of Middle East and Africa
- 17. Competitive Analysis
- 17.1. Global Market Share Analysis 2024
- 17.2. Company Profiles
- 17.2.1 Honeywell International Inc
- 17.2.1.1. Overview
- 17.2.1.2. Products
- 17.2.1.3. SWOT Analysis
- 17.2.1.4. Recent Developments
- 17.2.1.5. Financials (Based on Availability)
- 17.2.2 First Sensor AG
- 17.2.2.1. Overview
- 17.2.2.2. Products
- 17.2.2.3. SWOT Analysis
- 17.2.2.4. Recent Developments
- 17.2.2.5. Financials (Based on Availability)
- 17.2.3 Ninghai Sendo Sensor Co Ltd
- 17.2.3.1. Overview
- 17.2.3.2. Products
- 17.2.3.3. SWOT Analysis
- 17.2.3.4. Recent Developments
- 17.2.3.5. Financials (Based on Availability)
- 17.2.4 Kistler Group
- 17.2.4.1. Overview
- 17.2.4.2. Products
- 17.2.4.3. SWOT Analysis
- 17.2.4.4. Recent Developments
- 17.2.4.5. Financials (Based on Availability)
- 17.2.5 BCM Sensor Technologies BVBA
- 17.2.5.1. Overview
- 17.2.5.2. Products
- 17.2.5.3. SWOT Analysis
- 17.2.5.4. Recent Developments
- 17.2.5.5. Financials (Based on Availability)
- 17.2.6 Metallux SA
- 17.2.6.1. Overview
- 17.2.6.2. Products
- 17.2.6.3. SWOT Analysis
- 17.2.6.4. Recent Developments
- 17.2.6.5. Financials (Based on Availability)
- 17.2.7 Impress Sensors and Systems Ltd
- 17.2.7.1. Overview
- 17.2.7.2. Products
- 17.2.7.3. SWOT Analysis
- 17.2.7.4. Recent Developments
- 17.2.7.5. Financials (Based on Availability)
- 17.2.8 BD Sensors GmBH
- 17.2.8.1. Overview
- 17.2.8.2. Products
- 17.2.8.3. SWOT Analysis
- 17.2.8.4. Recent Developments
- 17.2.8.5. Financials (Based on Availability)
- 17.2.9 Pewatron AG
- 17.2.9.1. Overview
- 17.2.9.2. Products
- 17.2.9.3. SWOT Analysis
- 17.2.9.4. Recent Developments
- 17.2.9.5. Financials (Based on Availability)
- 17.2.10 All Sensors Corporation
- 17.2.10.1. Overview
- 17.2.10.2. Products
- 17.2.10.3. SWOT Analysis
- 17.2.10.4. Recent Developments
- 17.2.10.5. Financials (Based on Availability)
- 17.2.11 Rosemount Inc (Emerson Electric Company)
- 17.2.11.1. Overview
- 17.2.11.2. Products
- 17.2.11.3. SWOT Analysis
- 17.2.11.4. Recent Developments
- 17.2.11.5. Financials (Based on Availability)
- 17.2.1 Honeywell International Inc
List of Figures
- Figure 1: Global Piezoresistive Pressure Sensor Industry Revenue Breakdown (Million, %) by Region 2024 & 2032
- Figure 2: Global Piezoresistive Pressure Sensor Industry Volume Breakdown (K Unit, %) by Region 2024 & 2032
- Figure 3: North America Piezoresistive Pressure Sensor Industry Revenue (Million), by Country 2024 & 2032
- Figure 4: North America Piezoresistive Pressure Sensor Industry Volume (K Unit), by Country 2024 & 2032
- Figure 5: North America Piezoresistive Pressure Sensor Industry Revenue Share (%), by Country 2024 & 2032
- Figure 6: North America Piezoresistive Pressure Sensor Industry Volume Share (%), by Country 2024 & 2032
- Figure 7: Europe Piezoresistive Pressure Sensor Industry Revenue (Million), by Country 2024 & 2032
- Figure 8: Europe Piezoresistive Pressure Sensor Industry Volume (K Unit), by Country 2024 & 2032
- Figure 9: Europe Piezoresistive Pressure Sensor Industry Revenue Share (%), by Country 2024 & 2032
- Figure 10: Europe Piezoresistive Pressure Sensor Industry Volume Share (%), by Country 2024 & 2032
- Figure 11: Asia Pacific Piezoresistive Pressure Sensor Industry Revenue (Million), by Country 2024 & 2032
- Figure 12: Asia Pacific Piezoresistive Pressure Sensor Industry Volume (K Unit), by Country 2024 & 2032
- Figure 13: Asia Pacific Piezoresistive Pressure Sensor Industry Revenue Share (%), by Country 2024 & 2032
- Figure 14: Asia Pacific Piezoresistive Pressure Sensor Industry Volume Share (%), by Country 2024 & 2032
- Figure 15: South America Piezoresistive Pressure Sensor Industry Revenue (Million), by Country 2024 & 2032
- Figure 16: South America Piezoresistive Pressure Sensor Industry Volume (K Unit), by Country 2024 & 2032
- Figure 17: South America Piezoresistive Pressure Sensor Industry Revenue Share (%), by Country 2024 & 2032
- Figure 18: South America Piezoresistive Pressure Sensor Industry Volume Share (%), by Country 2024 & 2032
- Figure 19: North America Piezoresistive Pressure Sensor Industry Revenue (Million), by Country 2024 & 2032
- Figure 20: North America Piezoresistive Pressure Sensor Industry Volume (K Unit), by Country 2024 & 2032
- Figure 21: North America Piezoresistive Pressure Sensor Industry Revenue Share (%), by Country 2024 & 2032
- Figure 22: North America Piezoresistive Pressure Sensor Industry Volume Share (%), by Country 2024 & 2032
- Figure 23: MEA Piezoresistive Pressure Sensor Industry Revenue (Million), by Country 2024 & 2032
- Figure 24: MEA Piezoresistive Pressure Sensor Industry Volume (K Unit), by Country 2024 & 2032
- Figure 25: MEA Piezoresistive Pressure Sensor Industry Revenue Share (%), by Country 2024 & 2032
- Figure 26: MEA Piezoresistive Pressure Sensor Industry Volume Share (%), by Country 2024 & 2032
- Figure 27: North America Piezoresistive Pressure Sensor Industry Revenue (Million), by Material 2024 & 2032
- Figure 28: North America Piezoresistive Pressure Sensor Industry Volume (K Unit), by Material 2024 & 2032
- Figure 29: North America Piezoresistive Pressure Sensor Industry Revenue Share (%), by Material 2024 & 2032
- Figure 30: North America Piezoresistive Pressure Sensor Industry Volume Share (%), by Material 2024 & 2032
- Figure 31: North America Piezoresistive Pressure Sensor Industry Revenue (Million), by End User 2024 & 2032
- Figure 32: North America Piezoresistive Pressure Sensor Industry Volume (K Unit), by End User 2024 & 2032
- Figure 33: North America Piezoresistive Pressure Sensor Industry Revenue Share (%), by End User 2024 & 2032
- Figure 34: North America Piezoresistive Pressure Sensor Industry Volume Share (%), by End User 2024 & 2032
- Figure 35: North America Piezoresistive Pressure Sensor Industry Revenue (Million), by Country 2024 & 2032
- Figure 36: North America Piezoresistive Pressure Sensor Industry Volume (K Unit), by Country 2024 & 2032
- Figure 37: North America Piezoresistive Pressure Sensor Industry Revenue Share (%), by Country 2024 & 2032
- Figure 38: North America Piezoresistive Pressure Sensor Industry Volume Share (%), by Country 2024 & 2032
- Figure 39: Europe Piezoresistive Pressure Sensor Industry Revenue (Million), by Material 2024 & 2032
- Figure 40: Europe Piezoresistive Pressure Sensor Industry Volume (K Unit), by Material 2024 & 2032
- Figure 41: Europe Piezoresistive Pressure Sensor Industry Revenue Share (%), by Material 2024 & 2032
- Figure 42: Europe Piezoresistive Pressure Sensor Industry Volume Share (%), by Material 2024 & 2032
- Figure 43: Europe Piezoresistive Pressure Sensor Industry Revenue (Million), by End User 2024 & 2032
- Figure 44: Europe Piezoresistive Pressure Sensor Industry Volume (K Unit), by End User 2024 & 2032
- Figure 45: Europe Piezoresistive Pressure Sensor Industry Revenue Share (%), by End User 2024 & 2032
- Figure 46: Europe Piezoresistive Pressure Sensor Industry Volume Share (%), by End User 2024 & 2032
- Figure 47: Europe Piezoresistive Pressure Sensor Industry Revenue (Million), by Country 2024 & 2032
- Figure 48: Europe Piezoresistive Pressure Sensor Industry Volume (K Unit), by Country 2024 & 2032
- Figure 49: Europe Piezoresistive Pressure Sensor Industry Revenue Share (%), by Country 2024 & 2032
- Figure 50: Europe Piezoresistive Pressure Sensor Industry Volume Share (%), by Country 2024 & 2032
- Figure 51: Asia Pacific Piezoresistive Pressure Sensor Industry Revenue (Million), by Material 2024 & 2032
- Figure 52: Asia Pacific Piezoresistive Pressure Sensor Industry Volume (K Unit), by Material 2024 & 2032
- Figure 53: Asia Pacific Piezoresistive Pressure Sensor Industry Revenue Share (%), by Material 2024 & 2032
- Figure 54: Asia Pacific Piezoresistive Pressure Sensor Industry Volume Share (%), by Material 2024 & 2032
- Figure 55: Asia Pacific Piezoresistive Pressure Sensor Industry Revenue (Million), by End User 2024 & 2032
- Figure 56: Asia Pacific Piezoresistive Pressure Sensor Industry Volume (K Unit), by End User 2024 & 2032
- Figure 57: Asia Pacific Piezoresistive Pressure Sensor Industry Revenue Share (%), by End User 2024 & 2032
- Figure 58: Asia Pacific Piezoresistive Pressure Sensor Industry Volume Share (%), by End User 2024 & 2032
- Figure 59: Asia Pacific Piezoresistive Pressure Sensor Industry Revenue (Million), by Country 2024 & 2032
- Figure 60: Asia Pacific Piezoresistive Pressure Sensor Industry Volume (K Unit), by Country 2024 & 2032
- Figure 61: Asia Pacific Piezoresistive Pressure Sensor Industry Revenue Share (%), by Country 2024 & 2032
- Figure 62: Asia Pacific Piezoresistive Pressure Sensor Industry Volume Share (%), by Country 2024 & 2032
- Figure 63: Latin America Piezoresistive Pressure Sensor Industry Revenue (Million), by Material 2024 & 2032
- Figure 64: Latin America Piezoresistive Pressure Sensor Industry Volume (K Unit), by Material 2024 & 2032
- Figure 65: Latin America Piezoresistive Pressure Sensor Industry Revenue Share (%), by Material 2024 & 2032
- Figure 66: Latin America Piezoresistive Pressure Sensor Industry Volume Share (%), by Material 2024 & 2032
- Figure 67: Latin America Piezoresistive Pressure Sensor Industry Revenue (Million), by End User 2024 & 2032
- Figure 68: Latin America Piezoresistive Pressure Sensor Industry Volume (K Unit), by End User 2024 & 2032
- Figure 69: Latin America Piezoresistive Pressure Sensor Industry Revenue Share (%), by End User 2024 & 2032
- Figure 70: Latin America Piezoresistive Pressure Sensor Industry Volume Share (%), by End User 2024 & 2032
- Figure 71: Latin America Piezoresistive Pressure Sensor Industry Revenue (Million), by Country 2024 & 2032
- Figure 72: Latin America Piezoresistive Pressure Sensor Industry Volume (K Unit), by Country 2024 & 2032
- Figure 73: Latin America Piezoresistive Pressure Sensor Industry Revenue Share (%), by Country 2024 & 2032
- Figure 74: Latin America Piezoresistive Pressure Sensor Industry Volume Share (%), by Country 2024 & 2032
- Figure 75: Middle East and Africa Piezoresistive Pressure Sensor Industry Revenue (Million), by Material 2024 & 2032
- Figure 76: Middle East and Africa Piezoresistive Pressure Sensor Industry Volume (K Unit), by Material 2024 & 2032
- Figure 77: Middle East and Africa Piezoresistive Pressure Sensor Industry Revenue Share (%), by Material 2024 & 2032
- Figure 78: Middle East and Africa Piezoresistive Pressure Sensor Industry Volume Share (%), by Material 2024 & 2032
- Figure 79: Middle East and Africa Piezoresistive Pressure Sensor Industry Revenue (Million), by End User 2024 & 2032
- Figure 80: Middle East and Africa Piezoresistive Pressure Sensor Industry Volume (K Unit), by End User 2024 & 2032
- Figure 81: Middle East and Africa Piezoresistive Pressure Sensor Industry Revenue Share (%), by End User 2024 & 2032
- Figure 82: Middle East and Africa Piezoresistive Pressure Sensor Industry Volume Share (%), by End User 2024 & 2032
- Figure 83: Middle East and Africa Piezoresistive Pressure Sensor Industry Revenue (Million), by Country 2024 & 2032
- Figure 84: Middle East and Africa Piezoresistive Pressure Sensor Industry Volume (K Unit), by Country 2024 & 2032
- Figure 85: Middle East and Africa Piezoresistive Pressure Sensor Industry Revenue Share (%), by Country 2024 & 2032
- Figure 86: Middle East and Africa Piezoresistive Pressure Sensor Industry Volume Share (%), by Country 2024 & 2032
List of Tables
- Table 1: Global Piezoresistive Pressure Sensor Industry Revenue Million Forecast, by Region 2019 & 2032
- Table 2: Global Piezoresistive Pressure Sensor Industry Volume K Unit Forecast, by Region 2019 & 2032
- Table 3: Global Piezoresistive Pressure Sensor Industry Revenue Million Forecast, by Material 2019 & 2032
- Table 4: Global Piezoresistive Pressure Sensor Industry Volume K Unit Forecast, by Material 2019 & 2032
- Table 5: Global Piezoresistive Pressure Sensor Industry Revenue Million Forecast, by End User 2019 & 2032
- Table 6: Global Piezoresistive Pressure Sensor Industry Volume K Unit Forecast, by End User 2019 & 2032
- Table 7: Global Piezoresistive Pressure Sensor Industry Revenue Million Forecast, by Region 2019 & 2032
- Table 8: Global Piezoresistive Pressure Sensor Industry Volume K Unit Forecast, by Region 2019 & 2032
- Table 9: Global Piezoresistive Pressure Sensor Industry Revenue Million Forecast, by Country 2019 & 2032
- Table 10: Global Piezoresistive Pressure Sensor Industry Volume K Unit Forecast, by Country 2019 & 2032
- Table 11: United States Piezoresistive Pressure Sensor Industry Revenue (Million) Forecast, by Application 2019 & 2032
- Table 12: United States Piezoresistive Pressure Sensor Industry Volume (K Unit) Forecast, by Application 2019 & 2032
- Table 13: Canada Piezoresistive Pressure Sensor Industry Revenue (Million) Forecast, by Application 2019 & 2032
- Table 14: Canada Piezoresistive Pressure Sensor Industry Volume (K Unit) Forecast, by Application 2019 & 2032
- Table 15: Mexico Piezoresistive Pressure Sensor Industry Revenue (Million) Forecast, by Application 2019 & 2032
- Table 16: Mexico Piezoresistive Pressure Sensor Industry Volume (K Unit) Forecast, by Application 2019 & 2032
- Table 17: Global Piezoresistive Pressure Sensor Industry Revenue Million Forecast, by Country 2019 & 2032
- Table 18: Global Piezoresistive Pressure Sensor Industry Volume K Unit Forecast, by Country 2019 & 2032
- Table 19: Germany Piezoresistive Pressure Sensor Industry Revenue (Million) Forecast, by Application 2019 & 2032
- Table 20: Germany Piezoresistive Pressure Sensor Industry Volume (K Unit) Forecast, by Application 2019 & 2032
- Table 21: United Kingdom Piezoresistive Pressure Sensor Industry Revenue (Million) Forecast, by Application 2019 & 2032
- Table 22: United Kingdom Piezoresistive Pressure Sensor Industry Volume (K Unit) Forecast, by Application 2019 & 2032
- Table 23: France Piezoresistive Pressure Sensor Industry Revenue (Million) Forecast, by Application 2019 & 2032
- Table 24: France Piezoresistive Pressure Sensor Industry Volume (K Unit) Forecast, by Application 2019 & 2032
- Table 25: Spain Piezoresistive Pressure Sensor Industry Revenue (Million) Forecast, by Application 2019 & 2032
- Table 26: Spain Piezoresistive Pressure Sensor Industry Volume (K Unit) Forecast, by Application 2019 & 2032
- Table 27: Italy Piezoresistive Pressure Sensor Industry Revenue (Million) Forecast, by Application 2019 & 2032
- Table 28: Italy Piezoresistive Pressure Sensor Industry Volume (K Unit) Forecast, by Application 2019 & 2032
- Table 29: Spain Piezoresistive Pressure Sensor Industry Revenue (Million) Forecast, by Application 2019 & 2032
- Table 30: Spain Piezoresistive Pressure Sensor Industry Volume (K Unit) Forecast, by Application 2019 & 2032
- Table 31: Belgium Piezoresistive Pressure Sensor Industry Revenue (Million) Forecast, by Application 2019 & 2032
- Table 32: Belgium Piezoresistive Pressure Sensor Industry Volume (K Unit) Forecast, by Application 2019 & 2032
- Table 33: Netherland Piezoresistive Pressure Sensor Industry Revenue (Million) Forecast, by Application 2019 & 2032
- Table 34: Netherland Piezoresistive Pressure Sensor Industry Volume (K Unit) Forecast, by Application 2019 & 2032
- Table 35: Nordics Piezoresistive Pressure Sensor Industry Revenue (Million) Forecast, by Application 2019 & 2032
- Table 36: Nordics Piezoresistive Pressure Sensor Industry Volume (K Unit) Forecast, by Application 2019 & 2032
- Table 37: Rest of Europe Piezoresistive Pressure Sensor Industry Revenue (Million) Forecast, by Application 2019 & 2032
- Table 38: Rest of Europe Piezoresistive Pressure Sensor Industry Volume (K Unit) Forecast, by Application 2019 & 2032
- Table 39: Global Piezoresistive Pressure Sensor Industry Revenue Million Forecast, by Country 2019 & 2032
- Table 40: Global Piezoresistive Pressure Sensor Industry Volume K Unit Forecast, by Country 2019 & 2032
- Table 41: China Piezoresistive Pressure Sensor Industry Revenue (Million) Forecast, by Application 2019 & 2032
- Table 42: China Piezoresistive Pressure Sensor Industry Volume (K Unit) Forecast, by Application 2019 & 2032
- Table 43: Japan Piezoresistive Pressure Sensor Industry Revenue (Million) Forecast, by Application 2019 & 2032
- Table 44: Japan Piezoresistive Pressure Sensor Industry Volume (K Unit) Forecast, by Application 2019 & 2032
- Table 45: India Piezoresistive Pressure Sensor Industry Revenue (Million) Forecast, by Application 2019 & 2032
- Table 46: India Piezoresistive Pressure Sensor Industry Volume (K Unit) Forecast, by Application 2019 & 2032
- Table 47: South Korea Piezoresistive Pressure Sensor Industry Revenue (Million) Forecast, by Application 2019 & 2032
- Table 48: South Korea Piezoresistive Pressure Sensor Industry Volume (K Unit) Forecast, by Application 2019 & 2032
- Table 49: Southeast Asia Piezoresistive Pressure Sensor Industry Revenue (Million) Forecast, by Application 2019 & 2032
- Table 50: Southeast Asia Piezoresistive Pressure Sensor Industry Volume (K Unit) Forecast, by Application 2019 & 2032
- Table 51: Australia Piezoresistive Pressure Sensor Industry Revenue (Million) Forecast, by Application 2019 & 2032
- Table 52: Australia Piezoresistive Pressure Sensor Industry Volume (K Unit) Forecast, by Application 2019 & 2032
- Table 53: Indonesia Piezoresistive Pressure Sensor Industry Revenue (Million) Forecast, by Application 2019 & 2032
- Table 54: Indonesia Piezoresistive Pressure Sensor Industry Volume (K Unit) Forecast, by Application 2019 & 2032
- Table 55: Phillipes Piezoresistive Pressure Sensor Industry Revenue (Million) Forecast, by Application 2019 & 2032
- Table 56: Phillipes Piezoresistive Pressure Sensor Industry Volume (K Unit) Forecast, by Application 2019 & 2032
- Table 57: Singapore Piezoresistive Pressure Sensor Industry Revenue (Million) Forecast, by Application 2019 & 2032
- Table 58: Singapore Piezoresistive Pressure Sensor Industry Volume (K Unit) Forecast, by Application 2019 & 2032
- Table 59: Thailandc Piezoresistive Pressure Sensor Industry Revenue (Million) Forecast, by Application 2019 & 2032
- Table 60: Thailandc Piezoresistive Pressure Sensor Industry Volume (K Unit) Forecast, by Application 2019 & 2032
- Table 61: Rest of Asia Pacific Piezoresistive Pressure Sensor Industry Revenue (Million) Forecast, by Application 2019 & 2032
- Table 62: Rest of Asia Pacific Piezoresistive Pressure Sensor Industry Volume (K Unit) Forecast, by Application 2019 & 2032
- Table 63: Global Piezoresistive Pressure Sensor Industry Revenue Million Forecast, by Country 2019 & 2032
- Table 64: Global Piezoresistive Pressure Sensor Industry Volume K Unit Forecast, by Country 2019 & 2032
- Table 65: Brazil Piezoresistive Pressure Sensor Industry Revenue (Million) Forecast, by Application 2019 & 2032
- Table 66: Brazil Piezoresistive Pressure Sensor Industry Volume (K Unit) Forecast, by Application 2019 & 2032
- Table 67: Argentina Piezoresistive Pressure Sensor Industry Revenue (Million) Forecast, by Application 2019 & 2032
- Table 68: Argentina Piezoresistive Pressure Sensor Industry Volume (K Unit) Forecast, by Application 2019 & 2032
- Table 69: Peru Piezoresistive Pressure Sensor Industry Revenue (Million) Forecast, by Application 2019 & 2032
- Table 70: Peru Piezoresistive Pressure Sensor Industry Volume (K Unit) Forecast, by Application 2019 & 2032
- Table 71: Chile Piezoresistive Pressure Sensor Industry Revenue (Million) Forecast, by Application 2019 & 2032
- Table 72: Chile Piezoresistive Pressure Sensor Industry Volume (K Unit) Forecast, by Application 2019 & 2032
- Table 73: Colombia Piezoresistive Pressure Sensor Industry Revenue (Million) Forecast, by Application 2019 & 2032
- Table 74: Colombia Piezoresistive Pressure Sensor Industry Volume (K Unit) Forecast, by Application 2019 & 2032
- Table 75: Ecuador Piezoresistive Pressure Sensor Industry Revenue (Million) Forecast, by Application 2019 & 2032
- Table 76: Ecuador Piezoresistive Pressure Sensor Industry Volume (K Unit) Forecast, by Application 2019 & 2032
- Table 77: Venezuela Piezoresistive Pressure Sensor Industry Revenue (Million) Forecast, by Application 2019 & 2032
- Table 78: Venezuela Piezoresistive Pressure Sensor Industry Volume (K Unit) Forecast, by Application 2019 & 2032
- Table 79: Rest of South America Piezoresistive Pressure Sensor Industry Revenue (Million) Forecast, by Application 2019 & 2032
- Table 80: Rest of South America Piezoresistive Pressure Sensor Industry Volume (K Unit) Forecast, by Application 2019 & 2032
- Table 81: Global Piezoresistive Pressure Sensor Industry Revenue Million Forecast, by Country 2019 & 2032
- Table 82: Global Piezoresistive Pressure Sensor Industry Volume K Unit Forecast, by Country 2019 & 2032
- Table 83: United States Piezoresistive Pressure Sensor Industry Revenue (Million) Forecast, by Application 2019 & 2032
- Table 84: United States Piezoresistive Pressure Sensor Industry Volume (K Unit) Forecast, by Application 2019 & 2032
- Table 85: Canada Piezoresistive Pressure Sensor Industry Revenue (Million) Forecast, by Application 2019 & 2032
- Table 86: Canada Piezoresistive Pressure Sensor Industry Volume (K Unit) Forecast, by Application 2019 & 2032
- Table 87: Mexico Piezoresistive Pressure Sensor Industry Revenue (Million) Forecast, by Application 2019 & 2032
- Table 88: Mexico Piezoresistive Pressure Sensor Industry Volume (K Unit) Forecast, by Application 2019 & 2032
- Table 89: Global Piezoresistive Pressure Sensor Industry Revenue Million Forecast, by Country 2019 & 2032
- Table 90: Global Piezoresistive Pressure Sensor Industry Volume K Unit Forecast, by Country 2019 & 2032
- Table 91: United Arab Emirates Piezoresistive Pressure Sensor Industry Revenue (Million) Forecast, by Application 2019 & 2032
- Table 92: United Arab Emirates Piezoresistive Pressure Sensor Industry Volume (K Unit) Forecast, by Application 2019 & 2032
- Table 93: Saudi Arabia Piezoresistive Pressure Sensor Industry Revenue (Million) Forecast, by Application 2019 & 2032
- Table 94: Saudi Arabia Piezoresistive Pressure Sensor Industry Volume (K Unit) Forecast, by Application 2019 & 2032
- Table 95: South Africa Piezoresistive Pressure Sensor Industry Revenue (Million) Forecast, by Application 2019 & 2032
- Table 96: South Africa Piezoresistive Pressure Sensor Industry Volume (K Unit) Forecast, by Application 2019 & 2032
- Table 97: Rest of Middle East and Africa Piezoresistive Pressure Sensor Industry Revenue (Million) Forecast, by Application 2019 & 2032
- Table 98: Rest of Middle East and Africa Piezoresistive Pressure Sensor Industry Volume (K Unit) Forecast, by Application 2019 & 2032
- Table 99: Global Piezoresistive Pressure Sensor Industry Revenue Million Forecast, by Material 2019 & 2032
- Table 100: Global Piezoresistive Pressure Sensor Industry Volume K Unit Forecast, by Material 2019 & 2032
- Table 101: Global Piezoresistive Pressure Sensor Industry Revenue Million Forecast, by End User 2019 & 2032
- Table 102: Global Piezoresistive Pressure Sensor Industry Volume K Unit Forecast, by End User 2019 & 2032
- Table 103: Global Piezoresistive Pressure Sensor Industry Revenue Million Forecast, by Country 2019 & 2032
- Table 104: Global Piezoresistive Pressure Sensor Industry Volume K Unit Forecast, by Country 2019 & 2032
- Table 105: Global Piezoresistive Pressure Sensor Industry Revenue Million Forecast, by Material 2019 & 2032
- Table 106: Global Piezoresistive Pressure Sensor Industry Volume K Unit Forecast, by Material 2019 & 2032
- Table 107: Global Piezoresistive Pressure Sensor Industry Revenue Million Forecast, by End User 2019 & 2032
- Table 108: Global Piezoresistive Pressure Sensor Industry Volume K Unit Forecast, by End User 2019 & 2032
- Table 109: Global Piezoresistive Pressure Sensor Industry Revenue Million Forecast, by Country 2019 & 2032
- Table 110: Global Piezoresistive Pressure Sensor Industry Volume K Unit Forecast, by Country 2019 & 2032
- Table 111: Global Piezoresistive Pressure Sensor Industry Revenue Million Forecast, by Material 2019 & 2032
- Table 112: Global Piezoresistive Pressure Sensor Industry Volume K Unit Forecast, by Material 2019 & 2032
- Table 113: Global Piezoresistive Pressure Sensor Industry Revenue Million Forecast, by End User 2019 & 2032
- Table 114: Global Piezoresistive Pressure Sensor Industry Volume K Unit Forecast, by End User 2019 & 2032
- Table 115: Global Piezoresistive Pressure Sensor Industry Revenue Million Forecast, by Country 2019 & 2032
- Table 116: Global Piezoresistive Pressure Sensor Industry Volume K Unit Forecast, by Country 2019 & 2032
- Table 117: Global Piezoresistive Pressure Sensor Industry Revenue Million Forecast, by Material 2019 & 2032
- Table 118: Global Piezoresistive Pressure Sensor Industry Volume K Unit Forecast, by Material 2019 & 2032
- Table 119: Global Piezoresistive Pressure Sensor Industry Revenue Million Forecast, by End User 2019 & 2032
- Table 120: Global Piezoresistive Pressure Sensor Industry Volume K Unit Forecast, by End User 2019 & 2032
- Table 121: Global Piezoresistive Pressure Sensor Industry Revenue Million Forecast, by Country 2019 & 2032
- Table 122: Global Piezoresistive Pressure Sensor Industry Volume K Unit Forecast, by Country 2019 & 2032
- Table 123: Global Piezoresistive Pressure Sensor Industry Revenue Million Forecast, by Material 2019 & 2032
- Table 124: Global Piezoresistive Pressure Sensor Industry Volume K Unit Forecast, by Material 2019 & 2032
- Table 125: Global Piezoresistive Pressure Sensor Industry Revenue Million Forecast, by End User 2019 & 2032
- Table 126: Global Piezoresistive Pressure Sensor Industry Volume K Unit Forecast, by End User 2019 & 2032
- Table 127: Global Piezoresistive Pressure Sensor Industry Revenue Million Forecast, by Country 2019 & 2032
- Table 128: Global Piezoresistive Pressure Sensor Industry Volume K Unit Forecast, by Country 2019 & 2032
Frequently Asked Questions
1. What is the projected Compound Annual Growth Rate (CAGR) of the Piezoresistive Pressure Sensor Industry?
The projected CAGR is approximately 5.80%.
2. Which companies are prominent players in the Piezoresistive Pressure Sensor Industry?
Key companies in the market include Honeywell International Inc, First Sensor AG, Ninghai Sendo Sensor Co Ltd, Kistler Group, BCM Sensor Technologies BVBA, Metallux SA, Impress Sensors and Systems Ltd, BD Sensors GmBH, Pewatron AG, All Sensors Corporation, Rosemount Inc (Emerson Electric Company).
3. What are the main segments of the Piezoresistive Pressure Sensor Industry?
The market segments include Material, End User.
4. Can you provide details about the market size?
The market size is estimated to be USD XX Million as of 2022.
5. What are some drivers contributing to market growth?
; Rising Emphasis on Miniaturization of Equipment; Need for Robust Design and Enhanced Performance in Rugged Environment.
6. What are the notable trends driving market growth?
Automotive Industry is Expected to Significantly Drive the Market Growth.
7. Are there any restraints impacting market growth?
; Technical Issues associated with the involvement of Smaller Components.
8. Can you provide examples of recent developments in the market?
N/A
9. What pricing options are available for accessing the report?
Pricing options include single-user, multi-user, and enterprise licenses priced at USD 4750, USD 5250, and USD 8750 respectively.
10. Is the market size provided in terms of value or volume?
The market size is provided in terms of value, measured in Million and volume, measured in K Unit.
11. Are there any specific market keywords associated with the report?
Yes, the market keyword associated with the report is "Piezoresistive Pressure Sensor Industry," which aids in identifying and referencing the specific market segment covered.
12. How do I determine which pricing option suits my needs best?
The pricing options vary based on user requirements and access needs. Individual users may opt for single-user licenses, while businesses requiring broader access may choose multi-user or enterprise licenses for cost-effective access to the report.
13. Are there any additional resources or data provided in the Piezoresistive Pressure Sensor Industry report?
While the report offers comprehensive insights, it's advisable to review the specific contents or supplementary materials provided to ascertain if additional resources or data are available.
14. How can I stay updated on further developments or reports in the Piezoresistive Pressure Sensor Industry?
To stay informed about further developments, trends, and reports in the Piezoresistive Pressure Sensor Industry, consider subscribing to industry newsletters, following relevant companies and organizations, or regularly checking reputable industry news sources and publications.
Methodology
Step 1 - Identification of Relevant Samples Size from Population Database


Step 2 - Approaches for Defining Global Market Size (Value, Volume* & Price*)

Note*: In applicable scenarios
Step 3 - Data Sources
Primary Research
- Web Analytics
- Survey Reports
- Research Institute
- Latest Research Reports
- Opinion Leaders
Secondary Research
- Annual Reports
- White Paper
- Latest Press Release
- Industry Association
- Paid Database
- Investor Presentations

Step 4 - Data Triangulation
Involves using different sources of information in order to increase the validity of a study
These sources are likely to be stakeholders in a program - participants, other researchers, program staff, other community members, and so on.
Then we put all data in single framework & apply various statistical tools to find out the dynamic on the market.
During the analysis stage, feedback from the stakeholder groups would be compared to determine areas of agreement as well as areas of divergence
