

Key Insights
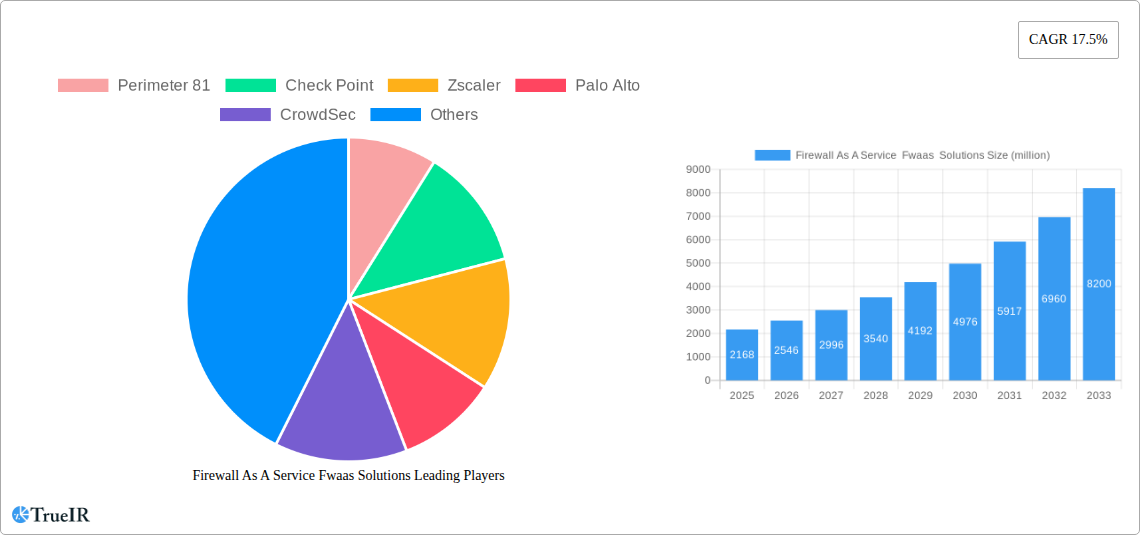
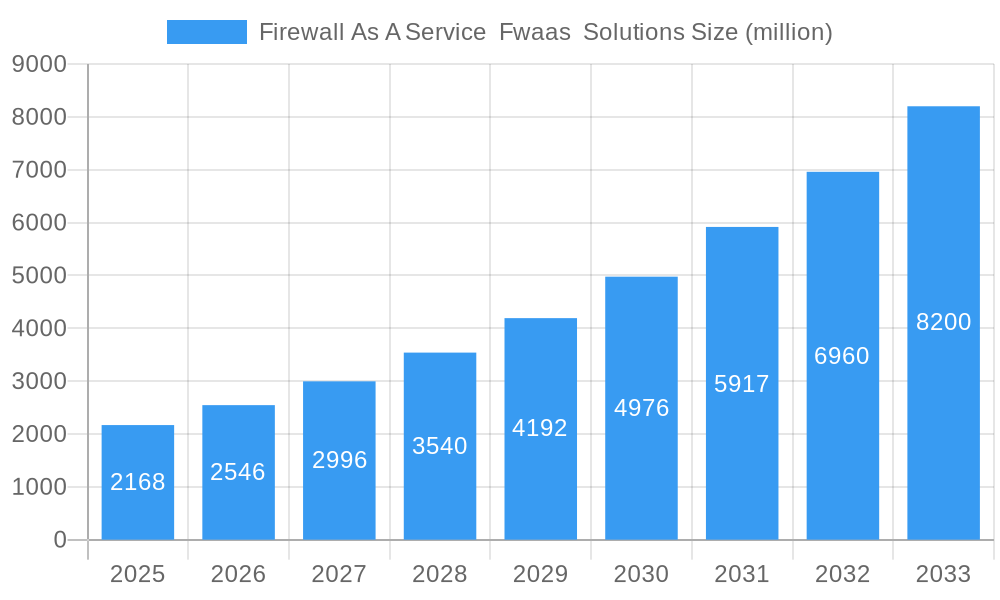
The Firewall-as-a-Service (FWaaS) market is experiencing robust growth, projected to reach $2.168 billion in 2025 and exhibiting a Compound Annual Growth Rate (CAGR) of 17.5% from 2019 to 2033. This expansion is driven by several key factors. The increasing adoption of cloud-based applications and remote work models necessitates enhanced security solutions that are easily deployable and scalable. FWaaS offers a compelling solution, eliminating the need for expensive on-premise hardware and complex maintenance. Furthermore, the rising sophistication of cyber threats and the growing need for robust security posture management are fueling demand for sophisticated, centrally managed firewall solutions that FWaaS provides. The market's competitiveness is evident with major players like Check Point, Zscaler, Palo Alto Networks, and Fortinet vying for market share alongside emerging innovative companies. The competitive landscape is likely to see further consolidation as companies seek to expand their feature sets and target wider customer segments.
Firewall As A Service Fwaas Solutions Market Size (In Billion)
The projected growth trajectory of FWaaS over the forecast period (2025-2033) indicates a significant expansion in market value. Given the 17.5% CAGR and the 2025 market size, a reasonable estimation suggests continued strong adoption. This continued growth is underpinned by the ongoing digital transformation across various industries, increasing reliance on cloud infrastructure, and the persistent need for proactive and adaptive cybersecurity measures. This suggests a lucrative opportunity for existing vendors to further invest in R&D and for new entrants to explore innovative solutions within the FWaaS landscape. Geographic expansion, particularly in developing economies with growing digital infrastructure, will further contribute to this sustained market expansion.
Firewall As A Service Fwaas Solutions Company Market Share
Firewall as a Service (FWaaS) Solutions Market Report: 2019-2033
This comprehensive report provides a detailed analysis of the Firewall as a Service (FWaaS) solutions market, projecting a multi-million dollar valuation by 2033. The study covers the period from 2019 to 2033, with 2025 serving as both the base and estimated year. The report offers invaluable insights into market structure, competitive dynamics, key trends, and future growth prospects, making it an essential resource for industry stakeholders.
Firewall As A Service (FWaaS) Solutions Market Structure & Competitive Landscape
The FWaaS market exhibits a moderately concentrated structure, with several key players commanding significant market share. The Herfindahl-Hirschman Index (HHI) for 2024 is estimated at xx, indicating a moderately competitive landscape. Innovation is a major driver, fueled by advancements in cloud computing, AI, and machine learning. Regulatory frameworks like GDPR and CCPA influence security practices, while emerging technologies like SD-WAN pose both opportunities and challenges. Substitutes include traditional on-premises firewalls, but cloud-based solutions are increasingly preferred for scalability and cost-effectiveness.
The market is segmented based on enterprise size (SMB, mid-market, and large enterprises), deployment model (public cloud, private cloud, hybrid cloud), and industry vertical (BFSI, healthcare, retail, etc.). M&A activity has been significant in recent years, with xx deals recorded between 2019 and 2024, valuing approximately $xx million. These acquisitions reflect the strategic importance of FWaaS in bolstering security portfolios and expanding market reach. Concentration is expected to increase slightly by 2033 due to continued M&A activity and the consolidation of smaller players.
- Market Concentration: Moderately concentrated, with an estimated HHI of xx in 2024.
- Innovation Drivers: Cloud computing, AI, Machine Learning, SD-WAN.
- Regulatory Impacts: GDPR, CCPA influence security standards.
- Product Substitutes: Traditional on-premises firewalls.
- End-User Segmentation: SMBs, mid-market, large enterprises, across various industry verticals.
- M&A Trends: xx deals between 2019-2024, valued at approximately $xx million.
Firewall As A Service (FWaaS) Solutions Market Trends & Opportunities
The global FWaaS market is experiencing robust growth, with an estimated market size of $xx million in 2025. The Compound Annual Growth Rate (CAGR) from 2025 to 2033 is projected to be xx%, driven by the increasing adoption of cloud-based services, rising cyber threats, and the need for enhanced network security. Market penetration is currently at xx% and is expected to reach xx% by 2033. Technological advancements like AI-powered threat detection and automated security orchestration are reshaping the market landscape, creating new opportunities for vendors offering advanced capabilities. Consumer preferences are shifting towards solutions that provide enhanced scalability, ease of management, and cost-effectiveness. The competitive landscape is highly dynamic, with companies continuously innovating to differentiate their offerings and expand their market share. These factors collectively contribute to the significant growth potential of the FWaaS market.
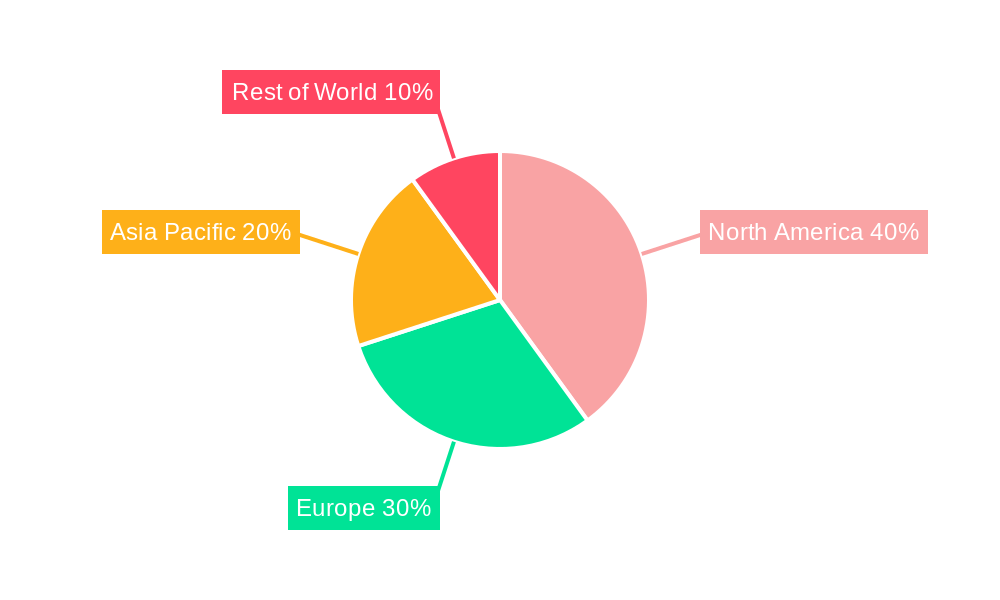
Dominant Markets & Segments in Firewall As A Service (FWaaS) Solutions
North America currently holds the dominant position in the FWaaS market, driven by high cloud adoption rates, robust IT infrastructure, and a stringent regulatory environment that emphasizes data protection. This region is expected to maintain its leadership throughout the forecast period. Within North America, the United States is the largest market, owing to a highly developed IT sector and high cybersecurity awareness among enterprises. However, significant growth opportunities exist in the Asia-Pacific region, particularly in developing economies like India and China, where increasing digitalization and rising cyber threats are driving demand for FWaaS solutions.
- Key Growth Drivers in North America:
- Advanced cloud infrastructure.
- Stringent data protection regulations.
- High cybersecurity awareness.
- Key Growth Drivers in Asia-Pacific:
- Rapid digitalization and e-commerce growth.
- Increasing cyber threats.
- Government initiatives promoting cybersecurity.
The enterprise segment constitutes the largest market share, driven by the extensive security needs of large organizations. However, the small and medium-sized business (SMB) segment is expected to witness substantial growth due to increasing cyberattacks targeting smaller companies and the accessibility of cost-effective FWaaS solutions.
Firewall As A Service (FWaaS) Solutions Product Analysis
FWaaS solutions offer a range of features, including advanced threat prevention, next-generation firewall capabilities, intrusion detection and prevention, and secure web gateways. The market is characterized by continuous innovation, with vendors incorporating AI and machine learning to enhance threat detection and response capabilities. This focus on proactive security and automation is a key competitive advantage, attracting customers who value streamlined management and efficient threat mitigation. Product differentiation is largely driven by specific features like integration with other security tools, granular control capabilities, and user-friendly interfaces.
Key Drivers, Barriers & Challenges in Firewall As A Service (FWaaS) Solutions
Key Drivers: The rising prevalence of cyber threats, increasing adoption of cloud services, and the need for cost-effective and scalable security solutions are major drivers of FWaaS market growth. Government regulations mandating data protection further fuel demand. Technological advancements such as AI-driven threat detection and automation also contribute significantly.
Challenges & Restraints: Integration complexities with existing security infrastructure, concerns about data privacy and security, and the need for skilled personnel to manage FWaaS solutions pose challenges to market growth. Competition among vendors, vendor lock-in concerns, and the potential for service disruptions impact market adoption. The cost of implementation and maintenance, especially for smaller businesses, represents another constraint. Furthermore, evolving cyberthreats require constant upgrades and updates, potentially leading to increased costs and security vulnerabilities if not properly managed.
Growth Drivers in the Firewall As A Service Fwaas Solutions Market
The increasing adoption of cloud computing, rising cyber security threats, and growing demand for scalable and cost-effective security solutions are key growth drivers. Technological advancements like AI-powered threat detection are significantly impacting the market's expansion. Furthermore, stringent government regulations regarding data security are propelling the market's growth.
Challenges Impacting Firewall As A Service Fwaas Solutions Growth
Key challenges include the complexity of integrating FWaaS with existing IT infrastructure, concerns around data privacy and security, and the need for skilled professionals to manage these services. The competitive landscape also presents challenges, as vendors continuously strive for differentiation in a market saturated with solutions. Finally, the cost of implementation and maintenance can act as a barrier, especially for smaller businesses.
Key Players Shaping the Firewall As A Service Fwaas Solutions Market
- Perimeter 81
- Check Point
- Zscaler
- Palo Alto Networks
- CrowdSec
- Sophos Firewall
- FortiGate (Fortinet)
- ZoneAlarm
- Cisco
- Barracuda
- Cato Networks
- Cloudflare
- Perimeter
- CrowdStrike
- Fortinet
- GFI Software
- KerioControl
Significant Firewall As A Service (FWaaS) Solutions Industry Milestones
- 2020: Increased adoption of FWaaS driven by the shift to remote work during the COVID-19 pandemic.
- 2021: Several major FWaaS vendors integrated AI and Machine Learning capabilities into their products.
- 2022: Significant M&A activity among FWaaS providers.
- 2023: Focus shifted to zero-trust security models and improved integration with SD-WAN solutions.
- 2024: Launch of several new FWaaS solutions with enhanced threat detection capabilities.
Future Outlook for Firewall As A Service Fwaas Solutions Market
The FWaaS market is poised for sustained growth, fueled by increasing cyber threats, rising cloud adoption, and ongoing technological advancements. The integration of AI, automation, and zero-trust security principles will further enhance the capabilities of FWaaS solutions, driving market expansion. Strategic partnerships and collaborations among vendors and other technology providers will open new avenues for growth and innovation. The market is expected to witness considerable consolidation, with larger players acquiring smaller vendors to expand their market share and product portfolios. Overall, the outlook for the FWaaS market remains positive, with considerable potential for growth over the coming decade.
Firewall As A Service Fwaas Solutions Segmentation
-
1. Application
- 1.1. Large Size Enterprises
- 1.2. SMBs
-
2. Type
- 2.1. BFSI
- 2.2. Retail
- 2.3. IT & Telecommunication
- 2.4. Healthcare
- 2.5. Energy & Utilities
- 2.6. Government
- 2.7. Manufacturing
- 2.8. Education
- 2.9. Others
Firewall As A Service Fwaas Solutions Segmentation By Geography
-
1. North America
- 1.1. United States
- 1.2. Canada
- 1.3. Mexico
-
2. South America
- 2.1. Brazil
- 2.2. Argentina
- 2.3. Rest of South America
-
3. Europe
- 3.1. United Kingdom
- 3.2. Germany
- 3.3. France
- 3.4. Italy
- 3.5. Spain
- 3.6. Russia
- 3.7. Benelux
- 3.8. Nordics
- 3.9. Rest of Europe
-
4. Middle East & Africa
- 4.1. Turkey
- 4.2. Israel
- 4.3. GCC
- 4.4. North Africa
- 4.5. South Africa
- 4.6. Rest of Middle East & Africa
-
5. Asia Pacific
- 5.1. China
- 5.2. India
- 5.3. Japan
- 5.4. South Korea
- 5.5. ASEAN
- 5.6. Oceania
- 5.7. Rest of Asia Pacific
Firewall As A Service Fwaas Solutions Regional Market Share
Geographic Coverage of Firewall As A Service Fwaas Solutions
Firewall As A Service Fwaas Solutions REPORT HIGHLIGHTS
| Aspects | Details |
|---|---|
| Study Period | 2020-2034 |
| Base Year | 2025 |
| Estimated Year | 2026 |
| Forecast Period | 2026-2034 |
| Historical Period | 2020-2025 |
| Growth Rate | CAGR of 17.5% from 2020-2034 |
| Segmentation |
|
Table of Contents
- 1. Introduction
- 1.1. Research Scope
- 1.2. Market Segmentation
- 1.3. Research Methodology
- 1.4. Definitions and Assumptions
- 2. Executive Summary
- 2.1. Introduction
- 3. Market Dynamics
- 3.1. Introduction
- 3.2. Market Drivers
- 3.3. Market Restrains
- 3.4. Market Trends
- 4. Market Factor Analysis
- 4.1. Porters Five Forces
- 4.2. Supply/Value Chain
- 4.3. PESTEL analysis
- 4.4. Market Entropy
- 4.5. Patent/Trademark Analysis
- 5. Global Firewall As A Service Fwaas Solutions Analysis, Insights and Forecast, 2020-2032
- 5.1. Market Analysis, Insights and Forecast - by Application
- 5.1.1. Large Size Enterprises
- 5.1.2. SMBs
- 5.2. Market Analysis, Insights and Forecast - by Type
- 5.2.1. BFSI
- 5.2.2. Retail
- 5.2.3. IT & Telecommunication
- 5.2.4. Healthcare
- 5.2.5. Energy & Utilities
- 5.2.6. Government
- 5.2.7. Manufacturing
- 5.2.8. Education
- 5.2.9. Others
- 5.3. Market Analysis, Insights and Forecast - by Region
- 5.3.1. North America
- 5.3.2. South America
- 5.3.3. Europe
- 5.3.4. Middle East & Africa
- 5.3.5. Asia Pacific
- 5.1. Market Analysis, Insights and Forecast - by Application
- 6. North America Firewall As A Service Fwaas Solutions Analysis, Insights and Forecast, 2020-2032
- 6.1. Market Analysis, Insights and Forecast - by Application
- 6.1.1. Large Size Enterprises
- 6.1.2. SMBs
- 6.2. Market Analysis, Insights and Forecast - by Type
- 6.2.1. BFSI
- 6.2.2. Retail
- 6.2.3. IT & Telecommunication
- 6.2.4. Healthcare
- 6.2.5. Energy & Utilities
- 6.2.6. Government
- 6.2.7. Manufacturing
- 6.2.8. Education
- 6.2.9. Others
- 6.1. Market Analysis, Insights and Forecast - by Application
- 7. South America Firewall As A Service Fwaas Solutions Analysis, Insights and Forecast, 2020-2032
- 7.1. Market Analysis, Insights and Forecast - by Application
- 7.1.1. Large Size Enterprises
- 7.1.2. SMBs
- 7.2. Market Analysis, Insights and Forecast - by Type
- 7.2.1. BFSI
- 7.2.2. Retail
- 7.2.3. IT & Telecommunication
- 7.2.4. Healthcare
- 7.2.5. Energy & Utilities
- 7.2.6. Government
- 7.2.7. Manufacturing
- 7.2.8. Education
- 7.2.9. Others
- 7.1. Market Analysis, Insights and Forecast - by Application
- 8. Europe Firewall As A Service Fwaas Solutions Analysis, Insights and Forecast, 2020-2032
- 8.1. Market Analysis, Insights and Forecast - by Application
- 8.1.1. Large Size Enterprises
- 8.1.2. SMBs
- 8.2. Market Analysis, Insights and Forecast - by Type
- 8.2.1. BFSI
- 8.2.2. Retail
- 8.2.3. IT & Telecommunication
- 8.2.4. Healthcare
- 8.2.5. Energy & Utilities
- 8.2.6. Government
- 8.2.7. Manufacturing
- 8.2.8. Education
- 8.2.9. Others
- 8.1. Market Analysis, Insights and Forecast - by Application
- 9. Middle East & Africa Firewall As A Service Fwaas Solutions Analysis, Insights and Forecast, 2020-2032
- 9.1. Market Analysis, Insights and Forecast - by Application
- 9.1.1. Large Size Enterprises
- 9.1.2. SMBs
- 9.2. Market Analysis, Insights and Forecast - by Type
- 9.2.1. BFSI
- 9.2.2. Retail
- 9.2.3. IT & Telecommunication
- 9.2.4. Healthcare
- 9.2.5. Energy & Utilities
- 9.2.6. Government
- 9.2.7. Manufacturing
- 9.2.8. Education
- 9.2.9. Others
- 9.1. Market Analysis, Insights and Forecast - by Application
- 10. Asia Pacific Firewall As A Service Fwaas Solutions Analysis, Insights and Forecast, 2020-2032
- 10.1. Market Analysis, Insights and Forecast - by Application
- 10.1.1. Large Size Enterprises
- 10.1.2. SMBs
- 10.2. Market Analysis, Insights and Forecast - by Type
- 10.2.1. BFSI
- 10.2.2. Retail
- 10.2.3. IT & Telecommunication
- 10.2.4. Healthcare
- 10.2.5. Energy & Utilities
- 10.2.6. Government
- 10.2.7. Manufacturing
- 10.2.8. Education
- 10.2.9. Others
- 10.1. Market Analysis, Insights and Forecast - by Application
- 11. Competitive Analysis
- 11.1. Global Market Share Analysis 2025
- 11.2. Company Profiles
- 11.2.1 Perimeter 81
- 11.2.1.1. Overview
- 11.2.1.2. Products
- 11.2.1.3. SWOT Analysis
- 11.2.1.4. Recent Developments
- 11.2.1.5. Financials (Based on Availability)
- 11.2.2 Check Point
- 11.2.2.1. Overview
- 11.2.2.2. Products
- 11.2.2.3. SWOT Analysis
- 11.2.2.4. Recent Developments
- 11.2.2.5. Financials (Based on Availability)
- 11.2.3 Zscaler
- 11.2.3.1. Overview
- 11.2.3.2. Products
- 11.2.3.3. SWOT Analysis
- 11.2.3.4. Recent Developments
- 11.2.3.5. Financials (Based on Availability)
- 11.2.4 Palo Alto
- 11.2.4.1. Overview
- 11.2.4.2. Products
- 11.2.4.3. SWOT Analysis
- 11.2.4.4. Recent Developments
- 11.2.4.5. Financials (Based on Availability)
- 11.2.5 CrowdSec
- 11.2.5.1. Overview
- 11.2.5.2. Products
- 11.2.5.3. SWOT Analysis
- 11.2.5.4. Recent Developments
- 11.2.5.5. Financials (Based on Availability)
- 11.2.6 Sophos Firewall
- 11.2.6.1. Overview
- 11.2.6.2. Products
- 11.2.6.3. SWOT Analysis
- 11.2.6.4. Recent Developments
- 11.2.6.5. Financials (Based on Availability)
- 11.2.7 FortiGate
- 11.2.7.1. Overview
- 11.2.7.2. Products
- 11.2.7.3. SWOT Analysis
- 11.2.7.4. Recent Developments
- 11.2.7.5. Financials (Based on Availability)
- 11.2.8 ZoneAlarm
- 11.2.8.1. Overview
- 11.2.8.2. Products
- 11.2.8.3. SWOT Analysis
- 11.2.8.4. Recent Developments
- 11.2.8.5. Financials (Based on Availability)
- 11.2.9 Cisco
- 11.2.9.1. Overview
- 11.2.9.2. Products
- 11.2.9.3. SWOT Analysis
- 11.2.9.4. Recent Developments
- 11.2.9.5. Financials (Based on Availability)
- 11.2.10 Barracuda
- 11.2.10.1. Overview
- 11.2.10.2. Products
- 11.2.10.3. SWOT Analysis
- 11.2.10.4. Recent Developments
- 11.2.10.5. Financials (Based on Availability)
- 11.2.11 Cato Networks
- 11.2.11.1. Overview
- 11.2.11.2. Products
- 11.2.11.3. SWOT Analysis
- 11.2.11.4. Recent Developments
- 11.2.11.5. Financials (Based on Availability)
- 11.2.12 Cloudflare
- 11.2.12.1. Overview
- 11.2.12.2. Products
- 11.2.12.3. SWOT Analysis
- 11.2.12.4. Recent Developments
- 11.2.12.5. Financials (Based on Availability)
- 11.2.13 Perimeter
- 11.2.13.1. Overview
- 11.2.13.2. Products
- 11.2.13.3. SWOT Analysis
- 11.2.13.4. Recent Developments
- 11.2.13.5. Financials (Based on Availability)
- 11.2.14 CrowdStrike
- 11.2.14.1. Overview
- 11.2.14.2. Products
- 11.2.14.3. SWOT Analysis
- 11.2.14.4. Recent Developments
- 11.2.14.5. Financials (Based on Availability)
- 11.2.15 Fortinet
- 11.2.15.1. Overview
- 11.2.15.2. Products
- 11.2.15.3. SWOT Analysis
- 11.2.15.4. Recent Developments
- 11.2.15.5. Financials (Based on Availability)
- 11.2.16 GFI Software
- 11.2.16.1. Overview
- 11.2.16.2. Products
- 11.2.16.3. SWOT Analysis
- 11.2.16.4. Recent Developments
- 11.2.16.5. Financials (Based on Availability)
- 11.2.17 KerioControl
- 11.2.17.1. Overview
- 11.2.17.2. Products
- 11.2.17.3. SWOT Analysis
- 11.2.17.4. Recent Developments
- 11.2.17.5. Financials (Based on Availability)
- 11.2.1 Perimeter 81
List of Figures
- Figure 1: Global Firewall As A Service Fwaas Solutions Revenue Breakdown (million, %) by Region 2025 & 2033
- Figure 2: North America Firewall As A Service Fwaas Solutions Revenue (million), by Application 2025 & 2033
- Figure 3: North America Firewall As A Service Fwaas Solutions Revenue Share (%), by Application 2025 & 2033
- Figure 4: North America Firewall As A Service Fwaas Solutions Revenue (million), by Type 2025 & 2033
- Figure 5: North America Firewall As A Service Fwaas Solutions Revenue Share (%), by Type 2025 & 2033
- Figure 6: North America Firewall As A Service Fwaas Solutions Revenue (million), by Country 2025 & 2033
- Figure 7: North America Firewall As A Service Fwaas Solutions Revenue Share (%), by Country 2025 & 2033
- Figure 8: South America Firewall As A Service Fwaas Solutions Revenue (million), by Application 2025 & 2033
- Figure 9: South America Firewall As A Service Fwaas Solutions Revenue Share (%), by Application 2025 & 2033
- Figure 10: South America Firewall As A Service Fwaas Solutions Revenue (million), by Type 2025 & 2033
- Figure 11: South America Firewall As A Service Fwaas Solutions Revenue Share (%), by Type 2025 & 2033
- Figure 12: South America Firewall As A Service Fwaas Solutions Revenue (million), by Country 2025 & 2033
- Figure 13: South America Firewall As A Service Fwaas Solutions Revenue Share (%), by Country 2025 & 2033
- Figure 14: Europe Firewall As A Service Fwaas Solutions Revenue (million), by Application 2025 & 2033
- Figure 15: Europe Firewall As A Service Fwaas Solutions Revenue Share (%), by Application 2025 & 2033
- Figure 16: Europe Firewall As A Service Fwaas Solutions Revenue (million), by Type 2025 & 2033
- Figure 17: Europe Firewall As A Service Fwaas Solutions Revenue Share (%), by Type 2025 & 2033
- Figure 18: Europe Firewall As A Service Fwaas Solutions Revenue (million), by Country 2025 & 2033
- Figure 19: Europe Firewall As A Service Fwaas Solutions Revenue Share (%), by Country 2025 & 2033
- Figure 20: Middle East & Africa Firewall As A Service Fwaas Solutions Revenue (million), by Application 2025 & 2033
- Figure 21: Middle East & Africa Firewall As A Service Fwaas Solutions Revenue Share (%), by Application 2025 & 2033
- Figure 22: Middle East & Africa Firewall As A Service Fwaas Solutions Revenue (million), by Type 2025 & 2033
- Figure 23: Middle East & Africa Firewall As A Service Fwaas Solutions Revenue Share (%), by Type 2025 & 2033
- Figure 24: Middle East & Africa Firewall As A Service Fwaas Solutions Revenue (million), by Country 2025 & 2033
- Figure 25: Middle East & Africa Firewall As A Service Fwaas Solutions Revenue Share (%), by Country 2025 & 2033
- Figure 26: Asia Pacific Firewall As A Service Fwaas Solutions Revenue (million), by Application 2025 & 2033
- Figure 27: Asia Pacific Firewall As A Service Fwaas Solutions Revenue Share (%), by Application 2025 & 2033
- Figure 28: Asia Pacific Firewall As A Service Fwaas Solutions Revenue (million), by Type 2025 & 2033
- Figure 29: Asia Pacific Firewall As A Service Fwaas Solutions Revenue Share (%), by Type 2025 & 2033
- Figure 30: Asia Pacific Firewall As A Service Fwaas Solutions Revenue (million), by Country 2025 & 2033
- Figure 31: Asia Pacific Firewall As A Service Fwaas Solutions Revenue Share (%), by Country 2025 & 2033
List of Tables
- Table 1: Global Firewall As A Service Fwaas Solutions Revenue million Forecast, by Application 2020 & 2033
- Table 2: Global Firewall As A Service Fwaas Solutions Revenue million Forecast, by Type 2020 & 2033
- Table 3: Global Firewall As A Service Fwaas Solutions Revenue million Forecast, by Region 2020 & 2033
- Table 4: Global Firewall As A Service Fwaas Solutions Revenue million Forecast, by Application 2020 & 2033
- Table 5: Global Firewall As A Service Fwaas Solutions Revenue million Forecast, by Type 2020 & 2033
- Table 6: Global Firewall As A Service Fwaas Solutions Revenue million Forecast, by Country 2020 & 2033
- Table 7: United States Firewall As A Service Fwaas Solutions Revenue (million) Forecast, by Application 2020 & 2033
- Table 8: Canada Firewall As A Service Fwaas Solutions Revenue (million) Forecast, by Application 2020 & 2033
- Table 9: Mexico Firewall As A Service Fwaas Solutions Revenue (million) Forecast, by Application 2020 & 2033
- Table 10: Global Firewall As A Service Fwaas Solutions Revenue million Forecast, by Application 2020 & 2033
- Table 11: Global Firewall As A Service Fwaas Solutions Revenue million Forecast, by Type 2020 & 2033
- Table 12: Global Firewall As A Service Fwaas Solutions Revenue million Forecast, by Country 2020 & 2033
- Table 13: Brazil Firewall As A Service Fwaas Solutions Revenue (million) Forecast, by Application 2020 & 2033
- Table 14: Argentina Firewall As A Service Fwaas Solutions Revenue (million) Forecast, by Application 2020 & 2033
- Table 15: Rest of South America Firewall As A Service Fwaas Solutions Revenue (million) Forecast, by Application 2020 & 2033
- Table 16: Global Firewall As A Service Fwaas Solutions Revenue million Forecast, by Application 2020 & 2033
- Table 17: Global Firewall As A Service Fwaas Solutions Revenue million Forecast, by Type 2020 & 2033
- Table 18: Global Firewall As A Service Fwaas Solutions Revenue million Forecast, by Country 2020 & 2033
- Table 19: United Kingdom Firewall As A Service Fwaas Solutions Revenue (million) Forecast, by Application 2020 & 2033
- Table 20: Germany Firewall As A Service Fwaas Solutions Revenue (million) Forecast, by Application 2020 & 2033
- Table 21: France Firewall As A Service Fwaas Solutions Revenue (million) Forecast, by Application 2020 & 2033
- Table 22: Italy Firewall As A Service Fwaas Solutions Revenue (million) Forecast, by Application 2020 & 2033
- Table 23: Spain Firewall As A Service Fwaas Solutions Revenue (million) Forecast, by Application 2020 & 2033
- Table 24: Russia Firewall As A Service Fwaas Solutions Revenue (million) Forecast, by Application 2020 & 2033
- Table 25: Benelux Firewall As A Service Fwaas Solutions Revenue (million) Forecast, by Application 2020 & 2033
- Table 26: Nordics Firewall As A Service Fwaas Solutions Revenue (million) Forecast, by Application 2020 & 2033
- Table 27: Rest of Europe Firewall As A Service Fwaas Solutions Revenue (million) Forecast, by Application 2020 & 2033
- Table 28: Global Firewall As A Service Fwaas Solutions Revenue million Forecast, by Application 2020 & 2033
- Table 29: Global Firewall As A Service Fwaas Solutions Revenue million Forecast, by Type 2020 & 2033
- Table 30: Global Firewall As A Service Fwaas Solutions Revenue million Forecast, by Country 2020 & 2033
- Table 31: Turkey Firewall As A Service Fwaas Solutions Revenue (million) Forecast, by Application 2020 & 2033
- Table 32: Israel Firewall As A Service Fwaas Solutions Revenue (million) Forecast, by Application 2020 & 2033
- Table 33: GCC Firewall As A Service Fwaas Solutions Revenue (million) Forecast, by Application 2020 & 2033
- Table 34: North Africa Firewall As A Service Fwaas Solutions Revenue (million) Forecast, by Application 2020 & 2033
- Table 35: South Africa Firewall As A Service Fwaas Solutions Revenue (million) Forecast, by Application 2020 & 2033
- Table 36: Rest of Middle East & Africa Firewall As A Service Fwaas Solutions Revenue (million) Forecast, by Application 2020 & 2033
- Table 37: Global Firewall As A Service Fwaas Solutions Revenue million Forecast, by Application 2020 & 2033
- Table 38: Global Firewall As A Service Fwaas Solutions Revenue million Forecast, by Type 2020 & 2033
- Table 39: Global Firewall As A Service Fwaas Solutions Revenue million Forecast, by Country 2020 & 2033
- Table 40: China Firewall As A Service Fwaas Solutions Revenue (million) Forecast, by Application 2020 & 2033
- Table 41: India Firewall As A Service Fwaas Solutions Revenue (million) Forecast, by Application 2020 & 2033
- Table 42: Japan Firewall As A Service Fwaas Solutions Revenue (million) Forecast, by Application 2020 & 2033
- Table 43: South Korea Firewall As A Service Fwaas Solutions Revenue (million) Forecast, by Application 2020 & 2033
- Table 44: ASEAN Firewall As A Service Fwaas Solutions Revenue (million) Forecast, by Application 2020 & 2033
- Table 45: Oceania Firewall As A Service Fwaas Solutions Revenue (million) Forecast, by Application 2020 & 2033
- Table 46: Rest of Asia Pacific Firewall As A Service Fwaas Solutions Revenue (million) Forecast, by Application 2020 & 2033
Frequently Asked Questions
1. What is the projected Compound Annual Growth Rate (CAGR) of the Firewall As A Service Fwaas Solutions?
The projected CAGR is approximately 17.5%.
2. Which companies are prominent players in the Firewall As A Service Fwaas Solutions?
Key companies in the market include Perimeter 81, Check Point, Zscaler, Palo Alto, CrowdSec, Sophos Firewall, FortiGate, ZoneAlarm, Cisco, Barracuda, Cato Networks, Cloudflare, Perimeter, CrowdStrike, Fortinet, GFI Software, KerioControl.
3. What are the main segments of the Firewall As A Service Fwaas Solutions?
The market segments include Application, Type.
4. Can you provide details about the market size?
The market size is estimated to be USD 2168 million as of 2022.
5. What are some drivers contributing to market growth?
N/A
6. What are the notable trends driving market growth?
N/A
7. Are there any restraints impacting market growth?
N/A
8. Can you provide examples of recent developments in the market?
N/A
9. What pricing options are available for accessing the report?
Pricing options include single-user, multi-user, and enterprise licenses priced at USD 3950.00, USD 5925.00, and USD 7900.00 respectively.
10. Is the market size provided in terms of value or volume?
The market size is provided in terms of value, measured in million.
11. Are there any specific market keywords associated with the report?
Yes, the market keyword associated with the report is "Firewall As A Service Fwaas Solutions," which aids in identifying and referencing the specific market segment covered.
12. How do I determine which pricing option suits my needs best?
The pricing options vary based on user requirements and access needs. Individual users may opt for single-user licenses, while businesses requiring broader access may choose multi-user or enterprise licenses for cost-effective access to the report.
13. Are there any additional resources or data provided in the Firewall As A Service Fwaas Solutions report?
While the report offers comprehensive insights, it's advisable to review the specific contents or supplementary materials provided to ascertain if additional resources or data are available.
14. How can I stay updated on further developments or reports in the Firewall As A Service Fwaas Solutions?
To stay informed about further developments, trends, and reports in the Firewall As A Service Fwaas Solutions, consider subscribing to industry newsletters, following relevant companies and organizations, or regularly checking reputable industry news sources and publications.
Methodology
Step 1 - Identification of Relevant Samples Size from Population Database


Step 2 - Approaches for Defining Global Market Size (Value, Volume* & Price*)

Note*: In applicable scenarios
Step 3 - Data Sources
Primary Research
- Web Analytics
- Survey Reports
- Research Institute
- Latest Research Reports
- Opinion Leaders
Secondary Research
- Annual Reports
- White Paper
- Latest Press Release
- Industry Association
- Paid Database
- Investor Presentations

Step 4 - Data Triangulation
Involves using different sources of information in order to increase the validity of a study
These sources are likely to be stakeholders in a program - participants, other researchers, program staff, other community members, and so on.
Then we put all data in single framework & apply various statistical tools to find out the dynamic on the market.
During the analysis stage, feedback from the stakeholder groups would be compared to determine areas of agreement as well as areas of divergence