

Key Insights
The Green Hydrogen for Green Fertilizer market is poised for explosive growth, projected to reach $2.79 billion by 2025, driven by an astonishing 60% CAGR. This remarkable expansion is primarily fueled by the escalating global demand for sustainable agriculture and the imperative to decarbonize fertilizer production. Green hydrogen, produced through electrolysis powered by renewable energy, offers a clean alternative to traditional methods that rely heavily on fossil fuels, thereby reducing greenhouse gas emissions significantly. Key applications driving this surge include its use in leguminous and non-leguminous green fertilizers, where it serves as a crucial component for ammonia synthesis, a cornerstone of fertilizer production. The increasing adoption of advanced electrolysis technologies, such as Alkaline (ALK) and Proton Exchange Membrane (PEM) electrolyzers, further bolsters market efficiency and scalability, paving the way for widespread adoption. Regulatory support, coupled with growing environmental consciousness among both producers and consumers, is creating a highly favorable ecosystem for green hydrogen in the fertilizer sector.
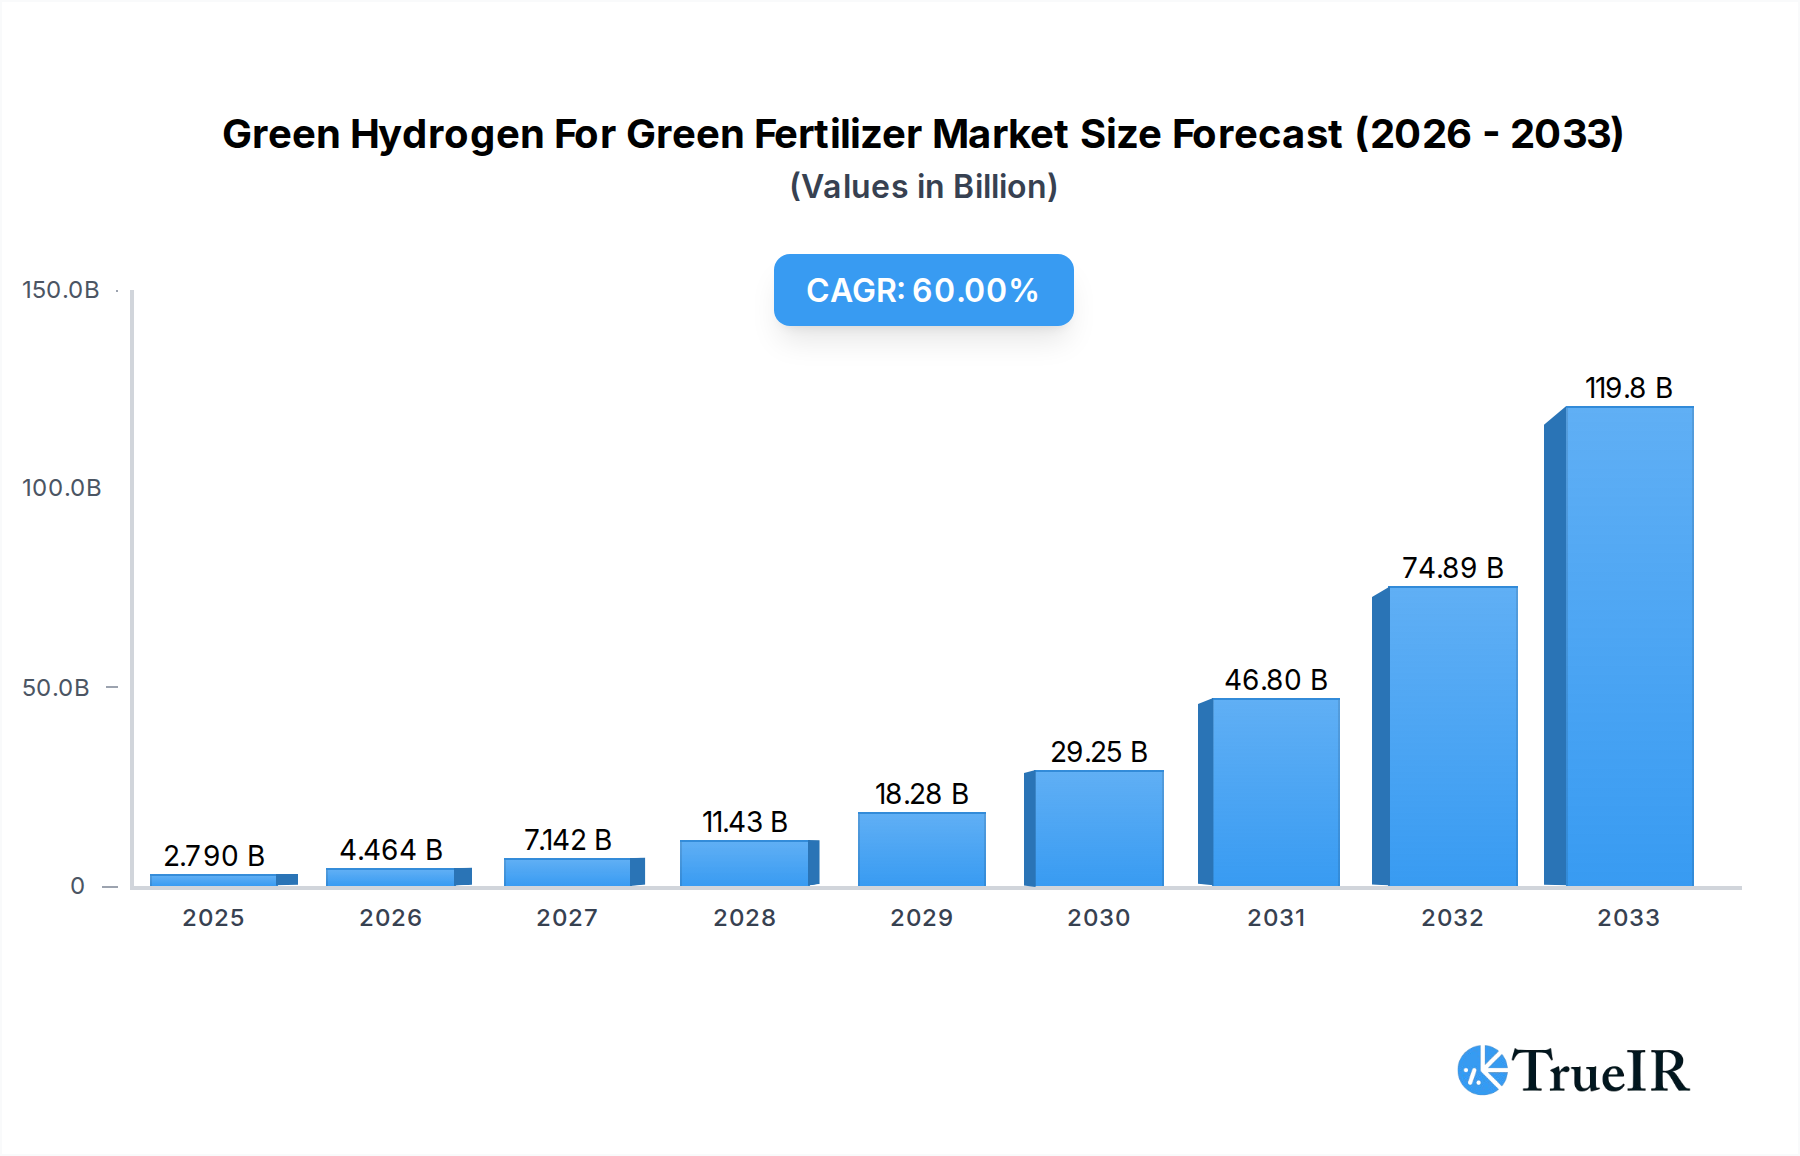
Green Hydrogen For Green Fertilizer Market Size (In Billion)
Despite the immense potential, certain restraints exist, including the high initial capital investment required for green hydrogen infrastructure and the ongoing need for cost optimization to achieve parity with conventional fertilizer production. However, these challenges are being actively addressed through technological advancements, supportive government policies, and strategic collaborations among key industry players like Siemens Energy, Iberdrola, and Fertiglobe. The market is characterized by significant investments in research and development, aimed at improving electrolyzer efficiency, reducing production costs, and integrating green hydrogen seamlessly into existing fertilizer manufacturing processes. Emerging trends such as the development of decentralized green hydrogen production facilities and the circular economy approach in fertilizer manufacturing are also expected to shape the market landscape, promising a cleaner and more sustainable future for global food production.

Green Hydrogen For Green Fertilizer Company Market Share
This comprehensive report offers an in-depth analysis of the burgeoning Green Hydrogen for Green Fertilizer market. Spanning a study period from 2019 to 2033, with a base year of 2025 and a forecast period from 2025 to 2033, this report provides critical insights into market dynamics, growth trajectories, and strategic opportunities. Leveraging high-volume keywords and detailed quantitative and qualitative data, this report is an essential resource for industry stakeholders, investors, and policymakers seeking to navigate and capitalize on the transformation of the fertilizer industry driven by sustainable hydrogen production.
Green Hydrogen For Green Fertilizer Market Structure & Competitive Landscape
The Green Hydrogen for Green Fertilizer market exhibits a dynamic and evolving structure, characterized by increasing fragmentation and a growing number of innovative players. Market concentration is moderate, with key companies investing heavily in research and development to enhance electrolyzer efficiency and reduce production costs of green hydrogen. Innovation drivers include advancements in Alkaline (ALK) and Proton Exchange Membrane (PEM) electrolyzer technologies, coupled with the urgent need for decarbonization in the agricultural sector. Regulatory impacts are significant, with government incentives and mandates for renewable energy integration pushing for the adoption of green hydrogen in fertilizer production. Product substitutes, primarily conventional ammonia produced from natural gas, are facing increasing scrutiny and pressure due to their carbon footprint.
The end-user segmentation is primarily divided between the production of Leguminous Green Fertilizer and Non-Leguminous Green Fertilizer, both of which are crucial for global food security. Mergers and acquisitions (M&A) trends are on the rise as established chemical companies and energy giants seek to secure their position in this nascent but rapidly expanding market. For instance, the volume of M&A deals in the green hydrogen sector has seen a substantial increase, projected to exceed twenty billion dollars in the historical period (2019-2024). This consolidation aims to leverage synergies, accelerate technological deployment, and achieve economies of scale. The market concentration ratio, as measured by the top five players' market share, is estimated to be around 30% in the base year 2025, indicating room for further growth and competition.
Green Hydrogen For Green Fertilizer Market Trends & Opportunities
The Green Hydrogen for Green Fertilizer market is poised for exponential growth, driven by a confluence of environmental imperatives, technological advancements, and shifting consumer preferences towards sustainable agriculture. The global market size for green hydrogen in fertilizer production is projected to surge from an estimated 50 billion dollars in 2025 to over 250 billion dollars by 2033, representing a Compound Annual Growth Rate (CAGR) of approximately 22%. This robust expansion is underpinned by a significant shift away from conventional, fossil fuel-based ammonia production, which contributes substantially to global greenhouse gas emissions. As governments worldwide implement stricter climate policies and carbon pricing mechanisms, the economic viability and competitive advantage of green ammonia production are rapidly increasing.
Technological shifts are central to this growth narrative. The continuous improvement in the efficiency and cost-effectiveness of electrolyzer technologies, particularly PEM and Alkaline systems, is making green hydrogen production more accessible and scalable. Innovations in electrolyzer design, such as increased durability, reduced reliance on critical raw materials, and enhanced energy conversion rates, are directly translating into lower green ammonia prices. Furthermore, the integration of renewable energy sources like solar and wind power with electrolyzer facilities is becoming more sophisticated, ensuring a consistent and cost-competitive supply of green hydrogen.
Consumer preferences are also playing a pivotal role. Farmers, food processors, and ultimately consumers are increasingly demanding sustainably produced food, which in turn drives the demand for green fertilizers. This "green premium" is compelling fertilizer manufacturers to invest in cleaner production methods. Companies that can offer verifiably sustainable fertilizer products are likely to gain significant market share and brand loyalty. The competitive landscape is intensifying, with established players and new entrants vying for dominance. Strategic partnerships between hydrogen producers, fertilizer manufacturers, and renewable energy developers are becoming commonplace, fostering innovation and accelerating market penetration. The market penetration rate of green fertilizers, though still nascent, is expected to grow from less than 5% in 2025 to over 30% by 2033. This trend presents a substantial opportunity for early movers and agile organizations to capture significant market share by offering innovative and sustainable fertilizer solutions.
Dominant Markets & Segments in Green Hydrogen For Green Fertilizer
The Green Hydrogen for Green Fertilizer market's dominance is being shaped by a combination of regional policies, infrastructure development, and segment-specific demand. Asia-Pacific is emerging as a leading region, driven by its large agricultural output, growing population, and proactive government support for renewable energy and green hydrogen initiatives. Countries like China and India are making substantial investments in green hydrogen production capacity and fertilizer manufacturing, recognizing the strategic importance of food security and decarbonization. In terms of application, Non-Leguminous Green Fertilizer is currently the larger segment, accounting for approximately 60% of the market in 2025, due to its widespread use in staple crop cultivation. However, the Leguminous Green Fertilizer segment is experiencing a higher growth rate, fueled by advancements in nitrogen-fixing technologies and increasing adoption in sustainable farming practices.
Within the technology type, the Alkaline (ALK) Electrolyzer segment holds a dominant position, representing around 55% of the market share in 2025. This is largely due to its maturity, lower initial capital costs, and established track record in industrial hydrogen production. However, the Proton Exchange Membrane (PEM) Electrolyzer segment is rapidly gaining traction and is projected to capture a significant portion of the market by 2033, owing to its advantages in dynamic operation, higher energy efficiency, and compact design, which are crucial for grid integration and distributed hydrogen production. The "Others" category, encompassing technologies like Solid Oxide Electrolyzer Cells (SOEC), is expected to remain a niche segment in the forecast period but holds long-term potential for specific applications.
Key growth drivers for market dominance include substantial government subsidies and tax incentives for green hydrogen projects, such as the US Hydrogen Production Tax Credit (e.g., Section 45V), which are making these investments more financially attractive. The development of dedicated green hydrogen production hubs and associated infrastructure, including pipelines and storage facilities, is critical for scaling up production and ensuring reliable supply to fertilizer plants. Furthermore, stringent environmental regulations and carbon emission targets are compelling fertilizer manufacturers to transition to greener alternatives, thereby driving demand for green ammonia. Strategic partnerships between global energy companies and local fertilizer producers are also instrumental in accelerating market penetration and ensuring the successful deployment of these innovative solutions. The market size for green fertilizers in the dominant Asia-Pacific region is estimated to reach over 100 billion dollars by 2033.
Green Hydrogen For Green Fertilizer Product Analysis
Product innovation in the Green Hydrogen for Green Fertilizer market is primarily focused on enhancing the efficiency and cost-effectiveness of green ammonia production. Key advancements include the development of more durable and energy-efficient electrolyzers, such as next-generation PEM and Alkaline systems, capable of operating at lower temperatures and pressures. These technological improvements reduce the overall energy consumption required to produce hydrogen, thereby lowering the cost of green ammonia. The application of green hydrogen extends to both Leguminous and Non-Leguminous Green Fertilizers, offering a cleaner alternative to conventionally produced ammonia. Competitive advantages lie in the reduced carbon footprint, which aligns with increasing environmental regulations and consumer demand for sustainable agricultural products. Companies are also focusing on integrated solutions, combining renewable energy generation, hydrogen production, and ammonia synthesis within a single facility to optimize operations and minimize logistical costs.
Key Drivers, Barriers & Challenges in Green Hydrogen For Green Fertilizer
The Green Hydrogen for Green Fertilizer market is propelled by several key drivers. Technological advancements in electrolyzer efficiency and cost reduction are making green hydrogen production more economically viable. Growing global emphasis on decarbonization and achieving net-zero emissions targets is creating significant policy support and regulatory push for sustainable alternatives. Government incentives, subsidies, and carbon pricing mechanisms are further bolstering investment in green hydrogen infrastructure and projects. The increasing demand for sustainable agriculture and food security, coupled with growing consumer awareness of environmental impact, is creating a strong pull from the end-user market. Strategic investments and partnerships by major industry players are accelerating market penetration and innovation.
However, the market faces significant challenges and restraints. High upfront capital costs associated with establishing green hydrogen production facilities and associated infrastructure remain a substantial barrier. The intermittent nature of renewable energy sources can lead to supply chain disruptions and necessitate expensive energy storage solutions. Regulatory complexities and the lack of standardized certification frameworks for green hydrogen and its derivatives can create uncertainty for investors and project developers. Securing a stable and cost-competitive supply of renewable electricity is also a critical challenge. Furthermore, scaling up production to meet global fertilizer demand requires substantial investment and innovation in manufacturing processes. The competitive pressure from established, low-cost conventional ammonia production methods, which benefit from existing infrastructure and economies of scale, also poses a significant challenge.
Growth Drivers in the Green Hydrogen For Green Fertilizer Market
The Green Hydrogen for Green Fertilizer market is experiencing robust growth driven by several critical factors. Technological innovation is paramount, with continuous improvements in electrolyzer efficiency, particularly in PEM and Alkaline technologies, leading to reduced production costs for green hydrogen. Economic incentives, including government subsidies, tax credits like the US Inflation Reduction Act's incentives for clean hydrogen, and favorable carbon pricing policies, are making green ammonia production more competitive. Regulatory frameworks are increasingly mandating decarbonization across industries, including agriculture, creating a strong push for sustainable fertilizer alternatives. The growing global focus on food security in the face of climate change also amplifies the need for efficient and environmentally sound agricultural practices, thereby boosting demand for green fertilizers.
Challenges Impacting Green Hydrogen For Green Fertilizer Growth
Several significant barriers and restraints are impacting the growth of the Green Hydrogen for Green Fertilizer market. The high initial capital expenditure required for green hydrogen production facilities and the necessary renewable energy infrastructure remains a considerable hurdle. Ensuring a consistent and affordable supply of renewable electricity to power electrolyzers can be challenging due to the intermittent nature of solar and wind power, often requiring substantial investment in energy storage solutions. Regulatory uncertainty and the absence of globally harmonized standards for green hydrogen certification can create hesitancy among investors and slow down project development. The established infrastructure and cost advantages of conventional ammonia production present stiff competition, and scaling up production to meet the vast global demand for fertilizers requires significant advancements in industrial processes and supply chain integration.
Key Players Shaping the Green Hydrogen For Green Fertilizer Market
- Siemens Energy
- Origin Energy Limited
- Iberdrola, S.A.
- HY2GEN AG
- Hive Energy
- Haldor Topsor A/S
- H2U Technologies, Inc.
- Fertiglobe
Significant Green Hydrogen For Green Fertilizer Industry Milestones
- 2019: First large-scale green hydrogen production facility for ammonia synthesis announced in Europe, signaling early industry commitment.
- 2020: Several major fertilizer producers initiate pilot projects for green ammonia production, demonstrating feasibility.
- 2021: Significant government funding announcements for green hydrogen research and development across North America and Europe.
- 2022: Key advancements in electrolyzer technology reported, achieving increased efficiency and reduced manufacturing costs.
- 2023: Major energy companies and chemical giants announce ambitious green hydrogen production targets and strategic partnerships within the fertilizer sector.
- 2024 (Projected): First commercial-scale green ammonia plants integrated with renewable energy sources are expected to come online, marking a new era in fertilizer production.
Future Outlook for Green Hydrogen For Green Fertilizer Market
The future outlook for the Green Hydrogen for Green Fertilizer market is exceptionally promising, driven by an escalating global commitment to sustainability and food security. Strategic opportunities abound for companies that can leverage technological advancements in electrolyzer technology and renewable energy integration to deliver cost-competitive green ammonia. The increasing stringency of environmental regulations and the growing demand for sustainable agricultural inputs will continue to fuel market expansion. Significant growth catalysts include further reductions in electrolyzer costs, the development of robust green hydrogen infrastructure, and supportive policy frameworks that incentivize investment and adoption. The market is anticipated to witness substantial growth in emerging economies as they prioritize decarbonization and agricultural modernization. The projected market growth is expected to reach over 300 billion dollars by 2033, representing a substantial opportunity for innovation and investment.
Green Hydrogen For Green Fertilizer Segmentation
-
1. Application
- 1.1. Leguminous Green Fertilizer
- 1.2. Non-Leguminous Green Fertilizer
-
2. Type
- 2.1. Alkaline (ALK) Electrolyzer
- 2.2. Proton Exchange Membrane (PEM) Electrolyzer
- 2.3. Others
Green Hydrogen For Green Fertilizer Segmentation By Geography
-
1. North America
- 1.1. United States
- 1.2. Canada
- 1.3. Mexico
-
2. South America
- 2.1. Brazil
- 2.2. Argentina
- 2.3. Rest of South America
-
3. Europe
- 3.1. United Kingdom
- 3.2. Germany
- 3.3. France
- 3.4. Italy
- 3.5. Spain
- 3.6. Russia
- 3.7. Benelux
- 3.8. Nordics
- 3.9. Rest of Europe
-
4. Middle East & Africa
- 4.1. Turkey
- 4.2. Israel
- 4.3. GCC
- 4.4. North Africa
- 4.5. South Africa
- 4.6. Rest of Middle East & Africa
-
5. Asia Pacific
- 5.1. China
- 5.2. India
- 5.3. Japan
- 5.4. South Korea
- 5.5. ASEAN
- 5.6. Oceania
- 5.7. Rest of Asia Pacific
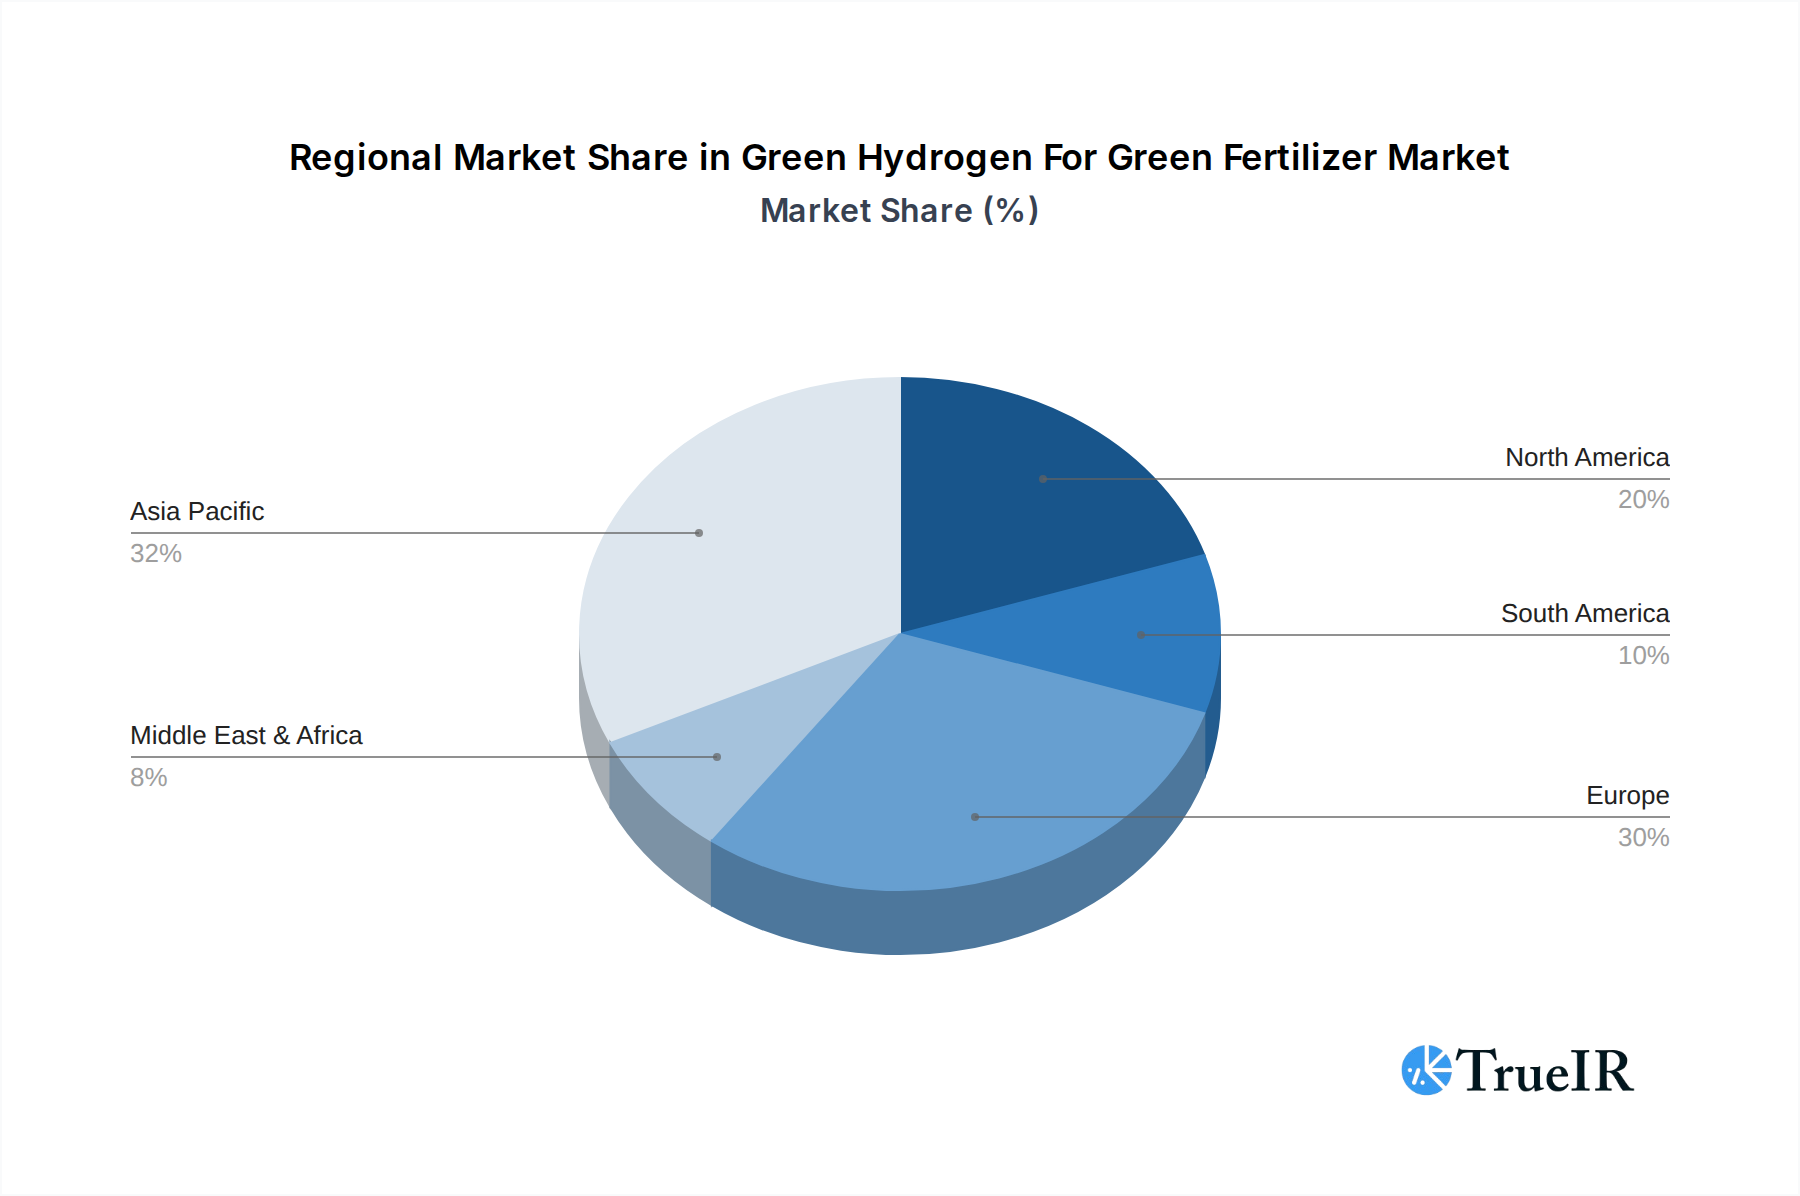
Green Hydrogen For Green Fertilizer Regional Market Share
Geographic Coverage of Green Hydrogen For Green Fertilizer
Green Hydrogen For Green Fertilizer REPORT HIGHLIGHTS
| Aspects | Details |
|---|---|
| Study Period | 2020-2034 |
| Base Year | 2025 |
| Estimated Year | 2026 |
| Forecast Period | 2026-2034 |
| Historical Period | 2020-2025 |
| Growth Rate | CAGR of 60% from 2020-2034 |
| Segmentation |
|
Table of Contents
- 1. Introduction
- 1.1. Research Scope
- 1.2. Market Segmentation
- 1.3. Research Methodology
- 1.4. Definitions and Assumptions
- 2. Executive Summary
- 2.1. Introduction
- 3. Market Dynamics
- 3.1. Introduction
- 3.2. Market Drivers
- 3.3. Market Restrains
- 3.4. Market Trends
- 4. Market Factor Analysis
- 4.1. Porters Five Forces
- 4.2. Supply/Value Chain
- 4.3. PESTEL analysis
- 4.4. Market Entropy
- 4.5. Patent/Trademark Analysis
- 5. Global Green Hydrogen For Green Fertilizer Analysis, Insights and Forecast, 2020-2032
- 5.1. Market Analysis, Insights and Forecast - by Application
- 5.1.1. Leguminous Green Fertilizer
- 5.1.2. Non-Leguminous Green Fertilizer
- 5.2. Market Analysis, Insights and Forecast - by Type
- 5.2.1. Alkaline (ALK) Electrolyzer
- 5.2.2. Proton Exchange Membrane (PEM) Electrolyzer
- 5.2.3. Others
- 5.3. Market Analysis, Insights and Forecast - by Region
- 5.3.1. North America
- 5.3.2. South America
- 5.3.3. Europe
- 5.3.4. Middle East & Africa
- 5.3.5. Asia Pacific
- 5.1. Market Analysis, Insights and Forecast - by Application
- 6. North America Green Hydrogen For Green Fertilizer Analysis, Insights and Forecast, 2020-2032
- 6.1. Market Analysis, Insights and Forecast - by Application
- 6.1.1. Leguminous Green Fertilizer
- 6.1.2. Non-Leguminous Green Fertilizer
- 6.2. Market Analysis, Insights and Forecast - by Type
- 6.2.1. Alkaline (ALK) Electrolyzer
- 6.2.2. Proton Exchange Membrane (PEM) Electrolyzer
- 6.2.3. Others
- 6.1. Market Analysis, Insights and Forecast - by Application
- 7. South America Green Hydrogen For Green Fertilizer Analysis, Insights and Forecast, 2020-2032
- 7.1. Market Analysis, Insights and Forecast - by Application
- 7.1.1. Leguminous Green Fertilizer
- 7.1.2. Non-Leguminous Green Fertilizer
- 7.2. Market Analysis, Insights and Forecast - by Type
- 7.2.1. Alkaline (ALK) Electrolyzer
- 7.2.2. Proton Exchange Membrane (PEM) Electrolyzer
- 7.2.3. Others
- 7.1. Market Analysis, Insights and Forecast - by Application
- 8. Europe Green Hydrogen For Green Fertilizer Analysis, Insights and Forecast, 2020-2032
- 8.1. Market Analysis, Insights and Forecast - by Application
- 8.1.1. Leguminous Green Fertilizer
- 8.1.2. Non-Leguminous Green Fertilizer
- 8.2. Market Analysis, Insights and Forecast - by Type
- 8.2.1. Alkaline (ALK) Electrolyzer
- 8.2.2. Proton Exchange Membrane (PEM) Electrolyzer
- 8.2.3. Others
- 8.1. Market Analysis, Insights and Forecast - by Application
- 9. Middle East & Africa Green Hydrogen For Green Fertilizer Analysis, Insights and Forecast, 2020-2032
- 9.1. Market Analysis, Insights and Forecast - by Application
- 9.1.1. Leguminous Green Fertilizer
- 9.1.2. Non-Leguminous Green Fertilizer
- 9.2. Market Analysis, Insights and Forecast - by Type
- 9.2.1. Alkaline (ALK) Electrolyzer
- 9.2.2. Proton Exchange Membrane (PEM) Electrolyzer
- 9.2.3. Others
- 9.1. Market Analysis, Insights and Forecast - by Application
- 10. Asia Pacific Green Hydrogen For Green Fertilizer Analysis, Insights and Forecast, 2020-2032
- 10.1. Market Analysis, Insights and Forecast - by Application
- 10.1.1. Leguminous Green Fertilizer
- 10.1.2. Non-Leguminous Green Fertilizer
- 10.2. Market Analysis, Insights and Forecast - by Type
- 10.2.1. Alkaline (ALK) Electrolyzer
- 10.2.2. Proton Exchange Membrane (PEM) Electrolyzer
- 10.2.3. Others
- 10.1. Market Analysis, Insights and Forecast - by Application
- 11. Competitive Analysis
- 11.1. Global Market Share Analysis 2025
- 11.2. Company Profiles
- 11.2.1 Siemens Energy
- 11.2.1.1. Overview
- 11.2.1.2. Products
- 11.2.1.3. SWOT Analysis
- 11.2.1.4. Recent Developments
- 11.2.1.5. Financials (Based on Availability)
- 11.2.2 Origin Energy Limited
- 11.2.2.1. Overview
- 11.2.2.2. Products
- 11.2.2.3. SWOT Analysis
- 11.2.2.4. Recent Developments
- 11.2.2.5. Financials (Based on Availability)
- 11.2.3 Iberdrola S.A.
- 11.2.3.1. Overview
- 11.2.3.2. Products
- 11.2.3.3. SWOT Analysis
- 11.2.3.4. Recent Developments
- 11.2.3.5. Financials (Based on Availability)
- 11.2.4 HY2GEN AG
- 11.2.4.1. Overview
- 11.2.4.2. Products
- 11.2.4.3. SWOT Analysis
- 11.2.4.4. Recent Developments
- 11.2.4.5. Financials (Based on Availability)
- 11.2.5 Hive Energy
- 11.2.5.1. Overview
- 11.2.5.2. Products
- 11.2.5.3. SWOT Analysis
- 11.2.5.4. Recent Developments
- 11.2.5.5. Financials (Based on Availability)
- 11.2.6 Haldor Topsor A/S
- 11.2.6.1. Overview
- 11.2.6.2. Products
- 11.2.6.3. SWOT Analysis
- 11.2.6.4. Recent Developments
- 11.2.6.5. Financials (Based on Availability)
- 11.2.7 H2U Technologies Inc.
- 11.2.7.1. Overview
- 11.2.7.2. Products
- 11.2.7.3. SWOT Analysis
- 11.2.7.4. Recent Developments
- 11.2.7.5. Financials (Based on Availability)
- 11.2.8 Fertiglobe
- 11.2.8.1. Overview
- 11.2.8.2. Products
- 11.2.8.3. SWOT Analysis
- 11.2.8.4. Recent Developments
- 11.2.8.5. Financials (Based on Availability)
- 11.2.1 Siemens Energy
List of Figures
- Figure 1: Global Green Hydrogen For Green Fertilizer Revenue Breakdown (undefined, %) by Region 2025 & 2033
- Figure 2: North America Green Hydrogen For Green Fertilizer Revenue (undefined), by Application 2025 & 2033
- Figure 3: North America Green Hydrogen For Green Fertilizer Revenue Share (%), by Application 2025 & 2033
- Figure 4: North America Green Hydrogen For Green Fertilizer Revenue (undefined), by Type 2025 & 2033
- Figure 5: North America Green Hydrogen For Green Fertilizer Revenue Share (%), by Type 2025 & 2033
- Figure 6: North America Green Hydrogen For Green Fertilizer Revenue (undefined), by Country 2025 & 2033
- Figure 7: North America Green Hydrogen For Green Fertilizer Revenue Share (%), by Country 2025 & 2033
- Figure 8: South America Green Hydrogen For Green Fertilizer Revenue (undefined), by Application 2025 & 2033
- Figure 9: South America Green Hydrogen For Green Fertilizer Revenue Share (%), by Application 2025 & 2033
- Figure 10: South America Green Hydrogen For Green Fertilizer Revenue (undefined), by Type 2025 & 2033
- Figure 11: South America Green Hydrogen For Green Fertilizer Revenue Share (%), by Type 2025 & 2033
- Figure 12: South America Green Hydrogen For Green Fertilizer Revenue (undefined), by Country 2025 & 2033
- Figure 13: South America Green Hydrogen For Green Fertilizer Revenue Share (%), by Country 2025 & 2033
- Figure 14: Europe Green Hydrogen For Green Fertilizer Revenue (undefined), by Application 2025 & 2033
- Figure 15: Europe Green Hydrogen For Green Fertilizer Revenue Share (%), by Application 2025 & 2033
- Figure 16: Europe Green Hydrogen For Green Fertilizer Revenue (undefined), by Type 2025 & 2033
- Figure 17: Europe Green Hydrogen For Green Fertilizer Revenue Share (%), by Type 2025 & 2033
- Figure 18: Europe Green Hydrogen For Green Fertilizer Revenue (undefined), by Country 2025 & 2033
- Figure 19: Europe Green Hydrogen For Green Fertilizer Revenue Share (%), by Country 2025 & 2033
- Figure 20: Middle East & Africa Green Hydrogen For Green Fertilizer Revenue (undefined), by Application 2025 & 2033
- Figure 21: Middle East & Africa Green Hydrogen For Green Fertilizer Revenue Share (%), by Application 2025 & 2033
- Figure 22: Middle East & Africa Green Hydrogen For Green Fertilizer Revenue (undefined), by Type 2025 & 2033
- Figure 23: Middle East & Africa Green Hydrogen For Green Fertilizer Revenue Share (%), by Type 2025 & 2033
- Figure 24: Middle East & Africa Green Hydrogen For Green Fertilizer Revenue (undefined), by Country 2025 & 2033
- Figure 25: Middle East & Africa Green Hydrogen For Green Fertilizer Revenue Share (%), by Country 2025 & 2033
- Figure 26: Asia Pacific Green Hydrogen For Green Fertilizer Revenue (undefined), by Application 2025 & 2033
- Figure 27: Asia Pacific Green Hydrogen For Green Fertilizer Revenue Share (%), by Application 2025 & 2033
- Figure 28: Asia Pacific Green Hydrogen For Green Fertilizer Revenue (undefined), by Type 2025 & 2033
- Figure 29: Asia Pacific Green Hydrogen For Green Fertilizer Revenue Share (%), by Type 2025 & 2033
- Figure 30: Asia Pacific Green Hydrogen For Green Fertilizer Revenue (undefined), by Country 2025 & 2033
- Figure 31: Asia Pacific Green Hydrogen For Green Fertilizer Revenue Share (%), by Country 2025 & 2033
List of Tables
- Table 1: Global Green Hydrogen For Green Fertilizer Revenue undefined Forecast, by Application 2020 & 2033
- Table 2: Global Green Hydrogen For Green Fertilizer Revenue undefined Forecast, by Type 2020 & 2033
- Table 3: Global Green Hydrogen For Green Fertilizer Revenue undefined Forecast, by Region 2020 & 2033
- Table 4: Global Green Hydrogen For Green Fertilizer Revenue undefined Forecast, by Application 2020 & 2033
- Table 5: Global Green Hydrogen For Green Fertilizer Revenue undefined Forecast, by Type 2020 & 2033
- Table 6: Global Green Hydrogen For Green Fertilizer Revenue undefined Forecast, by Country 2020 & 2033
- Table 7: United States Green Hydrogen For Green Fertilizer Revenue (undefined) Forecast, by Application 2020 & 2033
- Table 8: Canada Green Hydrogen For Green Fertilizer Revenue (undefined) Forecast, by Application 2020 & 2033
- Table 9: Mexico Green Hydrogen For Green Fertilizer Revenue (undefined) Forecast, by Application 2020 & 2033
- Table 10: Global Green Hydrogen For Green Fertilizer Revenue undefined Forecast, by Application 2020 & 2033
- Table 11: Global Green Hydrogen For Green Fertilizer Revenue undefined Forecast, by Type 2020 & 2033
- Table 12: Global Green Hydrogen For Green Fertilizer Revenue undefined Forecast, by Country 2020 & 2033
- Table 13: Brazil Green Hydrogen For Green Fertilizer Revenue (undefined) Forecast, by Application 2020 & 2033
- Table 14: Argentina Green Hydrogen For Green Fertilizer Revenue (undefined) Forecast, by Application 2020 & 2033
- Table 15: Rest of South America Green Hydrogen For Green Fertilizer Revenue (undefined) Forecast, by Application 2020 & 2033
- Table 16: Global Green Hydrogen For Green Fertilizer Revenue undefined Forecast, by Application 2020 & 2033
- Table 17: Global Green Hydrogen For Green Fertilizer Revenue undefined Forecast, by Type 2020 & 2033
- Table 18: Global Green Hydrogen For Green Fertilizer Revenue undefined Forecast, by Country 2020 & 2033
- Table 19: United Kingdom Green Hydrogen For Green Fertilizer Revenue (undefined) Forecast, by Application 2020 & 2033
- Table 20: Germany Green Hydrogen For Green Fertilizer Revenue (undefined) Forecast, by Application 2020 & 2033
- Table 21: France Green Hydrogen For Green Fertilizer Revenue (undefined) Forecast, by Application 2020 & 2033
- Table 22: Italy Green Hydrogen For Green Fertilizer Revenue (undefined) Forecast, by Application 2020 & 2033
- Table 23: Spain Green Hydrogen For Green Fertilizer Revenue (undefined) Forecast, by Application 2020 & 2033
- Table 24: Russia Green Hydrogen For Green Fertilizer Revenue (undefined) Forecast, by Application 2020 & 2033
- Table 25: Benelux Green Hydrogen For Green Fertilizer Revenue (undefined) Forecast, by Application 2020 & 2033
- Table 26: Nordics Green Hydrogen For Green Fertilizer Revenue (undefined) Forecast, by Application 2020 & 2033
- Table 27: Rest of Europe Green Hydrogen For Green Fertilizer Revenue (undefined) Forecast, by Application 2020 & 2033
- Table 28: Global Green Hydrogen For Green Fertilizer Revenue undefined Forecast, by Application 2020 & 2033
- Table 29: Global Green Hydrogen For Green Fertilizer Revenue undefined Forecast, by Type 2020 & 2033
- Table 30: Global Green Hydrogen For Green Fertilizer Revenue undefined Forecast, by Country 2020 & 2033
- Table 31: Turkey Green Hydrogen For Green Fertilizer Revenue (undefined) Forecast, by Application 2020 & 2033
- Table 32: Israel Green Hydrogen For Green Fertilizer Revenue (undefined) Forecast, by Application 2020 & 2033
- Table 33: GCC Green Hydrogen For Green Fertilizer Revenue (undefined) Forecast, by Application 2020 & 2033
- Table 34: North Africa Green Hydrogen For Green Fertilizer Revenue (undefined) Forecast, by Application 2020 & 2033
- Table 35: South Africa Green Hydrogen For Green Fertilizer Revenue (undefined) Forecast, by Application 2020 & 2033
- Table 36: Rest of Middle East & Africa Green Hydrogen For Green Fertilizer Revenue (undefined) Forecast, by Application 2020 & 2033
- Table 37: Global Green Hydrogen For Green Fertilizer Revenue undefined Forecast, by Application 2020 & 2033
- Table 38: Global Green Hydrogen For Green Fertilizer Revenue undefined Forecast, by Type 2020 & 2033
- Table 39: Global Green Hydrogen For Green Fertilizer Revenue undefined Forecast, by Country 2020 & 2033
- Table 40: China Green Hydrogen For Green Fertilizer Revenue (undefined) Forecast, by Application 2020 & 2033
- Table 41: India Green Hydrogen For Green Fertilizer Revenue (undefined) Forecast, by Application 2020 & 2033
- Table 42: Japan Green Hydrogen For Green Fertilizer Revenue (undefined) Forecast, by Application 2020 & 2033
- Table 43: South Korea Green Hydrogen For Green Fertilizer Revenue (undefined) Forecast, by Application 2020 & 2033
- Table 44: ASEAN Green Hydrogen For Green Fertilizer Revenue (undefined) Forecast, by Application 2020 & 2033
- Table 45: Oceania Green Hydrogen For Green Fertilizer Revenue (undefined) Forecast, by Application 2020 & 2033
- Table 46: Rest of Asia Pacific Green Hydrogen For Green Fertilizer Revenue (undefined) Forecast, by Application 2020 & 2033
Frequently Asked Questions
1. What is the projected Compound Annual Growth Rate (CAGR) of the Green Hydrogen For Green Fertilizer?
The projected CAGR is approximately 60%.
2. Which companies are prominent players in the Green Hydrogen For Green Fertilizer?
Key companies in the market include Siemens Energy, Origin Energy Limited, Iberdrola, S.A., HY2GEN AG, Hive Energy, Haldor Topsor A/S, H2U Technologies, Inc., Fertiglobe.
3. What are the main segments of the Green Hydrogen For Green Fertilizer?
The market segments include Application, Type.
4. Can you provide details about the market size?
The market size is estimated to be USD XXX N/A as of 2022.
5. What are some drivers contributing to market growth?
N/A
6. What are the notable trends driving market growth?
N/A
7. Are there any restraints impacting market growth?
N/A
8. Can you provide examples of recent developments in the market?
N/A
9. What pricing options are available for accessing the report?
Pricing options include single-user, multi-user, and enterprise licenses priced at USD 2900.00, USD 4350.00, and USD 5800.00 respectively.
10. Is the market size provided in terms of value or volume?
The market size is provided in terms of value, measured in N/A.
11. Are there any specific market keywords associated with the report?
Yes, the market keyword associated with the report is "Green Hydrogen For Green Fertilizer," which aids in identifying and referencing the specific market segment covered.
12. How do I determine which pricing option suits my needs best?
The pricing options vary based on user requirements and access needs. Individual users may opt for single-user licenses, while businesses requiring broader access may choose multi-user or enterprise licenses for cost-effective access to the report.
13. Are there any additional resources or data provided in the Green Hydrogen For Green Fertilizer report?
While the report offers comprehensive insights, it's advisable to review the specific contents or supplementary materials provided to ascertain if additional resources or data are available.
14. How can I stay updated on further developments or reports in the Green Hydrogen For Green Fertilizer?
To stay informed about further developments, trends, and reports in the Green Hydrogen For Green Fertilizer, consider subscribing to industry newsletters, following relevant companies and organizations, or regularly checking reputable industry news sources and publications.
Methodology
Step 1 - Identification of Relevant Samples Size from Population Database


Step 2 - Approaches for Defining Global Market Size (Value, Volume* & Price*)

Note*: In applicable scenarios
Step 3 - Data Sources
Primary Research
- Web Analytics
- Survey Reports
- Research Institute
- Latest Research Reports
- Opinion Leaders
Secondary Research
- Annual Reports
- White Paper
- Latest Press Release
- Industry Association
- Paid Database
- Investor Presentations

Step 4 - Data Triangulation
Involves using different sources of information in order to increase the validity of a study
These sources are likely to be stakeholders in a program - participants, other researchers, program staff, other community members, and so on.
Then we put all data in single framework & apply various statistical tools to find out the dynamic on the market.
During the analysis stage, feedback from the stakeholder groups would be compared to determine areas of agreement as well as areas of divergence