

Key Insights
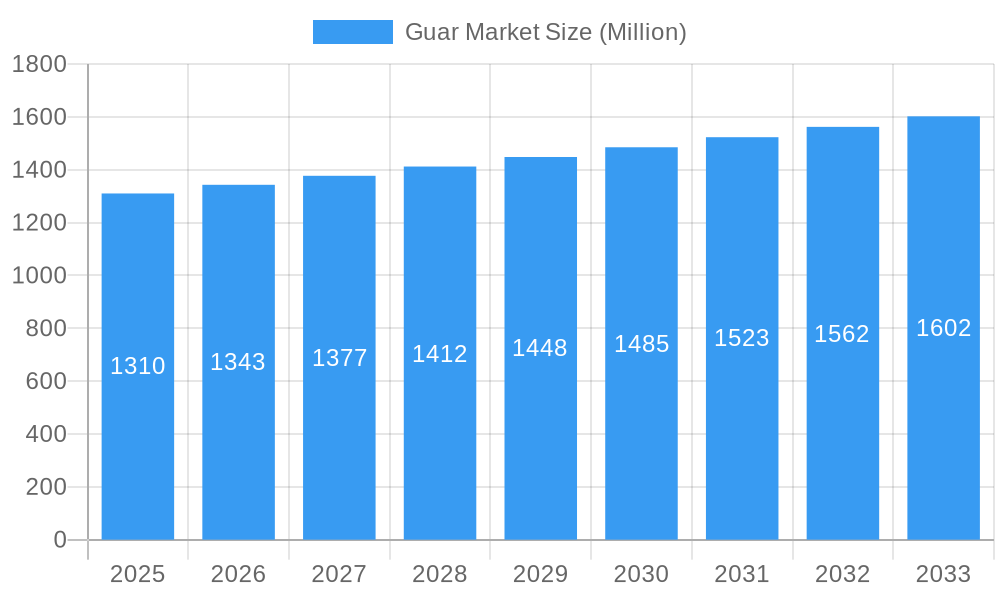
The global guar market, valued at $1.31 billion in 2025, is projected to experience steady growth, driven primarily by increasing demand from the food and oil & gas industries. The food industry utilizes guar gum as a thickening and stabilizing agent in various products, while the oil and gas sector employs guar gum derivatives for enhanced oil recovery processes. The pharmaceutical industry also contributes significantly, using guar gum in drug formulations and as an excipient. The market is segmented into guar gum and guar meal, with guar gum holding a larger market share due to its wider range of applications. Growth will be influenced by factors such as fluctuating guar prices due to weather patterns affecting crop yields, the development of sustainable guar cultivation practices, and the exploration of new applications across diverse industries. While regional variations exist, Asia-Pacific, particularly India, is anticipated to remain a dominant market owing to its significant guar production and consumption. North America and Europe are also expected to witness moderate growth, driven by increasing demand from the food processing and pharmaceutical sectors. Competitive landscape analysis reveals key players such as Noble Commodities, SunGum Global, Galaxy Gum, JK Agri Genetics, and Guar Gum International actively vying for market share through strategic partnerships, product diversification, and geographic expansion. The projected CAGR of 2.60% suggests a relatively stable, albeit modest, growth trajectory over the forecast period (2025-2033).
Guar Market Market Size (In Billion)
The sustained growth in the guar market is further supported by ongoing research and development efforts aimed at improving the quality and functionality of guar gum and its derivatives. The exploration of novel applications in emerging sectors, such as cosmetics and personal care, also presents promising growth opportunities. However, the market faces challenges including price volatility related to crop yields and potential competition from synthetic alternatives. Nevertheless, the inherent biodegradability and non-toxicity of guar gum are key advantages that continue to drive its adoption across diverse applications, mitigating some of the potential risks associated with price fluctuations and competitive pressures. The overall market outlook remains positive, anticipating continuous growth propelled by a combination of established applications and the emergence of new opportunities across various industries.
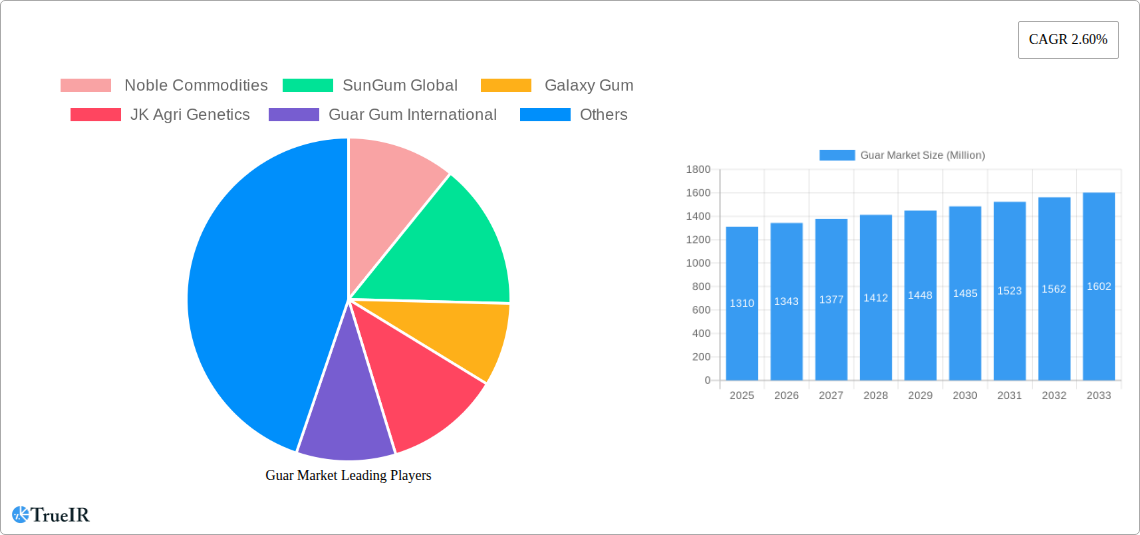
Guar Market Company Market Share
Dynamic Guar Market Report: 2019-2033
This comprehensive report provides an in-depth analysis of the Guar Market, projecting robust growth from 2025 to 2033. Leveraging a meticulous study period (2019-2024) and base year (2025), this report offers invaluable insights for stakeholders across the entire value chain. We delve into market segmentation (Guar Gum, Guar Meal), explore key applications (Food, Oil & Gas, Paper, Pharmaceuticals, Others), and identify leading players like Noble Commodities, SunGum Global, Galaxy Gum, JK Agri Genetics, and Guar Gum International. The report forecasts a dynamic market landscape, impacted by regulatory changes, technological advancements, and evolving consumer preferences. Download now to gain a competitive edge.
Guar Market Market Structure & Competitive Landscape
The Guar market exhibits a moderately concentrated structure, with a few major players commanding significant market share. The Herfindahl-Hirschman Index (HHI) for the global market is estimated to be around xx, indicating moderate concentration. Innovation, particularly in developing sustainable and high-performance guar gum derivatives, is a key driver, shaping competitive dynamics. Regulatory changes, such as the 2022 amendment regarding PCP and ETO testing for exports to the EU and UK, significantly impact market players, necessitating compliance investments. Product substitutes, such as synthetic polymers, pose a competitive threat, especially in certain applications.
The market is segmented by application, including Food (xx Million), Oil and Gas (xx Million), Paper (xx Million), Pharmaceuticals (xx Million), and Others (xx Million). End-user segmentation further diversifies the market, with specific industry needs influencing product choices and demand. Mergers and acquisitions (M&A) activity has been relatively moderate in recent years, with an estimated xx M&A deals over the past five years. Key trends observed include:
- Increasing consolidation: Larger players are looking to expand their market share through acquisitions of smaller companies.
- Focus on sustainable products: Companies are investing in research and development of eco-friendly guar gum derivatives.
- Expanding into new applications: Companies are actively exploring new applications for guar gum across various industries.
- Geographic diversification: Companies are expanding their geographical reach to tap into new markets.
Guar Market Market Trends & Opportunities
The Guar market is poised for significant growth, with a projected Compound Annual Growth Rate (CAGR) of xx% during the forecast period (2025-2033). This growth is fueled by several factors, including increasing demand from various end-use industries, particularly in the food and oil & gas sectors. Technological advancements in guar gum processing and modification are further enhancing its applicability in diverse sectors. The market penetration rate for guar gum in key applications shows steady growth, driven by its functional properties.
Consumer preferences are increasingly shifting towards natural and sustainable ingredients, creating a positive outlook for guar gum, especially in the food industry. Competitive dynamics are marked by innovation in product formulations and applications, along with strategic partnerships and collaborations. Market expansion is observed in emerging economies, driven by infrastructural development and increasing industrialization. The overall market size is projected to reach xx Million by 2033.
Dominant Markets & Segments in Guar Market
India currently holds the dominant position in the global guar market, primarily due to its significant guar bean production and processing capacity. Other key regions include the United States, and parts of Europe.
Key Growth Drivers for India:
- Abundant guar bean cultivation.
- Well-established processing infrastructure.
- Government support for agriculture and exports.
Guar Gum Segment: The guar gum segment dominates the market due to its wider range of applications across various industries. High demand from the food and oil & gas sectors fuels this dominance.
Food Application Segment: The food industry is a key driver, with guar gum used as a thickening, stabilizing and emulsifying agent in various food products. The growing demand for processed foods and convenience foods contributes to the segment's growth.
Analysis of Market Dominance: India's market dominance is rooted in its favorable climatic conditions and extensive cultivation of guar beans. The country's established processing infrastructure and government support facilitate efficient production and export of guar gum and meal.
Guar Market Product Analysis
Product innovations focus on developing modified guar gums with enhanced functionalities such as improved viscosity, stability and solubility. These advancements cater to specific needs in different applications. The competitive advantage lies in superior product quality, consistent supply, and cost-effective production. The market is witnessing a trend towards environmentally friendly and sustainable guar gum derivatives.
Key Drivers, Barriers & Challenges in Guar Market
Key Drivers:
- Increasing demand from food, oil and gas, and pharmaceutical industries.
- Growing consumer preference for natural and sustainable products.
- Technological advancements in guar gum processing and modification.
Challenges & Restraints:
- Fluctuations in guar bean production due to climatic factors.
- Stringent regulations and compliance requirements impacting exports.
- Price volatility due to supply chain disruptions. These factors have caused price swings of up to xx% in the past five years.
Growth Drivers in the Guar Market Market
The guar market is driven by several factors: the growing demand from various industries (food, oil and gas, paper, pharmaceuticals), the increasing preference for natural ingredients in food products, and advancements in guar gum processing technologies. Government initiatives supporting agriculture and exports further contribute to market growth.
Challenges Impacting Guar Market Growth
Challenges include fluctuations in guar bean production due to climate changes and the potential for crop failures. Stricter international regulations on exports, coupled with supply chain disruptions and price volatility, add to the complexities. Competition from synthetic substitutes adds further pressure.
Key Players Shaping the Guar Market Market
- Noble Commodities
- SunGum Global
- Galaxy Gum
- JK Agri Genetics
- Guar Gum International
Significant Guar Market Industry Milestones
- May 2022: DGFT amendment on guar gum exports to EU and UK, mandating PCP and ETO testing. This impacted Indian exporters, increasing regulatory compliance costs.
- October 2021: Development of a biodegradable polymer using guar gum and chitosan, opening new avenues for packaging applications and reducing reliance on petroleum-based plastics. This represents a significant opportunity for the industry to embrace sustainability.
Future Outlook for Guar Market Market
The guar market is projected to maintain a positive growth trajectory driven by increasing demand across various sectors. Opportunities lie in developing value-added products, exploring new applications, and capitalizing on the growing demand for sustainable solutions. Strategic partnerships and investments in research and development will play a crucial role in shaping the market's future.
Guar Market Segmentation
- 1. Production Analysis
- 2. Consumption Analysis
- 3. Import Market Analysis (Value & Volume)
- 4. Export Market Analysis (Value & Volume)
- 5. Price Trend Analysis
Guar Market Segmentation By Geography
-
1. North America
- 1.1. United States
- 1.2. Canada
-
2. Europe
- 2.1. Germany
- 2.2. France
- 2.3. Russia
- 2.4. Spain
-
3. Asia Pacific
- 3.1. India
- 3.2. China
- 3.3. Japan
- 3.4. Australia
-
4. South America
- 4.1. Brazil
- 4.2. Argentina
-
5. Africa
- 5.1. Malawi
- 5.2. Sudan
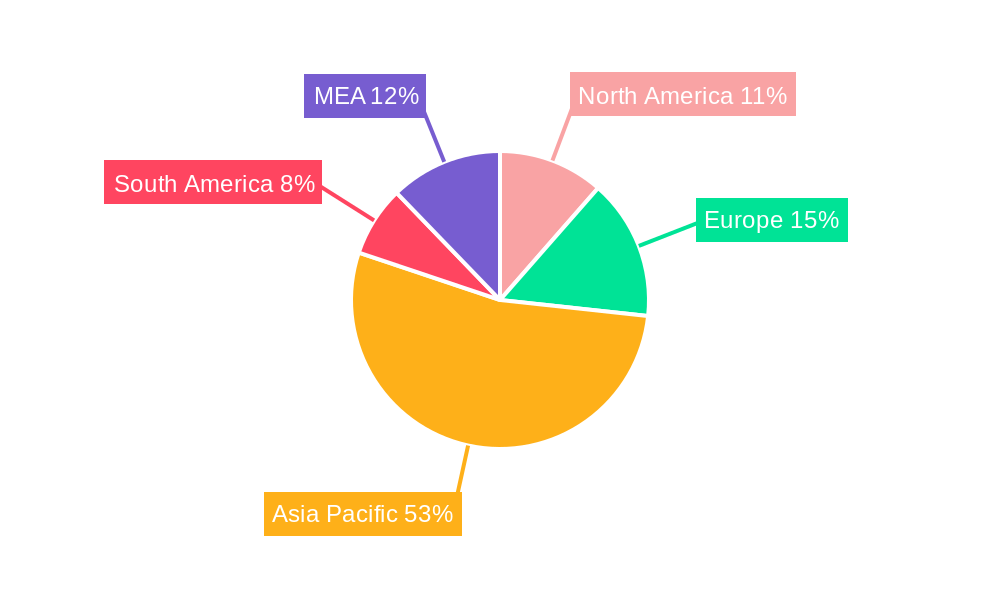
Guar Market Regional Market Share
Geographic Coverage of Guar Market
Guar Market REPORT HIGHLIGHTS
| Aspects | Details |
|---|---|
| Study Period | 2020-2034 |
| Base Year | 2025 |
| Estimated Year | 2026 |
| Forecast Period | 2026-2034 |
| Historical Period | 2020-2025 |
| Growth Rate | CAGR of 2.60% from 2020-2034 |
| Segmentation |
|
Table of Contents
- 1. Introduction
- 1.1. Research Scope
- 1.2. Market Segmentation
- 1.3. Research Methodology
- 1.4. Definitions and Assumptions
- 2. Executive Summary
- 2.1. Introduction
- 3. Market Dynamics
- 3.1. Introduction
- 3.2. Market Drivers
- 3.2.1. Rising Consumption of Cashew Nuts in the Country; Favorable Government Initiatives
- 3.3. Market Restrains
- 3.3.1. Hazardous Climatic Condition Hinders Cashew Production; Stringent Regulations Related to Food Quality Standards
- 3.4. Market Trends
- 3.4.1. High Demand by End-users
- 4. Market Factor Analysis
- 4.1. Porters Five Forces
- 4.2. Supply/Value Chain
- 4.3. PESTEL analysis
- 4.4. Market Entropy
- 4.5. Patent/Trademark Analysis
- 5. Global Guar Market Analysis, Insights and Forecast, 2020-2032
- 5.1. Market Analysis, Insights and Forecast - by Production Analysis
- 5.2. Market Analysis, Insights and Forecast - by Consumption Analysis
- 5.3. Market Analysis, Insights and Forecast - by Import Market Analysis (Value & Volume)
- 5.4. Market Analysis, Insights and Forecast - by Export Market Analysis (Value & Volume)
- 5.5. Market Analysis, Insights and Forecast - by Price Trend Analysis
- 5.6. Market Analysis, Insights and Forecast - by Region
- 5.6.1. North America
- 5.6.2. Europe
- 5.6.3. Asia Pacific
- 5.6.4. South America
- 5.6.5. Africa
- 5.1. Market Analysis, Insights and Forecast - by Production Analysis
- 6. North America Guar Market Analysis, Insights and Forecast, 2020-2032
- 6.1. Market Analysis, Insights and Forecast - by Production Analysis
- 6.2. Market Analysis, Insights and Forecast - by Consumption Analysis
- 6.3. Market Analysis, Insights and Forecast - by Import Market Analysis (Value & Volume)
- 6.4. Market Analysis, Insights and Forecast - by Export Market Analysis (Value & Volume)
- 6.5. Market Analysis, Insights and Forecast - by Price Trend Analysis
- 6.1. Market Analysis, Insights and Forecast - by Production Analysis
- 7. Europe Guar Market Analysis, Insights and Forecast, 2020-2032
- 7.1. Market Analysis, Insights and Forecast - by Production Analysis
- 7.2. Market Analysis, Insights and Forecast - by Consumption Analysis
- 7.3. Market Analysis, Insights and Forecast - by Import Market Analysis (Value & Volume)
- 7.4. Market Analysis, Insights and Forecast - by Export Market Analysis (Value & Volume)
- 7.5. Market Analysis, Insights and Forecast - by Price Trend Analysis
- 7.1. Market Analysis, Insights and Forecast - by Production Analysis
- 8. Asia Pacific Guar Market Analysis, Insights and Forecast, 2020-2032
- 8.1. Market Analysis, Insights and Forecast - by Production Analysis
- 8.2. Market Analysis, Insights and Forecast - by Consumption Analysis
- 8.3. Market Analysis, Insights and Forecast - by Import Market Analysis (Value & Volume)
- 8.4. Market Analysis, Insights and Forecast - by Export Market Analysis (Value & Volume)
- 8.5. Market Analysis, Insights and Forecast - by Price Trend Analysis
- 8.1. Market Analysis, Insights and Forecast - by Production Analysis
- 9. South America Guar Market Analysis, Insights and Forecast, 2020-2032
- 9.1. Market Analysis, Insights and Forecast - by Production Analysis
- 9.2. Market Analysis, Insights and Forecast - by Consumption Analysis
- 9.3. Market Analysis, Insights and Forecast - by Import Market Analysis (Value & Volume)
- 9.4. Market Analysis, Insights and Forecast - by Export Market Analysis (Value & Volume)
- 9.5. Market Analysis, Insights and Forecast - by Price Trend Analysis
- 9.1. Market Analysis, Insights and Forecast - by Production Analysis
- 10. Africa Guar Market Analysis, Insights and Forecast, 2020-2032
- 10.1. Market Analysis, Insights and Forecast - by Production Analysis
- 10.2. Market Analysis, Insights and Forecast - by Consumption Analysis
- 10.3. Market Analysis, Insights and Forecast - by Import Market Analysis (Value & Volume)
- 10.4. Market Analysis, Insights and Forecast - by Export Market Analysis (Value & Volume)
- 10.5. Market Analysis, Insights and Forecast - by Price Trend Analysis
- 10.1. Market Analysis, Insights and Forecast - by Production Analysis
- 11. Competitive Analysis
- 11.1. Global Market Share Analysis 2025
- 11.2. Company Profiles
- 11.2.1 Noble Commodities
- 11.2.1.1. Overview
- 11.2.1.2. Products
- 11.2.1.3. SWOT Analysis
- 11.2.1.4. Recent Developments
- 11.2.1.5. Financials (Based on Availability)
- 11.2.2 SunGum Global
- 11.2.2.1. Overview
- 11.2.2.2. Products
- 11.2.2.3. SWOT Analysis
- 11.2.2.4. Recent Developments
- 11.2.2.5. Financials (Based on Availability)
- 11.2.3 Galaxy Gum
- 11.2.3.1. Overview
- 11.2.3.2. Products
- 11.2.3.3. SWOT Analysis
- 11.2.3.4. Recent Developments
- 11.2.3.5. Financials (Based on Availability)
- 11.2.4 JK Agri Genetics
- 11.2.4.1. Overview
- 11.2.4.2. Products
- 11.2.4.3. SWOT Analysis
- 11.2.4.4. Recent Developments
- 11.2.4.5. Financials (Based on Availability)
- 11.2.5 Guar Gum International
- 11.2.5.1. Overview
- 11.2.5.2. Products
- 11.2.5.3. SWOT Analysis
- 11.2.5.4. Recent Developments
- 11.2.5.5. Financials (Based on Availability)
- 11.2.1 Noble Commodities
List of Figures
- Figure 1: Global Guar Market Revenue Breakdown (Million, %) by Region 2025 & 2033
- Figure 2: Global Guar Market Volume Breakdown (Kiloton, %) by Region 2025 & 2033
- Figure 3: North America Guar Market Revenue (Million), by Production Analysis 2025 & 2033
- Figure 4: North America Guar Market Volume (Kiloton), by Production Analysis 2025 & 2033
- Figure 5: North America Guar Market Revenue Share (%), by Production Analysis 2025 & 2033
- Figure 6: North America Guar Market Volume Share (%), by Production Analysis 2025 & 2033
- Figure 7: North America Guar Market Revenue (Million), by Consumption Analysis 2025 & 2033
- Figure 8: North America Guar Market Volume (Kiloton), by Consumption Analysis 2025 & 2033
- Figure 9: North America Guar Market Revenue Share (%), by Consumption Analysis 2025 & 2033
- Figure 10: North America Guar Market Volume Share (%), by Consumption Analysis 2025 & 2033
- Figure 11: North America Guar Market Revenue (Million), by Import Market Analysis (Value & Volume) 2025 & 2033
- Figure 12: North America Guar Market Volume (Kiloton), by Import Market Analysis (Value & Volume) 2025 & 2033
- Figure 13: North America Guar Market Revenue Share (%), by Import Market Analysis (Value & Volume) 2025 & 2033
- Figure 14: North America Guar Market Volume Share (%), by Import Market Analysis (Value & Volume) 2025 & 2033
- Figure 15: North America Guar Market Revenue (Million), by Export Market Analysis (Value & Volume) 2025 & 2033
- Figure 16: North America Guar Market Volume (Kiloton), by Export Market Analysis (Value & Volume) 2025 & 2033
- Figure 17: North America Guar Market Revenue Share (%), by Export Market Analysis (Value & Volume) 2025 & 2033
- Figure 18: North America Guar Market Volume Share (%), by Export Market Analysis (Value & Volume) 2025 & 2033
- Figure 19: North America Guar Market Revenue (Million), by Price Trend Analysis 2025 & 2033
- Figure 20: North America Guar Market Volume (Kiloton), by Price Trend Analysis 2025 & 2033
- Figure 21: North America Guar Market Revenue Share (%), by Price Trend Analysis 2025 & 2033
- Figure 22: North America Guar Market Volume Share (%), by Price Trend Analysis 2025 & 2033
- Figure 23: North America Guar Market Revenue (Million), by Country 2025 & 2033
- Figure 24: North America Guar Market Volume (Kiloton), by Country 2025 & 2033
- Figure 25: North America Guar Market Revenue Share (%), by Country 2025 & 2033
- Figure 26: North America Guar Market Volume Share (%), by Country 2025 & 2033
- Figure 27: Europe Guar Market Revenue (Million), by Production Analysis 2025 & 2033
- Figure 28: Europe Guar Market Volume (Kiloton), by Production Analysis 2025 & 2033
- Figure 29: Europe Guar Market Revenue Share (%), by Production Analysis 2025 & 2033
- Figure 30: Europe Guar Market Volume Share (%), by Production Analysis 2025 & 2033
- Figure 31: Europe Guar Market Revenue (Million), by Consumption Analysis 2025 & 2033
- Figure 32: Europe Guar Market Volume (Kiloton), by Consumption Analysis 2025 & 2033
- Figure 33: Europe Guar Market Revenue Share (%), by Consumption Analysis 2025 & 2033
- Figure 34: Europe Guar Market Volume Share (%), by Consumption Analysis 2025 & 2033
- Figure 35: Europe Guar Market Revenue (Million), by Import Market Analysis (Value & Volume) 2025 & 2033
- Figure 36: Europe Guar Market Volume (Kiloton), by Import Market Analysis (Value & Volume) 2025 & 2033
- Figure 37: Europe Guar Market Revenue Share (%), by Import Market Analysis (Value & Volume) 2025 & 2033
- Figure 38: Europe Guar Market Volume Share (%), by Import Market Analysis (Value & Volume) 2025 & 2033
- Figure 39: Europe Guar Market Revenue (Million), by Export Market Analysis (Value & Volume) 2025 & 2033
- Figure 40: Europe Guar Market Volume (Kiloton), by Export Market Analysis (Value & Volume) 2025 & 2033
- Figure 41: Europe Guar Market Revenue Share (%), by Export Market Analysis (Value & Volume) 2025 & 2033
- Figure 42: Europe Guar Market Volume Share (%), by Export Market Analysis (Value & Volume) 2025 & 2033
- Figure 43: Europe Guar Market Revenue (Million), by Price Trend Analysis 2025 & 2033
- Figure 44: Europe Guar Market Volume (Kiloton), by Price Trend Analysis 2025 & 2033
- Figure 45: Europe Guar Market Revenue Share (%), by Price Trend Analysis 2025 & 2033
- Figure 46: Europe Guar Market Volume Share (%), by Price Trend Analysis 2025 & 2033
- Figure 47: Europe Guar Market Revenue (Million), by Country 2025 & 2033
- Figure 48: Europe Guar Market Volume (Kiloton), by Country 2025 & 2033
- Figure 49: Europe Guar Market Revenue Share (%), by Country 2025 & 2033
- Figure 50: Europe Guar Market Volume Share (%), by Country 2025 & 2033
- Figure 51: Asia Pacific Guar Market Revenue (Million), by Production Analysis 2025 & 2033
- Figure 52: Asia Pacific Guar Market Volume (Kiloton), by Production Analysis 2025 & 2033
- Figure 53: Asia Pacific Guar Market Revenue Share (%), by Production Analysis 2025 & 2033
- Figure 54: Asia Pacific Guar Market Volume Share (%), by Production Analysis 2025 & 2033
- Figure 55: Asia Pacific Guar Market Revenue (Million), by Consumption Analysis 2025 & 2033
- Figure 56: Asia Pacific Guar Market Volume (Kiloton), by Consumption Analysis 2025 & 2033
- Figure 57: Asia Pacific Guar Market Revenue Share (%), by Consumption Analysis 2025 & 2033
- Figure 58: Asia Pacific Guar Market Volume Share (%), by Consumption Analysis 2025 & 2033
- Figure 59: Asia Pacific Guar Market Revenue (Million), by Import Market Analysis (Value & Volume) 2025 & 2033
- Figure 60: Asia Pacific Guar Market Volume (Kiloton), by Import Market Analysis (Value & Volume) 2025 & 2033
- Figure 61: Asia Pacific Guar Market Revenue Share (%), by Import Market Analysis (Value & Volume) 2025 & 2033
- Figure 62: Asia Pacific Guar Market Volume Share (%), by Import Market Analysis (Value & Volume) 2025 & 2033
- Figure 63: Asia Pacific Guar Market Revenue (Million), by Export Market Analysis (Value & Volume) 2025 & 2033
- Figure 64: Asia Pacific Guar Market Volume (Kiloton), by Export Market Analysis (Value & Volume) 2025 & 2033
- Figure 65: Asia Pacific Guar Market Revenue Share (%), by Export Market Analysis (Value & Volume) 2025 & 2033
- Figure 66: Asia Pacific Guar Market Volume Share (%), by Export Market Analysis (Value & Volume) 2025 & 2033
- Figure 67: Asia Pacific Guar Market Revenue (Million), by Price Trend Analysis 2025 & 2033
- Figure 68: Asia Pacific Guar Market Volume (Kiloton), by Price Trend Analysis 2025 & 2033
- Figure 69: Asia Pacific Guar Market Revenue Share (%), by Price Trend Analysis 2025 & 2033
- Figure 70: Asia Pacific Guar Market Volume Share (%), by Price Trend Analysis 2025 & 2033
- Figure 71: Asia Pacific Guar Market Revenue (Million), by Country 2025 & 2033
- Figure 72: Asia Pacific Guar Market Volume (Kiloton), by Country 2025 & 2033
- Figure 73: Asia Pacific Guar Market Revenue Share (%), by Country 2025 & 2033
- Figure 74: Asia Pacific Guar Market Volume Share (%), by Country 2025 & 2033
- Figure 75: South America Guar Market Revenue (Million), by Production Analysis 2025 & 2033
- Figure 76: South America Guar Market Volume (Kiloton), by Production Analysis 2025 & 2033
- Figure 77: South America Guar Market Revenue Share (%), by Production Analysis 2025 & 2033
- Figure 78: South America Guar Market Volume Share (%), by Production Analysis 2025 & 2033
- Figure 79: South America Guar Market Revenue (Million), by Consumption Analysis 2025 & 2033
- Figure 80: South America Guar Market Volume (Kiloton), by Consumption Analysis 2025 & 2033
- Figure 81: South America Guar Market Revenue Share (%), by Consumption Analysis 2025 & 2033
- Figure 82: South America Guar Market Volume Share (%), by Consumption Analysis 2025 & 2033
- Figure 83: South America Guar Market Revenue (Million), by Import Market Analysis (Value & Volume) 2025 & 2033
- Figure 84: South America Guar Market Volume (Kiloton), by Import Market Analysis (Value & Volume) 2025 & 2033
- Figure 85: South America Guar Market Revenue Share (%), by Import Market Analysis (Value & Volume) 2025 & 2033
- Figure 86: South America Guar Market Volume Share (%), by Import Market Analysis (Value & Volume) 2025 & 2033
- Figure 87: South America Guar Market Revenue (Million), by Export Market Analysis (Value & Volume) 2025 & 2033
- Figure 88: South America Guar Market Volume (Kiloton), by Export Market Analysis (Value & Volume) 2025 & 2033
- Figure 89: South America Guar Market Revenue Share (%), by Export Market Analysis (Value & Volume) 2025 & 2033
- Figure 90: South America Guar Market Volume Share (%), by Export Market Analysis (Value & Volume) 2025 & 2033
- Figure 91: South America Guar Market Revenue (Million), by Price Trend Analysis 2025 & 2033
- Figure 92: South America Guar Market Volume (Kiloton), by Price Trend Analysis 2025 & 2033
- Figure 93: South America Guar Market Revenue Share (%), by Price Trend Analysis 2025 & 2033
- Figure 94: South America Guar Market Volume Share (%), by Price Trend Analysis 2025 & 2033
- Figure 95: South America Guar Market Revenue (Million), by Country 2025 & 2033
- Figure 96: South America Guar Market Volume (Kiloton), by Country 2025 & 2033
- Figure 97: South America Guar Market Revenue Share (%), by Country 2025 & 2033
- Figure 98: South America Guar Market Volume Share (%), by Country 2025 & 2033
- Figure 99: Africa Guar Market Revenue (Million), by Production Analysis 2025 & 2033
- Figure 100: Africa Guar Market Volume (Kiloton), by Production Analysis 2025 & 2033
- Figure 101: Africa Guar Market Revenue Share (%), by Production Analysis 2025 & 2033
- Figure 102: Africa Guar Market Volume Share (%), by Production Analysis 2025 & 2033
- Figure 103: Africa Guar Market Revenue (Million), by Consumption Analysis 2025 & 2033
- Figure 104: Africa Guar Market Volume (Kiloton), by Consumption Analysis 2025 & 2033
- Figure 105: Africa Guar Market Revenue Share (%), by Consumption Analysis 2025 & 2033
- Figure 106: Africa Guar Market Volume Share (%), by Consumption Analysis 2025 & 2033
- Figure 107: Africa Guar Market Revenue (Million), by Import Market Analysis (Value & Volume) 2025 & 2033
- Figure 108: Africa Guar Market Volume (Kiloton), by Import Market Analysis (Value & Volume) 2025 & 2033
- Figure 109: Africa Guar Market Revenue Share (%), by Import Market Analysis (Value & Volume) 2025 & 2033
- Figure 110: Africa Guar Market Volume Share (%), by Import Market Analysis (Value & Volume) 2025 & 2033
- Figure 111: Africa Guar Market Revenue (Million), by Export Market Analysis (Value & Volume) 2025 & 2033
- Figure 112: Africa Guar Market Volume (Kiloton), by Export Market Analysis (Value & Volume) 2025 & 2033
- Figure 113: Africa Guar Market Revenue Share (%), by Export Market Analysis (Value & Volume) 2025 & 2033
- Figure 114: Africa Guar Market Volume Share (%), by Export Market Analysis (Value & Volume) 2025 & 2033
- Figure 115: Africa Guar Market Revenue (Million), by Price Trend Analysis 2025 & 2033
- Figure 116: Africa Guar Market Volume (Kiloton), by Price Trend Analysis 2025 & 2033
- Figure 117: Africa Guar Market Revenue Share (%), by Price Trend Analysis 2025 & 2033
- Figure 118: Africa Guar Market Volume Share (%), by Price Trend Analysis 2025 & 2033
- Figure 119: Africa Guar Market Revenue (Million), by Country 2025 & 2033
- Figure 120: Africa Guar Market Volume (Kiloton), by Country 2025 & 2033
- Figure 121: Africa Guar Market Revenue Share (%), by Country 2025 & 2033
- Figure 122: Africa Guar Market Volume Share (%), by Country 2025 & 2033
List of Tables
- Table 1: Global Guar Market Revenue Million Forecast, by Production Analysis 2020 & 2033
- Table 2: Global Guar Market Volume Kiloton Forecast, by Production Analysis 2020 & 2033
- Table 3: Global Guar Market Revenue Million Forecast, by Consumption Analysis 2020 & 2033
- Table 4: Global Guar Market Volume Kiloton Forecast, by Consumption Analysis 2020 & 2033
- Table 5: Global Guar Market Revenue Million Forecast, by Import Market Analysis (Value & Volume) 2020 & 2033
- Table 6: Global Guar Market Volume Kiloton Forecast, by Import Market Analysis (Value & Volume) 2020 & 2033
- Table 7: Global Guar Market Revenue Million Forecast, by Export Market Analysis (Value & Volume) 2020 & 2033
- Table 8: Global Guar Market Volume Kiloton Forecast, by Export Market Analysis (Value & Volume) 2020 & 2033
- Table 9: Global Guar Market Revenue Million Forecast, by Price Trend Analysis 2020 & 2033
- Table 10: Global Guar Market Volume Kiloton Forecast, by Price Trend Analysis 2020 & 2033
- Table 11: Global Guar Market Revenue Million Forecast, by Region 2020 & 2033
- Table 12: Global Guar Market Volume Kiloton Forecast, by Region 2020 & 2033
- Table 13: Global Guar Market Revenue Million Forecast, by Production Analysis 2020 & 2033
- Table 14: Global Guar Market Volume Kiloton Forecast, by Production Analysis 2020 & 2033
- Table 15: Global Guar Market Revenue Million Forecast, by Consumption Analysis 2020 & 2033
- Table 16: Global Guar Market Volume Kiloton Forecast, by Consumption Analysis 2020 & 2033
- Table 17: Global Guar Market Revenue Million Forecast, by Import Market Analysis (Value & Volume) 2020 & 2033
- Table 18: Global Guar Market Volume Kiloton Forecast, by Import Market Analysis (Value & Volume) 2020 & 2033
- Table 19: Global Guar Market Revenue Million Forecast, by Export Market Analysis (Value & Volume) 2020 & 2033
- Table 20: Global Guar Market Volume Kiloton Forecast, by Export Market Analysis (Value & Volume) 2020 & 2033
- Table 21: Global Guar Market Revenue Million Forecast, by Price Trend Analysis 2020 & 2033
- Table 22: Global Guar Market Volume Kiloton Forecast, by Price Trend Analysis 2020 & 2033
- Table 23: Global Guar Market Revenue Million Forecast, by Country 2020 & 2033
- Table 24: Global Guar Market Volume Kiloton Forecast, by Country 2020 & 2033
- Table 25: United States Guar Market Revenue (Million) Forecast, by Application 2020 & 2033
- Table 26: United States Guar Market Volume (Kiloton) Forecast, by Application 2020 & 2033
- Table 27: Canada Guar Market Revenue (Million) Forecast, by Application 2020 & 2033
- Table 28: Canada Guar Market Volume (Kiloton) Forecast, by Application 2020 & 2033
- Table 29: Global Guar Market Revenue Million Forecast, by Production Analysis 2020 & 2033
- Table 30: Global Guar Market Volume Kiloton Forecast, by Production Analysis 2020 & 2033
- Table 31: Global Guar Market Revenue Million Forecast, by Consumption Analysis 2020 & 2033
- Table 32: Global Guar Market Volume Kiloton Forecast, by Consumption Analysis 2020 & 2033
- Table 33: Global Guar Market Revenue Million Forecast, by Import Market Analysis (Value & Volume) 2020 & 2033
- Table 34: Global Guar Market Volume Kiloton Forecast, by Import Market Analysis (Value & Volume) 2020 & 2033
- Table 35: Global Guar Market Revenue Million Forecast, by Export Market Analysis (Value & Volume) 2020 & 2033
- Table 36: Global Guar Market Volume Kiloton Forecast, by Export Market Analysis (Value & Volume) 2020 & 2033
- Table 37: Global Guar Market Revenue Million Forecast, by Price Trend Analysis 2020 & 2033
- Table 38: Global Guar Market Volume Kiloton Forecast, by Price Trend Analysis 2020 & 2033
- Table 39: Global Guar Market Revenue Million Forecast, by Country 2020 & 2033
- Table 40: Global Guar Market Volume Kiloton Forecast, by Country 2020 & 2033
- Table 41: Germany Guar Market Revenue (Million) Forecast, by Application 2020 & 2033
- Table 42: Germany Guar Market Volume (Kiloton) Forecast, by Application 2020 & 2033
- Table 43: France Guar Market Revenue (Million) Forecast, by Application 2020 & 2033
- Table 44: France Guar Market Volume (Kiloton) Forecast, by Application 2020 & 2033
- Table 45: Russia Guar Market Revenue (Million) Forecast, by Application 2020 & 2033
- Table 46: Russia Guar Market Volume (Kiloton) Forecast, by Application 2020 & 2033
- Table 47: Spain Guar Market Revenue (Million) Forecast, by Application 2020 & 2033
- Table 48: Spain Guar Market Volume (Kiloton) Forecast, by Application 2020 & 2033
- Table 49: Global Guar Market Revenue Million Forecast, by Production Analysis 2020 & 2033
- Table 50: Global Guar Market Volume Kiloton Forecast, by Production Analysis 2020 & 2033
- Table 51: Global Guar Market Revenue Million Forecast, by Consumption Analysis 2020 & 2033
- Table 52: Global Guar Market Volume Kiloton Forecast, by Consumption Analysis 2020 & 2033
- Table 53: Global Guar Market Revenue Million Forecast, by Import Market Analysis (Value & Volume) 2020 & 2033
- Table 54: Global Guar Market Volume Kiloton Forecast, by Import Market Analysis (Value & Volume) 2020 & 2033
- Table 55: Global Guar Market Revenue Million Forecast, by Export Market Analysis (Value & Volume) 2020 & 2033
- Table 56: Global Guar Market Volume Kiloton Forecast, by Export Market Analysis (Value & Volume) 2020 & 2033
- Table 57: Global Guar Market Revenue Million Forecast, by Price Trend Analysis 2020 & 2033
- Table 58: Global Guar Market Volume Kiloton Forecast, by Price Trend Analysis 2020 & 2033
- Table 59: Global Guar Market Revenue Million Forecast, by Country 2020 & 2033
- Table 60: Global Guar Market Volume Kiloton Forecast, by Country 2020 & 2033
- Table 61: India Guar Market Revenue (Million) Forecast, by Application 2020 & 2033
- Table 62: India Guar Market Volume (Kiloton) Forecast, by Application 2020 & 2033
- Table 63: China Guar Market Revenue (Million) Forecast, by Application 2020 & 2033
- Table 64: China Guar Market Volume (Kiloton) Forecast, by Application 2020 & 2033
- Table 65: Japan Guar Market Revenue (Million) Forecast, by Application 2020 & 2033
- Table 66: Japan Guar Market Volume (Kiloton) Forecast, by Application 2020 & 2033
- Table 67: Australia Guar Market Revenue (Million) Forecast, by Application 2020 & 2033
- Table 68: Australia Guar Market Volume (Kiloton) Forecast, by Application 2020 & 2033
- Table 69: Global Guar Market Revenue Million Forecast, by Production Analysis 2020 & 2033
- Table 70: Global Guar Market Volume Kiloton Forecast, by Production Analysis 2020 & 2033
- Table 71: Global Guar Market Revenue Million Forecast, by Consumption Analysis 2020 & 2033
- Table 72: Global Guar Market Volume Kiloton Forecast, by Consumption Analysis 2020 & 2033
- Table 73: Global Guar Market Revenue Million Forecast, by Import Market Analysis (Value & Volume) 2020 & 2033
- Table 74: Global Guar Market Volume Kiloton Forecast, by Import Market Analysis (Value & Volume) 2020 & 2033
- Table 75: Global Guar Market Revenue Million Forecast, by Export Market Analysis (Value & Volume) 2020 & 2033
- Table 76: Global Guar Market Volume Kiloton Forecast, by Export Market Analysis (Value & Volume) 2020 & 2033
- Table 77: Global Guar Market Revenue Million Forecast, by Price Trend Analysis 2020 & 2033
- Table 78: Global Guar Market Volume Kiloton Forecast, by Price Trend Analysis 2020 & 2033
- Table 79: Global Guar Market Revenue Million Forecast, by Country 2020 & 2033
- Table 80: Global Guar Market Volume Kiloton Forecast, by Country 2020 & 2033
- Table 81: Brazil Guar Market Revenue (Million) Forecast, by Application 2020 & 2033
- Table 82: Brazil Guar Market Volume (Kiloton) Forecast, by Application 2020 & 2033
- Table 83: Argentina Guar Market Revenue (Million) Forecast, by Application 2020 & 2033
- Table 84: Argentina Guar Market Volume (Kiloton) Forecast, by Application 2020 & 2033
- Table 85: Global Guar Market Revenue Million Forecast, by Production Analysis 2020 & 2033
- Table 86: Global Guar Market Volume Kiloton Forecast, by Production Analysis 2020 & 2033
- Table 87: Global Guar Market Revenue Million Forecast, by Consumption Analysis 2020 & 2033
- Table 88: Global Guar Market Volume Kiloton Forecast, by Consumption Analysis 2020 & 2033
- Table 89: Global Guar Market Revenue Million Forecast, by Import Market Analysis (Value & Volume) 2020 & 2033
- Table 90: Global Guar Market Volume Kiloton Forecast, by Import Market Analysis (Value & Volume) 2020 & 2033
- Table 91: Global Guar Market Revenue Million Forecast, by Export Market Analysis (Value & Volume) 2020 & 2033
- Table 92: Global Guar Market Volume Kiloton Forecast, by Export Market Analysis (Value & Volume) 2020 & 2033
- Table 93: Global Guar Market Revenue Million Forecast, by Price Trend Analysis 2020 & 2033
- Table 94: Global Guar Market Volume Kiloton Forecast, by Price Trend Analysis 2020 & 2033
- Table 95: Global Guar Market Revenue Million Forecast, by Country 2020 & 2033
- Table 96: Global Guar Market Volume Kiloton Forecast, by Country 2020 & 2033
- Table 97: Malawi Guar Market Revenue (Million) Forecast, by Application 2020 & 2033
- Table 98: Malawi Guar Market Volume (Kiloton) Forecast, by Application 2020 & 2033
- Table 99: Sudan Guar Market Revenue (Million) Forecast, by Application 2020 & 2033
- Table 100: Sudan Guar Market Volume (Kiloton) Forecast, by Application 2020 & 2033
Frequently Asked Questions
1. What is the projected Compound Annual Growth Rate (CAGR) of the Guar Market?
The projected CAGR is approximately 2.60%.
2. Which companies are prominent players in the Guar Market?
Key companies in the market include Noble Commodities, SunGum Global , Galaxy Gum , JK Agri Genetics , Guar Gum International .
3. What are the main segments of the Guar Market?
The market segments include Production Analysis, Consumption Analysis, Import Market Analysis (Value & Volume), Export Market Analysis (Value & Volume), Price Trend Analysis.
4. Can you provide details about the market size?
The market size is estimated to be USD 1.31 Million as of 2022.
5. What are some drivers contributing to market growth?
Rising Consumption of Cashew Nuts in the Country; Favorable Government Initiatives.
6. What are the notable trends driving market growth?
High Demand by End-users.
7. Are there any restraints impacting market growth?
Hazardous Climatic Condition Hinders Cashew Production; Stringent Regulations Related to Food Quality Standards.
8. Can you provide examples of recent developments in the market?
May 2022: The Directorate General of Foreign Trade (DGFT), on May 9, 2022, issued an amendment to the notification dated September 29, 2017, for the export of guar gum to the European Union and the United Kingdom. The export originating from India should get an official certificate and the original analytical report of testing of pentachlorophenol (PCP) and ethylene oxide (ETO) from Vimta Labs, Hyderabad. In addition to Vimta Labs, Hyderabad, Export Inspection Agency (EIA) Chennai has also been authorized to issue the analytical report of testing of PCP.
9. What pricing options are available for accessing the report?
Pricing options include single-user, multi-user, and enterprise licenses priced at USD 4750, USD 5250, and USD 8750 respectively.
10. Is the market size provided in terms of value or volume?
The market size is provided in terms of value, measured in Million and volume, measured in Kiloton.
11. Are there any specific market keywords associated with the report?
Yes, the market keyword associated with the report is "Guar Market," which aids in identifying and referencing the specific market segment covered.
12. How do I determine which pricing option suits my needs best?
The pricing options vary based on user requirements and access needs. Individual users may opt for single-user licenses, while businesses requiring broader access may choose multi-user or enterprise licenses for cost-effective access to the report.
13. Are there any additional resources or data provided in the Guar Market report?
While the report offers comprehensive insights, it's advisable to review the specific contents or supplementary materials provided to ascertain if additional resources or data are available.
14. How can I stay updated on further developments or reports in the Guar Market?
To stay informed about further developments, trends, and reports in the Guar Market, consider subscribing to industry newsletters, following relevant companies and organizations, or regularly checking reputable industry news sources and publications.
Methodology
Step 1 - Identification of Relevant Samples Size from Population Database


Step 2 - Approaches for Defining Global Market Size (Value, Volume* & Price*)

Note*: In applicable scenarios
Step 3 - Data Sources
Primary Research
- Web Analytics
- Survey Reports
- Research Institute
- Latest Research Reports
- Opinion Leaders
Secondary Research
- Annual Reports
- White Paper
- Latest Press Release
- Industry Association
- Paid Database
- Investor Presentations

Step 4 - Data Triangulation
Involves using different sources of information in order to increase the validity of a study
These sources are likely to be stakeholders in a program - participants, other researchers, program staff, other community members, and so on.
Then we put all data in single framework & apply various statistical tools to find out the dynamic on the market.
During the analysis stage, feedback from the stakeholder groups would be compared to determine areas of agreement as well as areas of divergence