

Key Insights
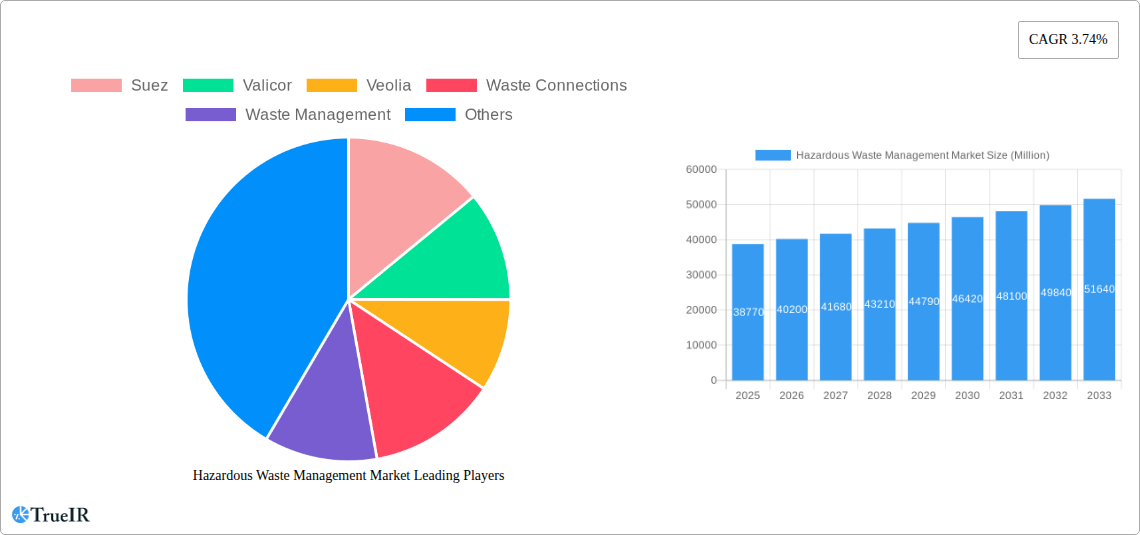
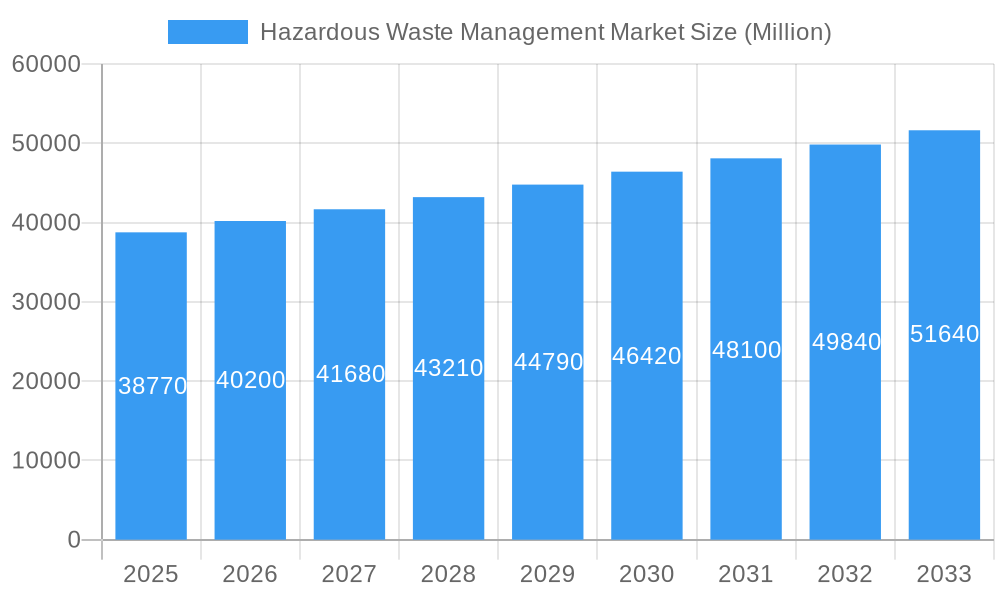
The hazardous waste management market, currently valued at $38.77 billion in 2025, is projected to experience steady growth, driven by increasing industrial activity, stricter environmental regulations globally, and a rising awareness of the detrimental effects of improper waste disposal. The compound annual growth rate (CAGR) of 3.74% from 2025 to 2033 indicates a consistent expansion, although the rate might fluctuate slightly year-on-year depending on economic conditions and policy changes. Key drivers include the growing need for specialized treatment and disposal solutions for hazardous materials, expanding healthcare sectors generating medical waste, and the increasing demand for environmentally sustainable waste management practices. The market is fragmented with several major players competing, including Suez, Veolia, Waste Management, and Republic Services, alongside numerous regional companies. Competition is expected to remain intense, with companies focusing on technological advancements, strategic acquisitions, and expansion into new geographic markets to gain a larger share of the growing pie.
Hazardous Waste Management Market Market Size (In Billion)
This growth trajectory is, however, subject to certain restraints. Fluctuations in raw material prices, stringent permitting processes for new facilities, and the potential for technological disruptions impacting existing waste management techniques could influence the market’s overall performance. Segmentation within the market is likely diverse, encompassing various waste types (e.g., chemical, biological, radioactive), treatment methods (e.g., incineration, landfilling, recycling), and service offerings (e.g., collection, treatment, disposal). Regional variations in regulations and economic development will also affect market penetration rates, with developed regions such as North America and Europe expected to hold a significant share initially, followed by growth in emerging economies in Asia and Latin America. Further research into specific regional data is needed to refine these market forecasts.
Hazardous Waste Management Market Company Market Share
Hazardous Waste Management Market: A Comprehensive Report (2019-2033)
This dynamic report provides a detailed analysis of the Hazardous Waste Management Market, offering invaluable insights for stakeholders seeking to navigate this crucial sector. The study covers the period 2019-2033, with a focus on the base year 2025 and a forecast period of 2025-2033. Our analysis incorporates historical data (2019-2024) and leverages high-volume keywords to enhance search visibility and provide comprehensive coverage of market trends, key players, and future opportunities. The market is expected to reach xx Million by 2033, exhibiting a CAGR of xx%.
Hazardous Waste Management Market Market Structure & Competitive Landscape
The Hazardous Waste Management market exhibits a moderately consolidated structure, with several multinational corporations holding significant market share. The Herfindahl-Hirschman Index (HHI) for the market is estimated at xx, suggesting a moderately competitive environment. Key players such as Suez, Veolia, Waste Management, and Republic Services drive innovation and competition, while smaller players often focus on niche segments or regional markets. The market is characterized by high barriers to entry, including significant capital investment requirements for waste treatment facilities and stringent regulatory compliance.
- Market Concentration: The top 5 players account for approximately xx% of the global market share (2025).
- Innovation Drivers: Technological advancements in waste treatment technologies, such as advanced incineration and plasma gasification, are driving innovation.
- Regulatory Impacts: Stringent environmental regulations, particularly regarding hazardous waste disposal, significantly influence market dynamics. Changes in regulations often lead to M&A activity as smaller companies are acquired by larger firms to meet stricter compliance standards.
- Product Substitutes: While direct substitutes for hazardous waste management services are limited, alternative waste management strategies, like waste reduction and recycling, exert competitive pressure.
- End-User Segmentation: The market caters to diverse end-users, including industrial manufacturers, healthcare facilities, and government entities. Variations in regulatory requirements across sectors create nuanced market segments.
- M&A Trends: The sector has witnessed a considerable volume of mergers and acquisitions (M&A) in recent years, with an estimated xx Million in deal value during 2019-2024. Consolidation is driven by economies of scale and the need to meet evolving regulatory demands.
Hazardous Waste Management Market Market Trends & Opportunities
The global Hazardous Waste Management market is undergoing significant expansion, fueled by a confluence of factors including accelerating industrialization, increasingly stringent environmental regulations worldwide, and a heightened societal awareness of environmental sustainability. A key driver of this growth is the continuous evolution and adoption of advanced waste treatment technologies, which offer more efficient and environmentally sound disposal and recycling methods. Despite this positive trajectory, the market navigates challenges such as the volatility of raw material costs, intense competitive pressures among service providers, and the perpetual need for technological innovation to keep pace with ever-evolving regulatory landscapes. Furthermore, a pronounced shift in consumer preferences towards environmentally responsible waste management practices is actively stimulating market demand. The market size is projected to experience substantial growth, expanding from approximately xx Million in 2025 to xx Million by 2033. Market penetration rates exhibit considerable regional disparities, with developed economies generally demonstrating higher adoption rates of advanced hazardous waste management solutions compared to their developing counterparts.
Dominant Markets & Segments in Hazardous Waste Management Market
North America currently dominates the Hazardous Waste Management market, driven by stringent environmental regulations, a well-established waste management infrastructure, and a high concentration of industrial activities. Europe and Asia-Pacific also represent significant market segments with considerable growth potential.
- Key Growth Drivers in North America:
- Robust regulatory framework emphasizing hazardous waste management.
- Well-developed waste management infrastructure.
- High concentration of industrial activities.
- Key Growth Drivers in Europe:
- Stringent environmental regulations promoting sustainable waste management.
- Growing awareness about environmental issues.
- Increasing investment in waste treatment technologies.
- Key Growth Drivers in Asia-Pacific:
- Rapid industrialization and urbanization.
- Rising government spending on infrastructure development.
- Growing focus on environmental sustainability.
The industrial sector currently accounts for the largest share of the market, followed by the healthcare and municipal segments.
Hazardous Waste Management Market Product Analysis
The Hazardous Waste Management market offers a diverse range of products and services, including waste collection, transportation, treatment, disposal, and recycling. Recent technological advancements have led to the development of more efficient and environmentally friendly treatment methods, such as plasma gasification and advanced incineration. These innovations offer improved waste reduction, energy recovery, and reduced environmental impact, aligning with the increasing demand for sustainable waste management solutions. The market’s competitive landscape is shaped by factors such as technological capabilities, cost-effectiveness, and regulatory compliance.
Key Drivers, Barriers & Challenges in Hazardous Waste Management Market
Key Drivers:
- Increasing industrialization and urbanization are leading to a surge in hazardous waste generation.
- Stringent government regulations and environmental protection policies are mandating improved waste management practices.
- Advancements in waste treatment technologies are offering more efficient and sustainable solutions.
Key Challenges and Restraints:
- High capital expenditure required for establishing and maintaining waste treatment facilities.
- Fluctuating raw material prices and operational costs can impact profitability.
- Stringent regulations and compliance requirements can increase operational complexity. Non-compliance can lead to significant financial penalties (estimated at xx Million annually across the global market in fines and remediation costs).
Growth Drivers in the Hazardous Waste Management Market Market
The robust expansion of the Hazardous Waste Management market is primarily propelled by several key growth drivers. Firstly, significant technological advancements in waste treatment, including innovative incineration, stabilization, and advanced recycling techniques, are making the management of hazardous materials more effective and less harmful. Secondly, the enactment and enforcement of stricter environmental regulations across various jurisdictions mandate responsible handling, treatment, and disposal, creating a consistent demand for specialized services. Thirdly, there is a growing imperative for sustainable waste management practices as organizations and governments aim to minimize their environmental footprint. The increasing adoption of eco-friendly technologies, often supported by governmental incentives and subsidies, further catalyzes market growth. Additionally, the rising awareness among consumers and businesses regarding environmental protection and corporate social responsibility is significantly boosting the demand for ethical and responsible waste management solutions.
Challenges Impacting Hazardous Waste Management Market Growth
Challenges include high capital costs associated with implementing new technologies, the complexity of regulatory compliance across diverse regions, and fluctuations in raw material prices. Competition from other waste management providers and ensuring a secure and reliable supply chain for waste processing materials also pose challenges to market expansion.
Key Players Shaping the Hazardous Waste Management Market Market
- Suez
- Valicor
- Veolia
- Waste Connections
- Waste Management
- Republic Services
- Biffa
- Clean Harbors
- Covanta Holding
- Daiseki Co., Ltd.
- Hitachi Zosen Corporation
- Remondis SE & Co Kg
- Urbaser S.A.U.
- Biomedical Solutions Inc.
- And over 63 other prominent companies contributing to the global market.
Significant Hazardous Waste Management Market Industry Milestones
- February 2024: Waste Management (WM) announced a strategic expansion initiative, detailing plans to establish three new state-of-the-art recycling facilities across North America. This expansion is projected to significantly boost recycling capacity by an impressive 1 Million metric tons annually, with full operational capacity expected by 2026, demonstrating a commitment to enhancing resource recovery.
- April 2024: China Everbright Environment Group Limited successfully completed the construction of its Hue Waste-to-Energy Project in Vietnam. The inauguration ceremony, attended by the Prime Minister of Vietnam, underscores the growing international investment and focus on developing sustainable waste management infrastructure, particularly waste-to-energy solutions, in emerging economies.
Future Outlook for Hazardous Waste Management Market Market
The Hazardous Waste Management market is on a trajectory for sustained and accelerated growth in the coming years. This optimistic outlook is underpinned by ongoing technological innovation in areas such as advanced material recovery, waste-to-energy conversion, and secure containment solutions, coupled with the continuous reinforcement of stringent environmental regulations globally. A growing consumer and corporate awareness concerning environmental stewardship and the principles of a circular economy will further drive demand for sophisticated and responsible waste management services. Key opportunities for market players lie in forging strategic partnerships, making substantial investments in advanced waste treatment technologies, and strategically expanding their operational footprint into underserved and emerging markets. The future trajectory of the market will undoubtedly be significantly shaped by evolving government policies, international environmental agreements, and the widespread adoption of circular economy principles aimed at resource efficiency and waste minimization.
Hazardous Waste Management Market Segmentation
-
1. Type
- 1.1. Solid
- 1.2. Liquid
- 1.3. Sludge
-
2. Waste
- 2.1. Chemicals
- 2.2. Biomedical
- 2.3. Radioactive
- 2.4. Other Waste (Corrosive, Flammable, etc.)
Hazardous Waste Management Market Segmentation By Geography
-
1. North America
- 1.1. United States
- 1.2. Canada
-
2. Europe
- 2.1. Germany
- 2.2. United Kingdom
- 2.3. France
- 2.4. Russia
- 2.5. Spain
- 2.6. Rest of Europe
-
3. Asia Pacific
- 3.1. India
- 3.2. China
- 3.3. Japan
- 3.4. Rest of Asia Pacific
-
4. Middle East and Africa
- 4.1. United Arab Emirates
- 4.2. Saudi Arabia
- 4.3. Rest of Middle East
-
5. South America
- 5.1. Brazil
- 5.2. Argentina
- 5.3. Rest of South America

Hazardous Waste Management Market Regional Market Share
Geographic Coverage of Hazardous Waste Management Market
Hazardous Waste Management Market REPORT HIGHLIGHTS
| Aspects | Details |
|---|---|
| Study Period | 2020-2034 |
| Base Year | 2025 |
| Estimated Year | 2026 |
| Forecast Period | 2026-2034 |
| Historical Period | 2020-2025 |
| Growth Rate | CAGR of 3.74% from 2020-2034 |
| Segmentation |
|
Table of Contents
- 1. Introduction
- 1.1. Research Scope
- 1.2. Market Segmentation
- 1.3. Research Objective
- 1.4. Definitions and Assumptions
- 2. Executive Summary
- 2.1. Market Snapshot
- 3. Market Dynamics
- 3.1. Market Drivers
- 3.2. Market Restrains
- 3.3. Market Trends
- 3.4. Market Opportunities
- 4. Market Factor Analysis
- 4.1. Porters Five Forces
- 4.1.1. Bargaining Power of Suppliers
- 4.1.2. Bargaining Power of Buyers
- 4.1.3. Threat of New Entrants
- 4.1.4. Threat of Substitutes
- 4.1.5. Competitive Rivalry
- 4.2. PESTEL analysis
- 4.3. BCG Analysis
- 4.3.1. Stars (High Growth, High Market Share)
- 4.3.2. Cash Cows (Low Growth, High Market Share)
- 4.3.3. Question Mark (High Growth, Low Market Share)
- 4.3.4. Dogs (Low Growth, Low Market Share)
- 4.4. Ansoff Matrix Analysis
- 4.5. Supply Chain Analysis
- 4.6. Regulatory Landscape
- 4.7. Current Market Potential and Opportunity Assessment (TAM–SAM–SOM Framework)
- 4.8. TIR Analyst Note
- 4.1. Porters Five Forces
- 5. Market Analysis, Insights and Forecast 2021-2033
- 5.1. Market Analysis, Insights and Forecast - by Type
- 5.1.1. Solid
- 5.1.2. Liquid
- 5.1.3. Sludge
- 5.2. Market Analysis, Insights and Forecast - by Waste
- 5.2.1. Chemicals
- 5.2.2. Biomedical
- 5.2.3. Radioactive
- 5.2.4. Other Waste (Corrosive, Flammable, etc.)
- 5.3. Market Analysis, Insights and Forecast - by Region
- 5.3.1. North America
- 5.3.2. Europe
- 5.3.3. Asia Pacific
- 5.3.4. Middle East and Africa
- 5.3.5. South America
- 5.1. Market Analysis, Insights and Forecast - by Type
- 6. Global Hazardous Waste Management Market Analysis, Insights and Forecast, 2021-2033
- 6.1. Market Analysis, Insights and Forecast - by Type
- 6.1.1. Solid
- 6.1.2. Liquid
- 6.1.3. Sludge
- 6.2. Market Analysis, Insights and Forecast - by Waste
- 6.2.1. Chemicals
- 6.2.2. Biomedical
- 6.2.3. Radioactive
- 6.2.4. Other Waste (Corrosive, Flammable, etc.)
- 6.1. Market Analysis, Insights and Forecast - by Type
- 7. North America Hazardous Waste Management Market Analysis, Insights and Forecast, 2020-2032
- 7.1. Market Analysis, Insights and Forecast - by Type
- 7.1.1. Solid
- 7.1.2. Liquid
- 7.1.3. Sludge
- 7.2. Market Analysis, Insights and Forecast - by Waste
- 7.2.1. Chemicals
- 7.2.2. Biomedical
- 7.2.3. Radioactive
- 7.2.4. Other Waste (Corrosive, Flammable, etc.)
- 7.1. Market Analysis, Insights and Forecast - by Type
- 8. Europe Hazardous Waste Management Market Analysis, Insights and Forecast, 2020-2032
- 8.1. Market Analysis, Insights and Forecast - by Type
- 8.1.1. Solid
- 8.1.2. Liquid
- 8.1.3. Sludge
- 8.2. Market Analysis, Insights and Forecast - by Waste
- 8.2.1. Chemicals
- 8.2.2. Biomedical
- 8.2.3. Radioactive
- 8.2.4. Other Waste (Corrosive, Flammable, etc.)
- 8.1. Market Analysis, Insights and Forecast - by Type
- 9. Asia Pacific Hazardous Waste Management Market Analysis, Insights and Forecast, 2020-2032
- 9.1. Market Analysis, Insights and Forecast - by Type
- 9.1.1. Solid
- 9.1.2. Liquid
- 9.1.3. Sludge
- 9.2. Market Analysis, Insights and Forecast - by Waste
- 9.2.1. Chemicals
- 9.2.2. Biomedical
- 9.2.3. Radioactive
- 9.2.4. Other Waste (Corrosive, Flammable, etc.)
- 9.1. Market Analysis, Insights and Forecast - by Type
- 10. Middle East and Africa Hazardous Waste Management Market Analysis, Insights and Forecast, 2020-2032
- 10.1. Market Analysis, Insights and Forecast - by Type
- 10.1.1. Solid
- 10.1.2. Liquid
- 10.1.3. Sludge
- 10.2. Market Analysis, Insights and Forecast - by Waste
- 10.2.1. Chemicals
- 10.2.2. Biomedical
- 10.2.3. Radioactive
- 10.2.4. Other Waste (Corrosive, Flammable, etc.)
- 10.1. Market Analysis, Insights and Forecast - by Type
- 11. South America Hazardous Waste Management Market Analysis, Insights and Forecast, 2020-2032
- 11.1. Market Analysis, Insights and Forecast - by Type
- 11.1.1. Solid
- 11.1.2. Liquid
- 11.1.3. Sludge
- 11.2. Market Analysis, Insights and Forecast - by Waste
- 11.2.1. Chemicals
- 11.2.2. Biomedical
- 11.2.3. Radioactive
- 11.2.4. Other Waste (Corrosive, Flammable, etc.)
- 11.1. Market Analysis, Insights and Forecast - by Type
- 12. Competitive Analysis
- 12.1. Company Profiles
- 12.1.1 Suez
- 12.1.1.1. Company Overview
- 12.1.1.2. Products
- 12.1.1.3. Company Financials
- 12.1.1.4. SWOT Analysis
- 12.1.2 Valicor
- 12.1.2.1. Company Overview
- 12.1.2.2. Products
- 12.1.2.3. Company Financials
- 12.1.2.4. SWOT Analysis
- 12.1.3 Veolia
- 12.1.3.1. Company Overview
- 12.1.3.2. Products
- 12.1.3.3. Company Financials
- 12.1.3.4. SWOT Analysis
- 12.1.4 Waste Connections
- 12.1.4.1. Company Overview
- 12.1.4.2. Products
- 12.1.4.3. Company Financials
- 12.1.4.4. SWOT Analysis
- 12.1.5 Waste Management
- 12.1.5.1. Company Overview
- 12.1.5.2. Products
- 12.1.5.3. Company Financials
- 12.1.5.4. SWOT Analysis
- 12.1.6 Republic Services
- 12.1.6.1. Company Overview
- 12.1.6.2. Products
- 12.1.6.3. Company Financials
- 12.1.6.4. SWOT Analysis
- 12.1.7 Biffa
- 12.1.7.1. Company Overview
- 12.1.7.2. Products
- 12.1.7.3. Company Financials
- 12.1.7.4. SWOT Analysis
- 12.1.8 Clean Harbors
- 12.1.8.1. Company Overview
- 12.1.8.2. Products
- 12.1.8.3. Company Financials
- 12.1.8.4. SWOT Analysis
- 12.1.9 Covanta Holding
- 12.1.9.1. Company Overview
- 12.1.9.2. Products
- 12.1.9.3. Company Financials
- 12.1.9.4. SWOT Analysis
- 12.1.10 Daiseki
- 12.1.10.1. Company Overview
- 12.1.10.2. Products
- 12.1.10.3. Company Financials
- 12.1.10.4. SWOT Analysis
- 12.1.11 Hitachi Zosen
- 12.1.11.1. Company Overview
- 12.1.11.2. Products
- 12.1.11.3. Company Financials
- 12.1.11.4. SWOT Analysis
- 12.1.12 Remondis SE & Co Kg
- 12.1.12.1. Company Overview
- 12.1.12.2. Products
- 12.1.12.3. Company Financials
- 12.1.12.4. SWOT Analysis
- 12.1.13 Urbaser
- 12.1.13.1. Company Overview
- 12.1.13.2. Products
- 12.1.13.3. Company Financials
- 12.1.13.4. SWOT Analysis
- 12.1.14 Biomedical Solutions*List Not Exhaustive 6 3 Other Companie
- 12.1.14.1. Company Overview
- 12.1.14.2. Products
- 12.1.14.3. Company Financials
- 12.1.14.4. SWOT Analysis
- 12.1.1 Suez
- 12.2. Market Entropy
- 12.2.1 Company's Key Areas Served
- 12.2.2 Recent Developments
- 12.3. Company Market Share Analysis 2025
- 12.3.1 Top 5 Companies Market Share Analysis
- 12.3.2 Top 3 Companies Market Share Analysis
- 12.4. List of Potential Customers
- 13. Research Methodology
List of Figures
- Figure 1: Global Hazardous Waste Management Market Revenue Breakdown (Million, %) by Region 2025 & 2033
- Figure 2: Global Hazardous Waste Management Market Volume Breakdown (Billion, %) by Region 2025 & 2033
- Figure 3: North America Hazardous Waste Management Market Revenue (Million), by Type 2025 & 2033
- Figure 4: North America Hazardous Waste Management Market Volume (Billion), by Type 2025 & 2033
- Figure 5: North America Hazardous Waste Management Market Revenue Share (%), by Type 2025 & 2033
- Figure 6: North America Hazardous Waste Management Market Volume Share (%), by Type 2025 & 2033
- Figure 7: North America Hazardous Waste Management Market Revenue (Million), by Waste 2025 & 2033
- Figure 8: North America Hazardous Waste Management Market Volume (Billion), by Waste 2025 & 2033
- Figure 9: North America Hazardous Waste Management Market Revenue Share (%), by Waste 2025 & 2033
- Figure 10: North America Hazardous Waste Management Market Volume Share (%), by Waste 2025 & 2033
- Figure 11: North America Hazardous Waste Management Market Revenue (Million), by Country 2025 & 2033
- Figure 12: North America Hazardous Waste Management Market Volume (Billion), by Country 2025 & 2033
- Figure 13: North America Hazardous Waste Management Market Revenue Share (%), by Country 2025 & 2033
- Figure 14: North America Hazardous Waste Management Market Volume Share (%), by Country 2025 & 2033
- Figure 15: Europe Hazardous Waste Management Market Revenue (Million), by Type 2025 & 2033
- Figure 16: Europe Hazardous Waste Management Market Volume (Billion), by Type 2025 & 2033
- Figure 17: Europe Hazardous Waste Management Market Revenue Share (%), by Type 2025 & 2033
- Figure 18: Europe Hazardous Waste Management Market Volume Share (%), by Type 2025 & 2033
- Figure 19: Europe Hazardous Waste Management Market Revenue (Million), by Waste 2025 & 2033
- Figure 20: Europe Hazardous Waste Management Market Volume (Billion), by Waste 2025 & 2033
- Figure 21: Europe Hazardous Waste Management Market Revenue Share (%), by Waste 2025 & 2033
- Figure 22: Europe Hazardous Waste Management Market Volume Share (%), by Waste 2025 & 2033
- Figure 23: Europe Hazardous Waste Management Market Revenue (Million), by Country 2025 & 2033
- Figure 24: Europe Hazardous Waste Management Market Volume (Billion), by Country 2025 & 2033
- Figure 25: Europe Hazardous Waste Management Market Revenue Share (%), by Country 2025 & 2033
- Figure 26: Europe Hazardous Waste Management Market Volume Share (%), by Country 2025 & 2033
- Figure 27: Asia Pacific Hazardous Waste Management Market Revenue (Million), by Type 2025 & 2033
- Figure 28: Asia Pacific Hazardous Waste Management Market Volume (Billion), by Type 2025 & 2033
- Figure 29: Asia Pacific Hazardous Waste Management Market Revenue Share (%), by Type 2025 & 2033
- Figure 30: Asia Pacific Hazardous Waste Management Market Volume Share (%), by Type 2025 & 2033
- Figure 31: Asia Pacific Hazardous Waste Management Market Revenue (Million), by Waste 2025 & 2033
- Figure 32: Asia Pacific Hazardous Waste Management Market Volume (Billion), by Waste 2025 & 2033
- Figure 33: Asia Pacific Hazardous Waste Management Market Revenue Share (%), by Waste 2025 & 2033
- Figure 34: Asia Pacific Hazardous Waste Management Market Volume Share (%), by Waste 2025 & 2033
- Figure 35: Asia Pacific Hazardous Waste Management Market Revenue (Million), by Country 2025 & 2033
- Figure 36: Asia Pacific Hazardous Waste Management Market Volume (Billion), by Country 2025 & 2033
- Figure 37: Asia Pacific Hazardous Waste Management Market Revenue Share (%), by Country 2025 & 2033
- Figure 38: Asia Pacific Hazardous Waste Management Market Volume Share (%), by Country 2025 & 2033
- Figure 39: Middle East and Africa Hazardous Waste Management Market Revenue (Million), by Type 2025 & 2033
- Figure 40: Middle East and Africa Hazardous Waste Management Market Volume (Billion), by Type 2025 & 2033
- Figure 41: Middle East and Africa Hazardous Waste Management Market Revenue Share (%), by Type 2025 & 2033
- Figure 42: Middle East and Africa Hazardous Waste Management Market Volume Share (%), by Type 2025 & 2033
- Figure 43: Middle East and Africa Hazardous Waste Management Market Revenue (Million), by Waste 2025 & 2033
- Figure 44: Middle East and Africa Hazardous Waste Management Market Volume (Billion), by Waste 2025 & 2033
- Figure 45: Middle East and Africa Hazardous Waste Management Market Revenue Share (%), by Waste 2025 & 2033
- Figure 46: Middle East and Africa Hazardous Waste Management Market Volume Share (%), by Waste 2025 & 2033
- Figure 47: Middle East and Africa Hazardous Waste Management Market Revenue (Million), by Country 2025 & 2033
- Figure 48: Middle East and Africa Hazardous Waste Management Market Volume (Billion), by Country 2025 & 2033
- Figure 49: Middle East and Africa Hazardous Waste Management Market Revenue Share (%), by Country 2025 & 2033
- Figure 50: Middle East and Africa Hazardous Waste Management Market Volume Share (%), by Country 2025 & 2033
- Figure 51: South America Hazardous Waste Management Market Revenue (Million), by Type 2025 & 2033
- Figure 52: South America Hazardous Waste Management Market Volume (Billion), by Type 2025 & 2033
- Figure 53: South America Hazardous Waste Management Market Revenue Share (%), by Type 2025 & 2033
- Figure 54: South America Hazardous Waste Management Market Volume Share (%), by Type 2025 & 2033
- Figure 55: South America Hazardous Waste Management Market Revenue (Million), by Waste 2025 & 2033
- Figure 56: South America Hazardous Waste Management Market Volume (Billion), by Waste 2025 & 2033
- Figure 57: South America Hazardous Waste Management Market Revenue Share (%), by Waste 2025 & 2033
- Figure 58: South America Hazardous Waste Management Market Volume Share (%), by Waste 2025 & 2033
- Figure 59: South America Hazardous Waste Management Market Revenue (Million), by Country 2025 & 2033
- Figure 60: South America Hazardous Waste Management Market Volume (Billion), by Country 2025 & 2033
- Figure 61: South America Hazardous Waste Management Market Revenue Share (%), by Country 2025 & 2033
- Figure 62: South America Hazardous Waste Management Market Volume Share (%), by Country 2025 & 2033
List of Tables
- Table 1: Global Hazardous Waste Management Market Revenue Million Forecast, by Type 2020 & 2033
- Table 2: Global Hazardous Waste Management Market Volume Billion Forecast, by Type 2020 & 2033
- Table 3: Global Hazardous Waste Management Market Revenue Million Forecast, by Waste 2020 & 2033
- Table 4: Global Hazardous Waste Management Market Volume Billion Forecast, by Waste 2020 & 2033
- Table 5: Global Hazardous Waste Management Market Revenue Million Forecast, by Region 2020 & 2033
- Table 6: Global Hazardous Waste Management Market Volume Billion Forecast, by Region 2020 & 2033
- Table 7: Global Hazardous Waste Management Market Revenue Million Forecast, by Type 2020 & 2033
- Table 8: Global Hazardous Waste Management Market Volume Billion Forecast, by Type 2020 & 2033
- Table 9: Global Hazardous Waste Management Market Revenue Million Forecast, by Waste 2020 & 2033
- Table 10: Global Hazardous Waste Management Market Volume Billion Forecast, by Waste 2020 & 2033
- Table 11: Global Hazardous Waste Management Market Revenue Million Forecast, by Country 2020 & 2033
- Table 12: Global Hazardous Waste Management Market Volume Billion Forecast, by Country 2020 & 2033
- Table 13: United States Hazardous Waste Management Market Revenue (Million) Forecast, by Application 2020 & 2033
- Table 14: United States Hazardous Waste Management Market Volume (Billion) Forecast, by Application 2020 & 2033
- Table 15: Canada Hazardous Waste Management Market Revenue (Million) Forecast, by Application 2020 & 2033
- Table 16: Canada Hazardous Waste Management Market Volume (Billion) Forecast, by Application 2020 & 2033
- Table 17: Global Hazardous Waste Management Market Revenue Million Forecast, by Type 2020 & 2033
- Table 18: Global Hazardous Waste Management Market Volume Billion Forecast, by Type 2020 & 2033
- Table 19: Global Hazardous Waste Management Market Revenue Million Forecast, by Waste 2020 & 2033
- Table 20: Global Hazardous Waste Management Market Volume Billion Forecast, by Waste 2020 & 2033
- Table 21: Global Hazardous Waste Management Market Revenue Million Forecast, by Country 2020 & 2033
- Table 22: Global Hazardous Waste Management Market Volume Billion Forecast, by Country 2020 & 2033
- Table 23: Germany Hazardous Waste Management Market Revenue (Million) Forecast, by Application 2020 & 2033
- Table 24: Germany Hazardous Waste Management Market Volume (Billion) Forecast, by Application 2020 & 2033
- Table 25: United Kingdom Hazardous Waste Management Market Revenue (Million) Forecast, by Application 2020 & 2033
- Table 26: United Kingdom Hazardous Waste Management Market Volume (Billion) Forecast, by Application 2020 & 2033
- Table 27: France Hazardous Waste Management Market Revenue (Million) Forecast, by Application 2020 & 2033
- Table 28: France Hazardous Waste Management Market Volume (Billion) Forecast, by Application 2020 & 2033
- Table 29: Russia Hazardous Waste Management Market Revenue (Million) Forecast, by Application 2020 & 2033
- Table 30: Russia Hazardous Waste Management Market Volume (Billion) Forecast, by Application 2020 & 2033
- Table 31: Spain Hazardous Waste Management Market Revenue (Million) Forecast, by Application 2020 & 2033
- Table 32: Spain Hazardous Waste Management Market Volume (Billion) Forecast, by Application 2020 & 2033
- Table 33: Rest of Europe Hazardous Waste Management Market Revenue (Million) Forecast, by Application 2020 & 2033
- Table 34: Rest of Europe Hazardous Waste Management Market Volume (Billion) Forecast, by Application 2020 & 2033
- Table 35: Global Hazardous Waste Management Market Revenue Million Forecast, by Type 2020 & 2033
- Table 36: Global Hazardous Waste Management Market Volume Billion Forecast, by Type 2020 & 2033
- Table 37: Global Hazardous Waste Management Market Revenue Million Forecast, by Waste 2020 & 2033
- Table 38: Global Hazardous Waste Management Market Volume Billion Forecast, by Waste 2020 & 2033
- Table 39: Global Hazardous Waste Management Market Revenue Million Forecast, by Country 2020 & 2033
- Table 40: Global Hazardous Waste Management Market Volume Billion Forecast, by Country 2020 & 2033
- Table 41: India Hazardous Waste Management Market Revenue (Million) Forecast, by Application 2020 & 2033
- Table 42: India Hazardous Waste Management Market Volume (Billion) Forecast, by Application 2020 & 2033
- Table 43: China Hazardous Waste Management Market Revenue (Million) Forecast, by Application 2020 & 2033
- Table 44: China Hazardous Waste Management Market Volume (Billion) Forecast, by Application 2020 & 2033
- Table 45: Japan Hazardous Waste Management Market Revenue (Million) Forecast, by Application 2020 & 2033
- Table 46: Japan Hazardous Waste Management Market Volume (Billion) Forecast, by Application 2020 & 2033
- Table 47: Rest of Asia Pacific Hazardous Waste Management Market Revenue (Million) Forecast, by Application 2020 & 2033
- Table 48: Rest of Asia Pacific Hazardous Waste Management Market Volume (Billion) Forecast, by Application 2020 & 2033
- Table 49: Global Hazardous Waste Management Market Revenue Million Forecast, by Type 2020 & 2033
- Table 50: Global Hazardous Waste Management Market Volume Billion Forecast, by Type 2020 & 2033
- Table 51: Global Hazardous Waste Management Market Revenue Million Forecast, by Waste 2020 & 2033
- Table 52: Global Hazardous Waste Management Market Volume Billion Forecast, by Waste 2020 & 2033
- Table 53: Global Hazardous Waste Management Market Revenue Million Forecast, by Country 2020 & 2033
- Table 54: Global Hazardous Waste Management Market Volume Billion Forecast, by Country 2020 & 2033
- Table 55: United Arab Emirates Hazardous Waste Management Market Revenue (Million) Forecast, by Application 2020 & 2033
- Table 56: United Arab Emirates Hazardous Waste Management Market Volume (Billion) Forecast, by Application 2020 & 2033
- Table 57: Saudi Arabia Hazardous Waste Management Market Revenue (Million) Forecast, by Application 2020 & 2033
- Table 58: Saudi Arabia Hazardous Waste Management Market Volume (Billion) Forecast, by Application 2020 & 2033
- Table 59: Rest of Middle East Hazardous Waste Management Market Revenue (Million) Forecast, by Application 2020 & 2033
- Table 60: Rest of Middle East Hazardous Waste Management Market Volume (Billion) Forecast, by Application 2020 & 2033
- Table 61: Global Hazardous Waste Management Market Revenue Million Forecast, by Type 2020 & 2033
- Table 62: Global Hazardous Waste Management Market Volume Billion Forecast, by Type 2020 & 2033
- Table 63: Global Hazardous Waste Management Market Revenue Million Forecast, by Waste 2020 & 2033
- Table 64: Global Hazardous Waste Management Market Volume Billion Forecast, by Waste 2020 & 2033
- Table 65: Global Hazardous Waste Management Market Revenue Million Forecast, by Country 2020 & 2033
- Table 66: Global Hazardous Waste Management Market Volume Billion Forecast, by Country 2020 & 2033
- Table 67: Brazil Hazardous Waste Management Market Revenue (Million) Forecast, by Application 2020 & 2033
- Table 68: Brazil Hazardous Waste Management Market Volume (Billion) Forecast, by Application 2020 & 2033
- Table 69: Argentina Hazardous Waste Management Market Revenue (Million) Forecast, by Application 2020 & 2033
- Table 70: Argentina Hazardous Waste Management Market Volume (Billion) Forecast, by Application 2020 & 2033
- Table 71: Rest of South America Hazardous Waste Management Market Revenue (Million) Forecast, by Application 2020 & 2033
- Table 72: Rest of South America Hazardous Waste Management Market Volume (Billion) Forecast, by Application 2020 & 2033
Frequently Asked Questions
1. What is the projected Compound Annual Growth Rate (CAGR) of the Hazardous Waste Management Market?
The projected CAGR is approximately 3.74%.
2. Which companies are prominent players in the Hazardous Waste Management Market?
Key companies in the market include Suez, Valicor, Veolia, Waste Connections, Waste Management, Republic Services, Biffa, Clean Harbors, Covanta Holding, Daiseki, Hitachi Zosen, Remondis SE & Co Kg, Urbaser, Biomedical Solutions*List Not Exhaustive 6 3 Other Companie.
3. What are the main segments of the Hazardous Waste Management Market?
The market segments include Type, Waste.
4. Can you provide details about the market size?
The market size is estimated to be USD 38.77 Million as of 2022.
5. What are some drivers contributing to market growth?
Stringent Global Environmental Regulations Drive Demand for Compliant Hazardous Waste Management and Disposal Solutions; Increased Industrial Activities and Urbanization Driving up Hazardous Waste Production. Fueling Demand for Waste Management Services; Innovations in Waste Treatment Technologies. such as Advanced Recycling and Waste-to-Energy Processes. Enhance Efficiency and Reduce Environmental Impact.
6. What are the notable trends driving market growth?
Asia-Pacific Expected to Dominate the Market Over the Coming Years.
7. Are there any restraints impacting market growth?
Stringent Global Environmental Regulations Drive Demand for Compliant Hazardous Waste Management and Disposal Solutions; Increased Industrial Activities and Urbanization Driving up Hazardous Waste Production. Fueling Demand for Waste Management Services; Innovations in Waste Treatment Technologies. such as Advanced Recycling and Waste-to-Energy Processes. Enhance Efficiency and Reduce Environmental Impact.
8. Can you provide examples of recent developments in the market?
April 2024: China Everbright Environment Group Limited, known as Everbright Environment, celebrated the successful construction of its Hue Waste-to-Energy Project in Thua Thien Hue Province, Vietnam. The event was graced by the presence of Vietnamese Prime Minister Pham Minh Chinh.
9. What pricing options are available for accessing the report?
Pricing options include single-user, multi-user, and enterprise licenses priced at USD 4750, USD 5250, and USD 8750 respectively.
10. Is the market size provided in terms of value or volume?
The market size is provided in terms of value, measured in Million and volume, measured in Billion.
11. Are there any specific market keywords associated with the report?
Yes, the market keyword associated with the report is "Hazardous Waste Management Market," which aids in identifying and referencing the specific market segment covered.
12. How do I determine which pricing option suits my needs best?
The pricing options vary based on user requirements and access needs. Individual users may opt for single-user licenses, while businesses requiring broader access may choose multi-user or enterprise licenses for cost-effective access to the report.
13. Are there any additional resources or data provided in the Hazardous Waste Management Market report?
While the report offers comprehensive insights, it's advisable to review the specific contents or supplementary materials provided to ascertain if additional resources or data are available.
14. How can I stay updated on further developments or reports in the Hazardous Waste Management Market?
To stay informed about further developments, trends, and reports in the Hazardous Waste Management Market, consider subscribing to industry newsletters, following relevant companies and organizations, or regularly checking reputable industry news sources and publications.
Methodology
Step 1 - Identification of Relevant Samples Size from Population Database


Step 2 - Approaches for Defining Global Market Size (Value, Volume* & Price*)

Note*: In applicable scenarios
Step 3 - Data Sources
Primary Research
- Web Analytics
- Survey Reports
- Research Institute
- Latest Research Reports
- Opinion Leaders
Secondary Research
- Annual Reports
- White Paper
- Latest Press Release
- Industry Association
- Paid Database
- Investor Presentations

Step 4 - Data Triangulation
Involves using different sources of information in order to increase the validity of a study
These sources are likely to be stakeholders in a program - participants, other researchers, program staff, other community members, and so on.
Then we put all data in single framework & apply various statistical tools to find out the dynamic on the market.
During the analysis stage, feedback from the stakeholder groups would be compared to determine areas of agreement as well as areas of divergence