

Key Insights
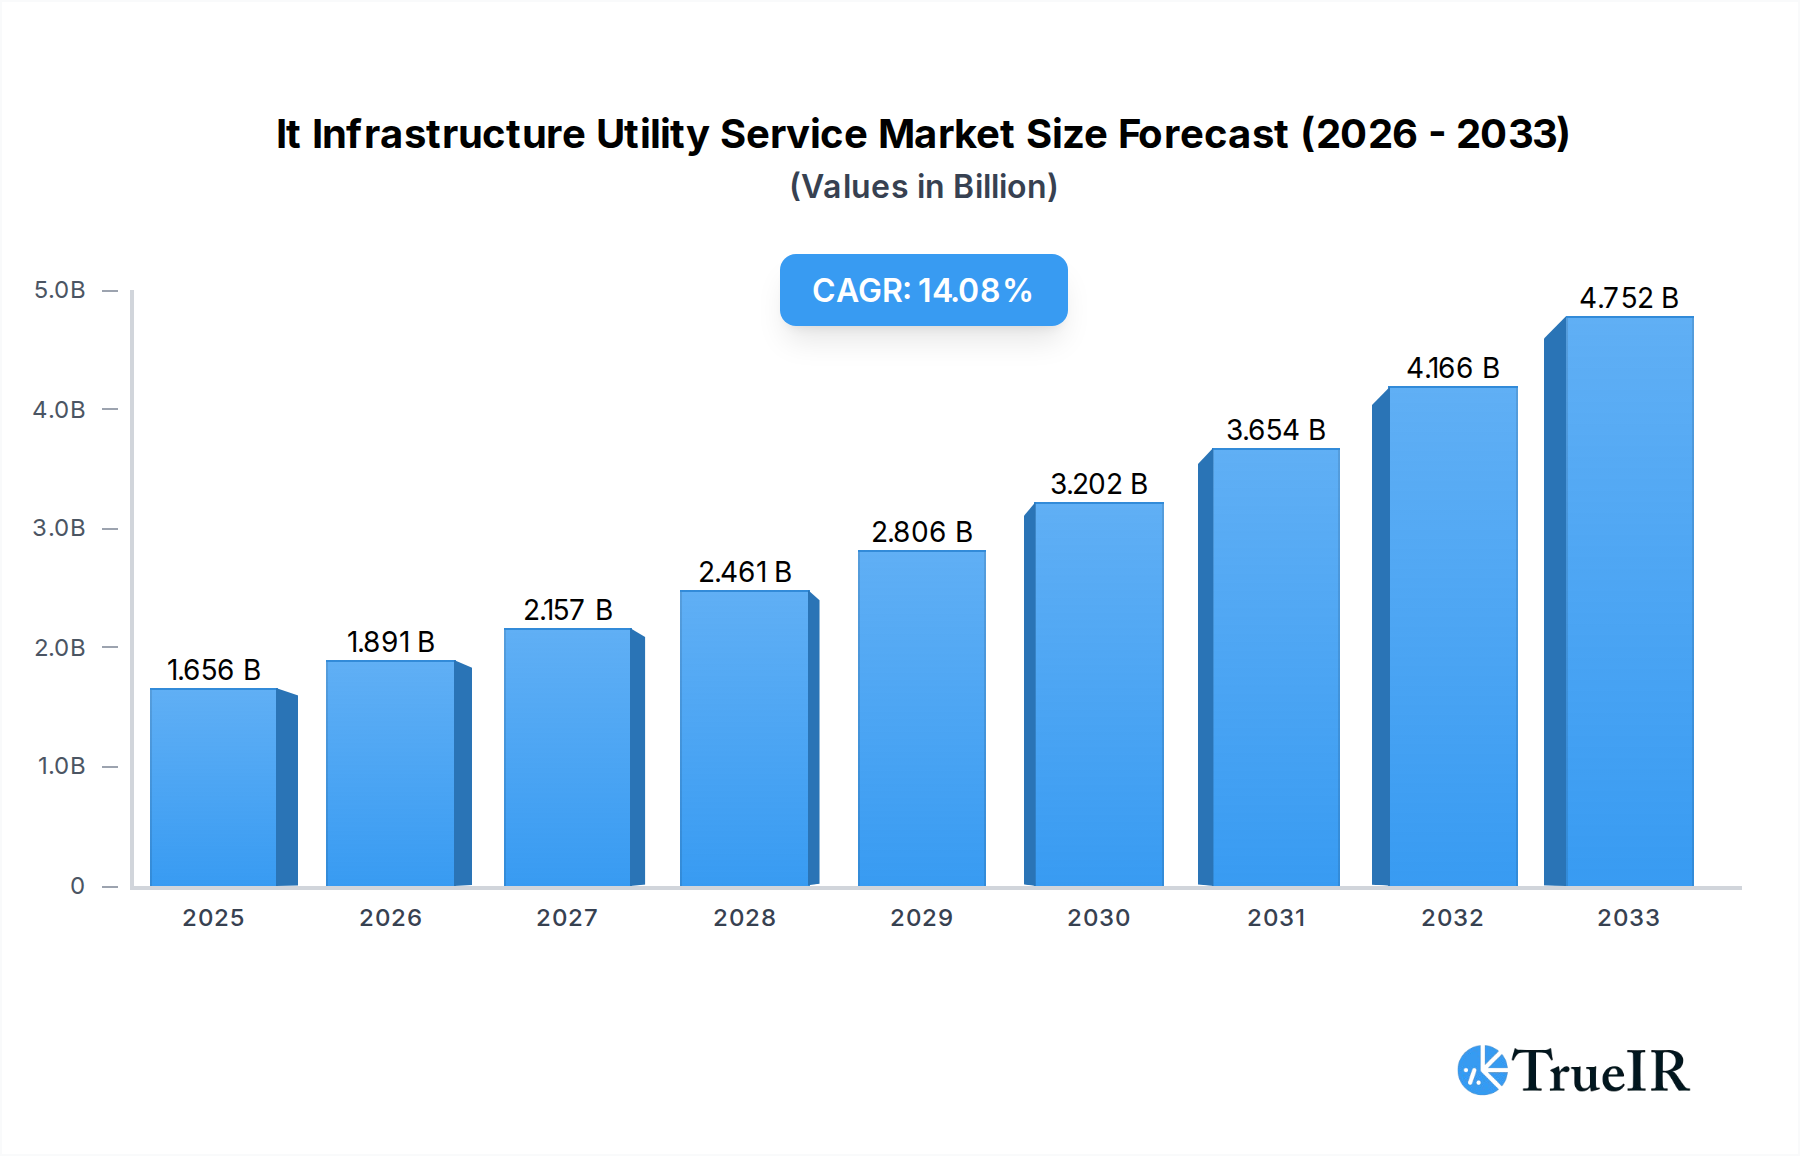
The IT Infrastructure Utility Service market is poised for substantial expansion, projected to reach an estimated $1656 million by 2025, and is anticipated to grow at a robust Compound Annual Growth Rate (CAGR) of 14.3% during the forecast period of 2025-2033. This significant growth is fueled by the increasing reliance of businesses across all sizes on agile, scalable, and cost-effective IT infrastructure solutions. As organizations increasingly recognize the strategic advantage of outsourcing infrastructure management to specialized providers, the demand for utility-based services, offering flexibility and pay-as-you-go models, is soaring. Key drivers include the digital transformation initiatives, the proliferation of cloud computing, the need for enhanced cybersecurity, and the growing adoption of advanced technologies like AI and IoT, all of which necessitate robust and adaptable IT backbones. The market's trajectory indicates a shift towards a more service-oriented and consumption-based approach to IT infrastructure, moving away from traditional capital expenditure models.

It Infrastructure Utility Service Market Size (In Billion)
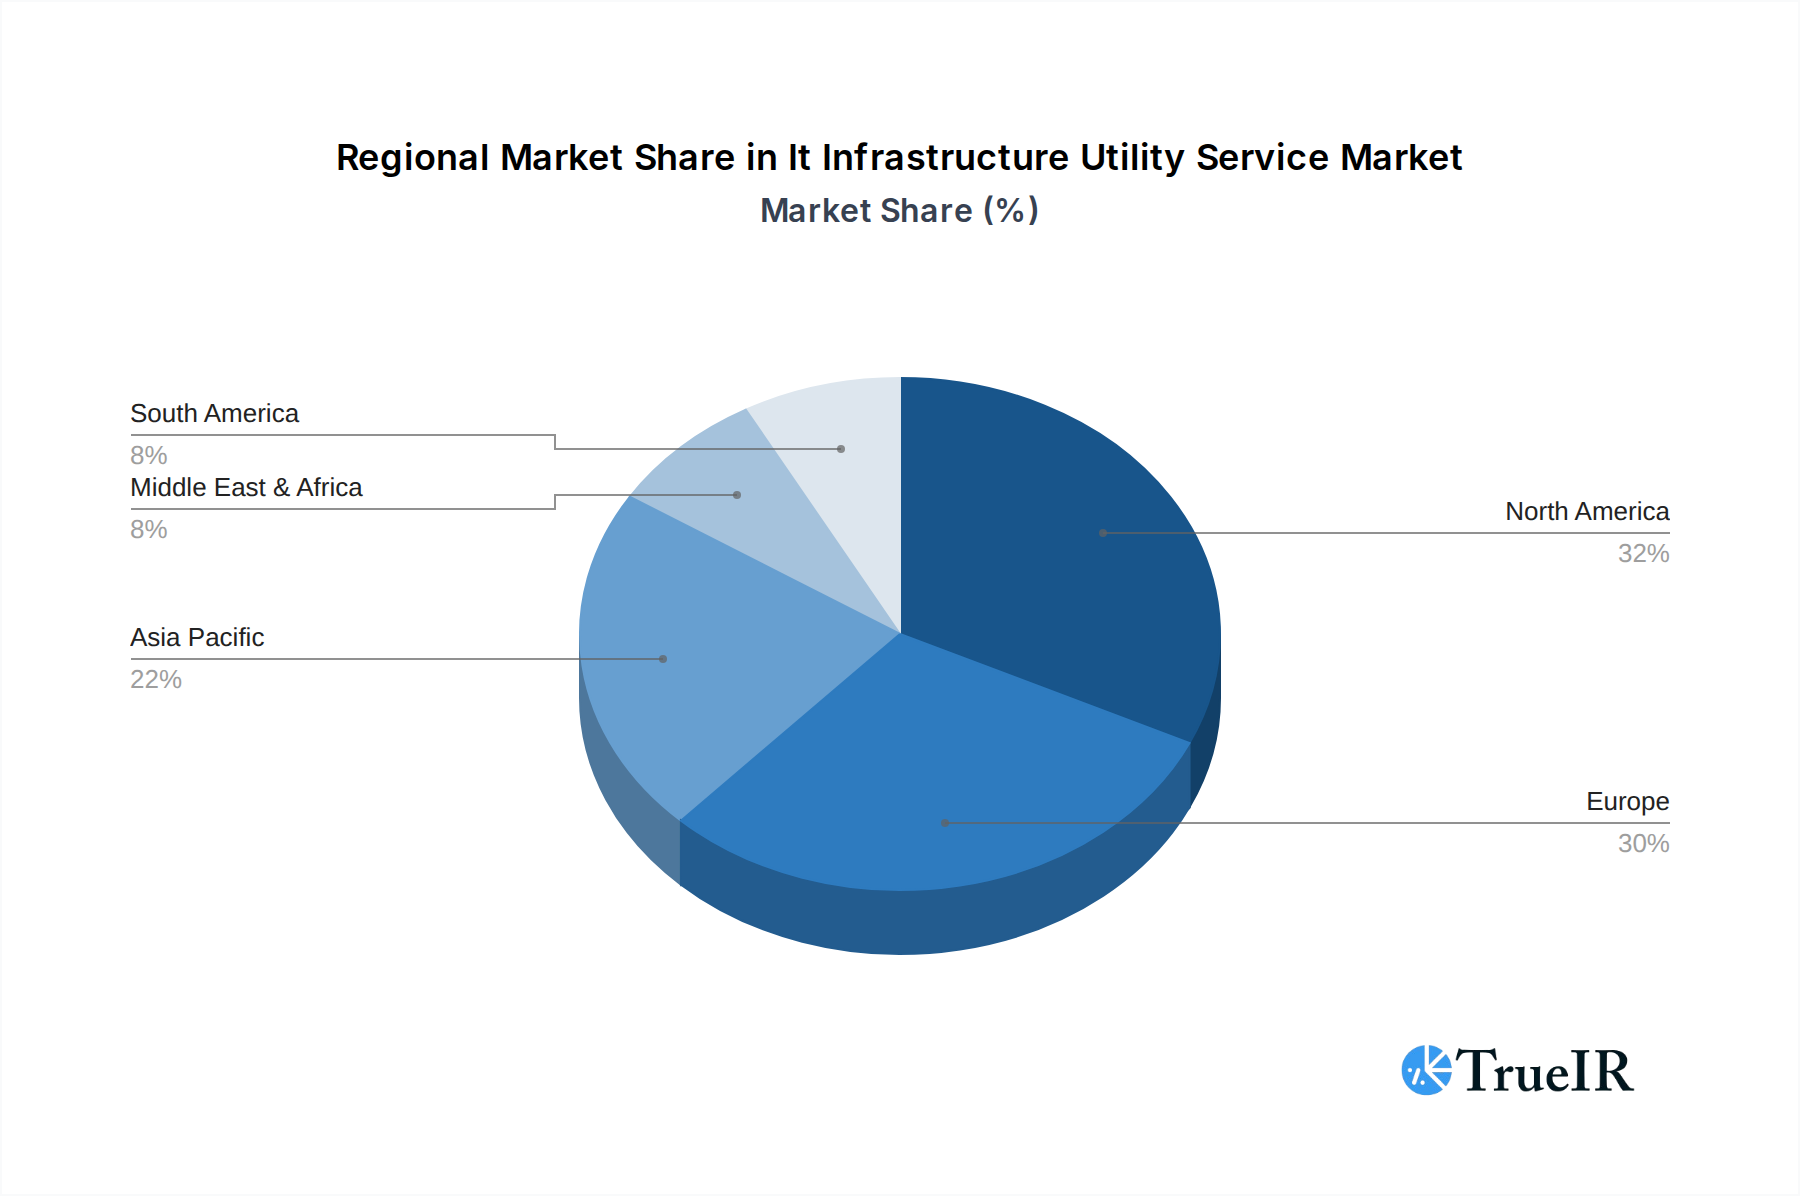
The market is segmented by application into Large Enterprises and SMEs, with both segments demonstrating strong adoption, though SMEs are increasingly leveraging these services to compete with larger players on a more level playing field. By type, Online Services are expected to dominate due to their accessibility and efficiency, while Offline Services will cater to specific niche requirements and legacy systems. Geographically, North America and Europe are currently leading markets, driven by early adoption of advanced technologies and established digital infrastructure. However, the Asia Pacific region is emerging as a high-growth area, propelled by rapid digitalization, a burgeoning startup ecosystem, and increasing investments in cloud and IT services. Major players such as IBM, Accenture, and CapGemini are actively shaping the market landscape through strategic partnerships, service innovations, and geographical expansions, competing to capture a larger share of this dynamic and evolving sector.
It Infrastructure Utility Service Company Market Share
This comprehensive report delves into the dynamic IT Infrastructure Utility Service Market, offering unparalleled insights into its structure, trends, and future trajectory. Covering the Study Period of 2019–2033, with a Base Year of 2025 and an Estimated Year also of 2025, this analysis provides a robust Forecast Period of 2025–2033, building upon the Historical Period of 2019–2024.
It Infrastructure Utility Service Market Structure & Competitive Landscape
The IT Infrastructure Utility Service market is characterized by a moderate to high concentration, with leading players like IBM, Accenture, Atos, and Capgemini holding significant market share. Innovation is a key driver, fueled by continuous advancements in cloud computing, AI-driven automation, and cybersecurity solutions, collectively worth over ten million dollars annually in R&D investment. Regulatory impacts are also significant, with data privacy laws and compliance standards influencing service delivery and adoption across various industries. Product substitutes, primarily in-house IT management solutions, are gradually being displaced by the cost-efficiency and scalability of utility services, estimated to represent a market substitution opportunity worth over five million dollars. End-user segmentation reveals a strong demand from Large Enterprises, representing over seventy percent of the market, followed by SMEs, who are increasingly adopting these services for their agility and cost-effectiveness. Mergers and Acquisitions (M&A) trends are active, with over twenty M&A deals recorded in the historical period, valued in the hundreds of millions, indicating consolidation and strategic expansion within the industry. Key players are actively acquiring smaller specialized firms to enhance their portfolios and geographic reach.
It Infrastructure Utility Service Market Trends & Opportunities
The IT Infrastructure Utility Service market is poised for substantial expansion, projecting a market size growth from an estimated xx million dollars in 2025 to over xx million dollars by 2033. This growth is driven by a compound annual growth rate (CAGR) of approximately xx%, reflecting a robust demand for flexible and scalable IT solutions. Technological shifts are at the forefront of this expansion, with the pervasive adoption of cloud-native architectures, serverless computing, and edge computing revolutionizing how businesses access and manage their IT resources. Artificial intelligence and machine learning are increasingly integrated into utility services for predictive maintenance, automated resource allocation, and enhanced cybersecurity, creating new avenues for service innovation. Consumer preferences are evolving towards "as-a-service" models, prioritizing operational expenditure (OpEx) over capital expenditure (CapEx) and demanding higher levels of service assurance and agility. This is evident in the increasing market penetration rates of managed cloud services, which have surpassed xx% among large enterprises. Competitive dynamics are intensifying, with established IT giants like IBM and Accenture leveraging their extensive expertise and global reach, while agile players such as Asseco Poland and Cognizant are carving out niches through specialized offerings and a focus on specific industry verticals. The ongoing digital transformation initiatives across all sectors are a primary catalyst, compelling organizations to modernize their IT infrastructure to remain competitive. Furthermore, the burgeoning demand for data analytics and the rise of the Internet of Things (IoT) are creating new opportunities for IT infrastructure utility providers to offer specialized solutions for data ingestion, storage, and processing. The shift towards hybrid and multi-cloud environments also presents a significant opportunity for providers to offer seamless integration and management services. The increasing adoption of DevOps practices by businesses further fuels the demand for flexible and responsive IT infrastructure that can support rapid application development and deployment cycles. Emerging markets, particularly in Asia-Pacific and Latin America, are showing immense potential for growth due to their increasing digital maturity and a growing appetite for advanced IT services. The ongoing focus on sustainability and energy-efficient IT solutions is also shaping market trends, with providers offering green IT infrastructure options to meet environmental goals.
Dominant Markets & Segments in It Infrastructure Utility Service
The Large Enterprises segment is the dominant force within the IT Infrastructure Utility Service market, accounting for over seventy percent of the total market value, estimated at over xx million dollars in 2025. This dominance is driven by their inherent need for robust, scalable, and secure IT infrastructure to support complex operations, extensive data volumes, and a global workforce. Key growth drivers within this segment include the continuous need for digital transformation initiatives, the migration of legacy systems to the cloud, and the implementation of advanced analytics and AI solutions, all of which necessitate significant IT infrastructure investments. Furthermore, large enterprises benefit immensely from the cost optimization and operational efficiency offered by utility services, allowing them to reallocate resources to core business functions.
In terms of Type, Online Service holds a commanding position, projected to reach over xx million dollars by 2033. This is a direct reflection of the global shift towards digital delivery models and the inherent advantages of cloud-based solutions, including accessibility, scalability, and rapid deployment. Key growth drivers for online services include the widespread availability of high-speed internet, the increasing adoption of remote work policies, and the growing preference for self-service management portals.
The SMEs segment, while smaller in current market share at an estimated xx million dollars, is demonstrating the fastest growth trajectory. This surge is fueled by the increasing realization among small and medium-sized businesses of the strategic advantages of outsourcing their IT infrastructure. Key growth drivers for SMEs include their need for cost-effective IT solutions that don't require significant upfront capital investment, the desire for access to enterprise-grade technology and expertise, and the ability to scale their IT resources up or down rapidly in response to business fluctuations. Policies and initiatives aimed at supporting SME digital adoption are also playing a crucial role.
The Offline Service segment, while still relevant, is witnessing a more subdued growth compared to its online counterpart, estimated at around xx million dollars. This segment primarily caters to specific niche requirements where online access might be limited or where physical presence for installation, maintenance, and support is critical, such as in certain industrial or remote operational environments. However, the overarching trend is a gradual shift towards integrated online and offline service models, where physical support is complemented by robust online management and monitoring tools.
It Infrastructure Utility Service Product Analysis
IT Infrastructure Utility Service products are increasingly characterized by their modularity, scalability, and intelligence. Innovations focus on delivering highly automated and self-healing infrastructure, powered by AI and machine learning for predictive maintenance and resource optimization. Competitive advantages lie in offering hybrid and multi-cloud management capabilities, robust cybersecurity features, and flexible pay-as-you-go pricing models. These advancements are tailored to meet the evolving demands of both large enterprises and SMEs, enabling businesses to achieve greater agility, cost savings, and operational efficiency while ensuring compliance and security.
Key Drivers, Barriers & Challenges in It Infrastructure Utility Service
The IT Infrastructure Utility Service market is propelled by several key drivers, including the relentless demand for digital transformation across industries, the economic benefits of OpEx models over CapEx, and the growing need for agility and scalability in IT operations. Technological advancements in cloud computing, AI, and automation are also significant catalysts, enabling more efficient and intelligent service delivery.
Conversely, the market faces considerable barriers and challenges. Regulatory complexities, particularly concerning data privacy and sovereignty, pose significant hurdles. Supply chain disruptions, though less prevalent in digital services, can impact hardware provisioning for on-premise components of hybrid solutions. Fierce competitive pressures from established players and emerging niche providers necessitate continuous innovation and cost management. Security threats and the constant need to adapt to evolving cyber risks add another layer of complexity, impacting customer trust and adoption.
Growth Drivers in the It Infrastructure Utility Service Market
The IT Infrastructure Utility Service market's growth is significantly influenced by several factors. The accelerating pace of digital transformation across all sectors is a primary driver, compelling businesses to adopt agile and scalable IT solutions. Economic factors, such as the preference for operational expenditure (OpEx) models over capital expenditure (CapEx), make utility services an attractive proposition. Furthermore, technological advancements in areas like AI-powered automation, hybrid cloud management, and enhanced cybersecurity solutions are continuously expanding the service offerings and value proposition for businesses.
Challenges Impacting It Infrastructure Utility Service Growth
Despite its robust growth, the IT Infrastructure Utility Service market faces several critical challenges. Evolving regulatory landscapes, particularly regarding data localization and privacy laws across different jurisdictions, can create complexity and compliance burdens. Supply chain vulnerabilities, while less direct for purely cloud-based services, can affect the availability and cost of underlying hardware for hybrid or on-premise solutions. Intense competitive pressures from a multitude of providers, ranging from global behemoths to specialized niche players, necessitate constant innovation and aggressive pricing strategies. Moreover, the persistent and evolving nature of cybersecurity threats requires substantial and continuous investment in robust security measures to maintain customer confidence.
Key Players Shaping the It Infrastructure Utility Service Market
- IBM
- Accenture
- Asseco Poland
- Atos
- CapGemini
- CenturyLink
- Cognizant
- Fidel Technologies
- Fujitsu
- CMS IT Services Pvt. Ltd.
- Itransition
- KaryaTech
- Mazenet
- NE Digital
- TenFour
- Verizon Enterprise
Significant It Infrastructure Utility Service Industry Milestones
- 2019: Increased adoption of hybrid cloud strategies by major enterprises, driving demand for integrated utility services.
- 2020: Accelerated digital transformation due to the global pandemic, leading to a surge in cloud-based IT infrastructure demand.
- 2021: Significant investments in AI and automation for IT infrastructure management by leading service providers.
- 2022: Enhanced focus on cybersecurity and data privacy compliance as regulatory frameworks evolve.
- 2023: Growing trend of multi-cloud adoption and the emergence of specialized cloud management platforms.
- 2024: Increased market consolidation through strategic mergers and acquisitions, focusing on specialized service offerings.
Future Outlook for It Infrastructure Utility Service Market
The future outlook for the IT Infrastructure Utility Service market is exceptionally promising, driven by continued digital transformation and the persistent demand for flexible, scalable, and cost-effective IT solutions. Strategic opportunities lie in further leveraging AI and machine learning for predictive analytics, autonomous IT operations, and enhanced cybersecurity. The expansion of edge computing and the increasing adoption of IoT will create new avenues for specialized infrastructure services. Providers that can offer seamless hybrid and multi-cloud management, coupled with robust sustainability initiatives, will be well-positioned for significant market share growth in the coming years, projecting continued robust expansion from 2025 through 2033.
It Infrastructure Utility Service Segmentation
-
1. Application
- 1.1. Large Enterprises
- 1.2. SMEs
-
2. Type
- 2.1. Online Service
- 2.2. Offline Service
It Infrastructure Utility Service Segmentation By Geography
-
1. North America
- 1.1. United States
- 1.2. Canada
- 1.3. Mexico
-
2. South America
- 2.1. Brazil
- 2.2. Argentina
- 2.3. Rest of South America
-
3. Europe
- 3.1. United Kingdom
- 3.2. Germany
- 3.3. France
- 3.4. Italy
- 3.5. Spain
- 3.6. Russia
- 3.7. Benelux
- 3.8. Nordics
- 3.9. Rest of Europe
-
4. Middle East & Africa
- 4.1. Turkey
- 4.2. Israel
- 4.3. GCC
- 4.4. North Africa
- 4.5. South Africa
- 4.6. Rest of Middle East & Africa
-
5. Asia Pacific
- 5.1. China
- 5.2. India
- 5.3. Japan
- 5.4. South Korea
- 5.5. ASEAN
- 5.6. Oceania
- 5.7. Rest of Asia Pacific
It Infrastructure Utility Service Regional Market Share
Geographic Coverage of It Infrastructure Utility Service
It Infrastructure Utility Service REPORT HIGHLIGHTS
| Aspects | Details |
|---|---|
| Study Period | 2020-2034 |
| Base Year | 2025 |
| Estimated Year | 2026 |
| Forecast Period | 2026-2034 |
| Historical Period | 2020-2025 |
| Growth Rate | CAGR of 14.3% from 2020-2034 |
| Segmentation |
|
Table of Contents
- 1. Introduction
- 1.1. Research Scope
- 1.2. Market Segmentation
- 1.3. Research Objective
- 1.4. Definitions and Assumptions
- 2. Executive Summary
- 2.1. Market Snapshot
- 3. Market Dynamics
- 3.1. Market Drivers
- 3.2. Market Restrains
- 3.3. Market Trends
- 3.4. Market Opportunities
- 4. Market Factor Analysis
- 4.1. Porters Five Forces
- 4.1.1. Bargaining Power of Suppliers
- 4.1.2. Bargaining Power of Buyers
- 4.1.3. Threat of New Entrants
- 4.1.4. Threat of Substitutes
- 4.1.5. Competitive Rivalry
- 4.2. PESTEL analysis
- 4.3. BCG Analysis
- 4.3.1. Stars (High Growth, High Market Share)
- 4.3.2. Cash Cows (Low Growth, High Market Share)
- 4.3.3. Question Mark (High Growth, Low Market Share)
- 4.3.4. Dogs (Low Growth, Low Market Share)
- 4.4. Ansoff Matrix Analysis
- 4.5. Supply Chain Analysis
- 4.6. Regulatory Landscape
- 4.7. Current Market Potential and Opportunity Assessment (TAM–SAM–SOM Framework)
- 4.8. TIR Analyst Note
- 4.1. Porters Five Forces
- 5. Market Analysis, Insights and Forecast 2021-2033
- 5.1. Market Analysis, Insights and Forecast - by Application
- 5.1.1. Large Enterprises
- 5.1.2. SMEs
- 5.2. Market Analysis, Insights and Forecast - by Type
- 5.2.1. Online Service
- 5.2.2. Offline Service
- 5.3. Market Analysis, Insights and Forecast - by Region
- 5.3.1. North America
- 5.3.2. South America
- 5.3.3. Europe
- 5.3.4. Middle East & Africa
- 5.3.5. Asia Pacific
- 5.1. Market Analysis, Insights and Forecast - by Application
- 6. Global It Infrastructure Utility Service Analysis, Insights and Forecast, 2021-2033
- 6.1. Market Analysis, Insights and Forecast - by Application
- 6.1.1. Large Enterprises
- 6.1.2. SMEs
- 6.2. Market Analysis, Insights and Forecast - by Type
- 6.2.1. Online Service
- 6.2.2. Offline Service
- 6.1. Market Analysis, Insights and Forecast - by Application
- 7. North America It Infrastructure Utility Service Analysis, Insights and Forecast, 2020-2032
- 7.1. Market Analysis, Insights and Forecast - by Application
- 7.1.1. Large Enterprises
- 7.1.2. SMEs
- 7.2. Market Analysis, Insights and Forecast - by Type
- 7.2.1. Online Service
- 7.2.2. Offline Service
- 7.1. Market Analysis, Insights and Forecast - by Application
- 8. South America It Infrastructure Utility Service Analysis, Insights and Forecast, 2020-2032
- 8.1. Market Analysis, Insights and Forecast - by Application
- 8.1.1. Large Enterprises
- 8.1.2. SMEs
- 8.2. Market Analysis, Insights and Forecast - by Type
- 8.2.1. Online Service
- 8.2.2. Offline Service
- 8.1. Market Analysis, Insights and Forecast - by Application
- 9. Europe It Infrastructure Utility Service Analysis, Insights and Forecast, 2020-2032
- 9.1. Market Analysis, Insights and Forecast - by Application
- 9.1.1. Large Enterprises
- 9.1.2. SMEs
- 9.2. Market Analysis, Insights and Forecast - by Type
- 9.2.1. Online Service
- 9.2.2. Offline Service
- 9.1. Market Analysis, Insights and Forecast - by Application
- 10. Middle East & Africa It Infrastructure Utility Service Analysis, Insights and Forecast, 2020-2032
- 10.1. Market Analysis, Insights and Forecast - by Application
- 10.1.1. Large Enterprises
- 10.1.2. SMEs
- 10.2. Market Analysis, Insights and Forecast - by Type
- 10.2.1. Online Service
- 10.2.2. Offline Service
- 10.1. Market Analysis, Insights and Forecast - by Application
- 11. Asia Pacific It Infrastructure Utility Service Analysis, Insights and Forecast, 2020-2032
- 11.1. Market Analysis, Insights and Forecast - by Application
- 11.1.1. Large Enterprises
- 11.1.2. SMEs
- 11.2. Market Analysis, Insights and Forecast - by Type
- 11.2.1. Online Service
- 11.2.2. Offline Service
- 11.1. Market Analysis, Insights and Forecast - by Application
- 12. Competitive Analysis
- 12.1. Company Profiles
- 12.1.1 IBM
- 12.1.1.1. Company Overview
- 12.1.1.2. Products
- 12.1.1.3. Company Financials
- 12.1.1.4. SWOT Analysis
- 12.1.2 Accenture
- 12.1.2.1. Company Overview
- 12.1.2.2. Products
- 12.1.2.3. Company Financials
- 12.1.2.4. SWOT Analysis
- 12.1.3 Asseco Poland
- 12.1.3.1. Company Overview
- 12.1.3.2. Products
- 12.1.3.3. Company Financials
- 12.1.3.4. SWOT Analysis
- 12.1.4 Atos
- 12.1.4.1. Company Overview
- 12.1.4.2. Products
- 12.1.4.3. Company Financials
- 12.1.4.4. SWOT Analysis
- 12.1.5 CapGemini
- 12.1.5.1. Company Overview
- 12.1.5.2. Products
- 12.1.5.3. Company Financials
- 12.1.5.4. SWOT Analysis
- 12.1.6 CenturyLink
- 12.1.6.1. Company Overview
- 12.1.6.2. Products
- 12.1.6.3. Company Financials
- 12.1.6.4. SWOT Analysis
- 12.1.7 Cognizant
- 12.1.7.1. Company Overview
- 12.1.7.2. Products
- 12.1.7.3. Company Financials
- 12.1.7.4. SWOT Analysis
- 12.1.8 Fidel Technologies
- 12.1.8.1. Company Overview
- 12.1.8.2. Products
- 12.1.8.3. Company Financials
- 12.1.8.4. SWOT Analysis
- 12.1.9 Fujitsu
- 12.1.9.1. Company Overview
- 12.1.9.2. Products
- 12.1.9.3. Company Financials
- 12.1.9.4. SWOT Analysis
- 12.1.10 CMS IT Services Pvt. Ltd.
- 12.1.10.1. Company Overview
- 12.1.10.2. Products
- 12.1.10.3. Company Financials
- 12.1.10.4. SWOT Analysis
- 12.1.11 Itransition
- 12.1.11.1. Company Overview
- 12.1.11.2. Products
- 12.1.11.3. Company Financials
- 12.1.11.4. SWOT Analysis
- 12.1.12 KaryaTech
- 12.1.12.1. Company Overview
- 12.1.12.2. Products
- 12.1.12.3. Company Financials
- 12.1.12.4. SWOT Analysis
- 12.1.13 Mazenet
- 12.1.13.1. Company Overview
- 12.1.13.2. Products
- 12.1.13.3. Company Financials
- 12.1.13.4. SWOT Analysis
- 12.1.14 NE Digital
- 12.1.14.1. Company Overview
- 12.1.14.2. Products
- 12.1.14.3. Company Financials
- 12.1.14.4. SWOT Analysis
- 12.1.15 TenFour
- 12.1.15.1. Company Overview
- 12.1.15.2. Products
- 12.1.15.3. Company Financials
- 12.1.15.4. SWOT Analysis
- 12.1.16 Verizon Enterprise
- 12.1.16.1. Company Overview
- 12.1.16.2. Products
- 12.1.16.3. Company Financials
- 12.1.16.4. SWOT Analysis
- 12.1.1 IBM
- 12.2. Market Entropy
- 12.2.1 Company's Key Areas Served
- 12.2.2 Recent Developments
- 12.3. Company Market Share Analysis 2025
- 12.3.1 Top 5 Companies Market Share Analysis
- 12.3.2 Top 3 Companies Market Share Analysis
- 12.4. List of Potential Customers
- 13. Research Methodology
List of Figures
- Figure 1: Global It Infrastructure Utility Service Revenue Breakdown (million, %) by Region 2025 & 2033
- Figure 2: North America It Infrastructure Utility Service Revenue (million), by Application 2025 & 2033
- Figure 3: North America It Infrastructure Utility Service Revenue Share (%), by Application 2025 & 2033
- Figure 4: North America It Infrastructure Utility Service Revenue (million), by Type 2025 & 2033
- Figure 5: North America It Infrastructure Utility Service Revenue Share (%), by Type 2025 & 2033
- Figure 6: North America It Infrastructure Utility Service Revenue (million), by Country 2025 & 2033
- Figure 7: North America It Infrastructure Utility Service Revenue Share (%), by Country 2025 & 2033
- Figure 8: South America It Infrastructure Utility Service Revenue (million), by Application 2025 & 2033
- Figure 9: South America It Infrastructure Utility Service Revenue Share (%), by Application 2025 & 2033
- Figure 10: South America It Infrastructure Utility Service Revenue (million), by Type 2025 & 2033
- Figure 11: South America It Infrastructure Utility Service Revenue Share (%), by Type 2025 & 2033
- Figure 12: South America It Infrastructure Utility Service Revenue (million), by Country 2025 & 2033
- Figure 13: South America It Infrastructure Utility Service Revenue Share (%), by Country 2025 & 2033
- Figure 14: Europe It Infrastructure Utility Service Revenue (million), by Application 2025 & 2033
- Figure 15: Europe It Infrastructure Utility Service Revenue Share (%), by Application 2025 & 2033
- Figure 16: Europe It Infrastructure Utility Service Revenue (million), by Type 2025 & 2033
- Figure 17: Europe It Infrastructure Utility Service Revenue Share (%), by Type 2025 & 2033
- Figure 18: Europe It Infrastructure Utility Service Revenue (million), by Country 2025 & 2033
- Figure 19: Europe It Infrastructure Utility Service Revenue Share (%), by Country 2025 & 2033
- Figure 20: Middle East & Africa It Infrastructure Utility Service Revenue (million), by Application 2025 & 2033
- Figure 21: Middle East & Africa It Infrastructure Utility Service Revenue Share (%), by Application 2025 & 2033
- Figure 22: Middle East & Africa It Infrastructure Utility Service Revenue (million), by Type 2025 & 2033
- Figure 23: Middle East & Africa It Infrastructure Utility Service Revenue Share (%), by Type 2025 & 2033
- Figure 24: Middle East & Africa It Infrastructure Utility Service Revenue (million), by Country 2025 & 2033
- Figure 25: Middle East & Africa It Infrastructure Utility Service Revenue Share (%), by Country 2025 & 2033
- Figure 26: Asia Pacific It Infrastructure Utility Service Revenue (million), by Application 2025 & 2033
- Figure 27: Asia Pacific It Infrastructure Utility Service Revenue Share (%), by Application 2025 & 2033
- Figure 28: Asia Pacific It Infrastructure Utility Service Revenue (million), by Type 2025 & 2033
- Figure 29: Asia Pacific It Infrastructure Utility Service Revenue Share (%), by Type 2025 & 2033
- Figure 30: Asia Pacific It Infrastructure Utility Service Revenue (million), by Country 2025 & 2033
- Figure 31: Asia Pacific It Infrastructure Utility Service Revenue Share (%), by Country 2025 & 2033
List of Tables
- Table 1: Global It Infrastructure Utility Service Revenue million Forecast, by Application 2020 & 2033
- Table 2: Global It Infrastructure Utility Service Revenue million Forecast, by Type 2020 & 2033
- Table 3: Global It Infrastructure Utility Service Revenue million Forecast, by Region 2020 & 2033
- Table 4: Global It Infrastructure Utility Service Revenue million Forecast, by Application 2020 & 2033
- Table 5: Global It Infrastructure Utility Service Revenue million Forecast, by Type 2020 & 2033
- Table 6: Global It Infrastructure Utility Service Revenue million Forecast, by Country 2020 & 2033
- Table 7: United States It Infrastructure Utility Service Revenue (million) Forecast, by Application 2020 & 2033
- Table 8: Canada It Infrastructure Utility Service Revenue (million) Forecast, by Application 2020 & 2033
- Table 9: Mexico It Infrastructure Utility Service Revenue (million) Forecast, by Application 2020 & 2033
- Table 10: Global It Infrastructure Utility Service Revenue million Forecast, by Application 2020 & 2033
- Table 11: Global It Infrastructure Utility Service Revenue million Forecast, by Type 2020 & 2033
- Table 12: Global It Infrastructure Utility Service Revenue million Forecast, by Country 2020 & 2033
- Table 13: Brazil It Infrastructure Utility Service Revenue (million) Forecast, by Application 2020 & 2033
- Table 14: Argentina It Infrastructure Utility Service Revenue (million) Forecast, by Application 2020 & 2033
- Table 15: Rest of South America It Infrastructure Utility Service Revenue (million) Forecast, by Application 2020 & 2033
- Table 16: Global It Infrastructure Utility Service Revenue million Forecast, by Application 2020 & 2033
- Table 17: Global It Infrastructure Utility Service Revenue million Forecast, by Type 2020 & 2033
- Table 18: Global It Infrastructure Utility Service Revenue million Forecast, by Country 2020 & 2033
- Table 19: United Kingdom It Infrastructure Utility Service Revenue (million) Forecast, by Application 2020 & 2033
- Table 20: Germany It Infrastructure Utility Service Revenue (million) Forecast, by Application 2020 & 2033
- Table 21: France It Infrastructure Utility Service Revenue (million) Forecast, by Application 2020 & 2033
- Table 22: Italy It Infrastructure Utility Service Revenue (million) Forecast, by Application 2020 & 2033
- Table 23: Spain It Infrastructure Utility Service Revenue (million) Forecast, by Application 2020 & 2033
- Table 24: Russia It Infrastructure Utility Service Revenue (million) Forecast, by Application 2020 & 2033
- Table 25: Benelux It Infrastructure Utility Service Revenue (million) Forecast, by Application 2020 & 2033
- Table 26: Nordics It Infrastructure Utility Service Revenue (million) Forecast, by Application 2020 & 2033
- Table 27: Rest of Europe It Infrastructure Utility Service Revenue (million) Forecast, by Application 2020 & 2033
- Table 28: Global It Infrastructure Utility Service Revenue million Forecast, by Application 2020 & 2033
- Table 29: Global It Infrastructure Utility Service Revenue million Forecast, by Type 2020 & 2033
- Table 30: Global It Infrastructure Utility Service Revenue million Forecast, by Country 2020 & 2033
- Table 31: Turkey It Infrastructure Utility Service Revenue (million) Forecast, by Application 2020 & 2033
- Table 32: Israel It Infrastructure Utility Service Revenue (million) Forecast, by Application 2020 & 2033
- Table 33: GCC It Infrastructure Utility Service Revenue (million) Forecast, by Application 2020 & 2033
- Table 34: North Africa It Infrastructure Utility Service Revenue (million) Forecast, by Application 2020 & 2033
- Table 35: South Africa It Infrastructure Utility Service Revenue (million) Forecast, by Application 2020 & 2033
- Table 36: Rest of Middle East & Africa It Infrastructure Utility Service Revenue (million) Forecast, by Application 2020 & 2033
- Table 37: Global It Infrastructure Utility Service Revenue million Forecast, by Application 2020 & 2033
- Table 38: Global It Infrastructure Utility Service Revenue million Forecast, by Type 2020 & 2033
- Table 39: Global It Infrastructure Utility Service Revenue million Forecast, by Country 2020 & 2033
- Table 40: China It Infrastructure Utility Service Revenue (million) Forecast, by Application 2020 & 2033
- Table 41: India It Infrastructure Utility Service Revenue (million) Forecast, by Application 2020 & 2033
- Table 42: Japan It Infrastructure Utility Service Revenue (million) Forecast, by Application 2020 & 2033
- Table 43: South Korea It Infrastructure Utility Service Revenue (million) Forecast, by Application 2020 & 2033
- Table 44: ASEAN It Infrastructure Utility Service Revenue (million) Forecast, by Application 2020 & 2033
- Table 45: Oceania It Infrastructure Utility Service Revenue (million) Forecast, by Application 2020 & 2033
- Table 46: Rest of Asia Pacific It Infrastructure Utility Service Revenue (million) Forecast, by Application 2020 & 2033
Frequently Asked Questions
1. What is the projected Compound Annual Growth Rate (CAGR) of the It Infrastructure Utility Service?
The projected CAGR is approximately 14.3%.
2. Which companies are prominent players in the It Infrastructure Utility Service?
Key companies in the market include IBM, Accenture, Asseco Poland, Atos, CapGemini, CenturyLink, Cognizant, Fidel Technologies, Fujitsu, CMS IT Services Pvt. Ltd., Itransition, KaryaTech, Mazenet, NE Digital, TenFour, Verizon Enterprise.
3. What are the main segments of the It Infrastructure Utility Service?
The market segments include Application, Type.
4. Can you provide details about the market size?
The market size is estimated to be USD 1656 million as of 2022.
5. What are some drivers contributing to market growth?
N/A
6. What are the notable trends driving market growth?
N/A
7. Are there any restraints impacting market growth?
N/A
8. Can you provide examples of recent developments in the market?
N/A
9. What pricing options are available for accessing the report?
Pricing options include single-user, multi-user, and enterprise licenses priced at USD 3950.00, USD 5925.00, and USD 7900.00 respectively.
10. Is the market size provided in terms of value or volume?
The market size is provided in terms of value, measured in million.
11. Are there any specific market keywords associated with the report?
Yes, the market keyword associated with the report is "It Infrastructure Utility Service," which aids in identifying and referencing the specific market segment covered.
12. How do I determine which pricing option suits my needs best?
The pricing options vary based on user requirements and access needs. Individual users may opt for single-user licenses, while businesses requiring broader access may choose multi-user or enterprise licenses for cost-effective access to the report.
13. Are there any additional resources or data provided in the It Infrastructure Utility Service report?
While the report offers comprehensive insights, it's advisable to review the specific contents or supplementary materials provided to ascertain if additional resources or data are available.
14. How can I stay updated on further developments or reports in the It Infrastructure Utility Service?
To stay informed about further developments, trends, and reports in the It Infrastructure Utility Service, consider subscribing to industry newsletters, following relevant companies and organizations, or regularly checking reputable industry news sources and publications.
Methodology
Step 1 - Identification of Relevant Samples Size from Population Database


Step 2 - Approaches for Defining Global Market Size (Value, Volume* & Price*)

Note*: In applicable scenarios
Step 3 - Data Sources
Primary Research
- Web Analytics
- Survey Reports
- Research Institute
- Latest Research Reports
- Opinion Leaders
Secondary Research
- Annual Reports
- White Paper
- Latest Press Release
- Industry Association
- Paid Database
- Investor Presentations

Step 4 - Data Triangulation
Involves using different sources of information in order to increase the validity of a study
These sources are likely to be stakeholders in a program - participants, other researchers, program staff, other community members, and so on.
Then we put all data in single framework & apply various statistical tools to find out the dynamic on the market.
During the analysis stage, feedback from the stakeholder groups would be compared to determine areas of agreement as well as areas of divergence