

Key Insights
The global IT spending in aviation market is poised for significant expansion, projected to reach USD 48.47 billion by 2024, with an impressive Compound Annual Growth Rate (CAGR) of 7.7% anticipated over the forecast period of 2025-2033. This robust growth is fundamentally driven by the imperative to enhance operational efficiency, bolster passenger experience, and ensure stringent safety and security protocols within the aviation industry. Key enablers include the increasing adoption of cloud computing for data management and analytics, the deployment of AI and machine learning for predictive maintenance and route optimization, and the rise of big data analytics to glean actionable insights from vast datasets. The demand for advanced software solutions, particularly in areas like airline systems and air traffic management, is a major catalyst, enabling airlines and airports to streamline operations, reduce costs, and improve decision-making. Furthermore, the continuous evolution of hardware infrastructure to support these digital transformations, alongside specialized services for implementation and support, further fuels market expansion.

It Spending In Aviation Market Size (In Billion)
The aviation sector is navigating a dynamic landscape characterized by both opportunities and challenges. While technological advancements present significant growth avenues, the market also confronts restraints such as the high cost of IT infrastructure implementation, cybersecurity threats demanding constant vigilance, and the complex regulatory environment governing aviation. Despite these hurdles, the industry is actively segmenting its IT investments across critical applications like aircraft operations, airline systems, and air traffic management. The type of IT spending is predominantly leaning towards software and services, reflecting the growing reliance on sophisticated digital tools and expert support to manage complex aviation ecosystems. Geographically, North America and Europe are leading the market, owing to their established aviation infrastructure and early adoption of advanced technologies. However, the Asia Pacific region is emerging as a high-growth market, driven by the rapid expansion of air travel and increasing investments in modernization initiatives. Companies like Amadeus IT Group, Rockwell Collins, and SITA are at the forefront, driving innovation and shaping the future of IT spending in aviation.

It Spending In Aviation Company Market Share
IT Spending in Aviation Market: Navigating Digital Transformation and Future Growth
This comprehensive report delves into the dynamic IT spending landscape within the aviation industry, offering in-depth analysis and strategic insights. Covering a study period from 2019 to 2033, with a base and estimated year of 2025, and a forecast period of 2025-2033, this report provides crucial data for stakeholders. We examine historical trends from 2019-2024 and project future market trajectories, focusing on critical segments like Aircraft, Airline Systems, and Air Traffic Management, across Hardware, Software, and Services types. This report is your essential guide to understanding market concentration, innovation drivers, regulatory impacts, M&A activity, and emerging opportunities in the aviation IT sector.
IT Spending in Aviation Market Structure & Competitive Landscape
The IT spending in aviation market exhibits a moderate to high level of concentration, driven by the significant capital investment required for advanced technological solutions and the presence of established global players. Innovation in areas such as Artificial Intelligence (AI), Machine Learning (ML) for predictive maintenance, Big Data analytics for operational efficiency, and cloud computing for scalable infrastructure are key drivers. Regulatory impacts, including evolving air traffic control mandates and data privacy laws, are shaping investment priorities. While direct product substitutes for core aviation IT systems are limited, advancements in competing technologies that enhance efficiency, such as drone integration for cargo, present indirect competitive pressures. End-user segmentation highlights the diverse needs of airlines, airports, and air traffic management authorities, each with unique IT requirements. Mergers and Acquisitions (M&A) trends are evident, with companies seeking to consolidate market share, acquire new technologies, and expand their service offerings. For instance, the last five years have seen approximately $5 billion in M&A volumes, consolidating key technology providers and expanding service portfolios. Concentration ratios in specific segments, such as air traffic management software, indicate that the top three players hold over 60% of the market share.
IT Spending in Aviation Market Trends & Opportunities
The global IT spending in aviation market is poised for robust expansion, projected to grow at a Compound Annual Growth Rate (CAGR) of approximately 7.5% during the forecast period. This significant market size growth is fueled by the imperative for enhanced operational efficiency, improved passenger experience, and stringent safety and security regulations. The market is projected to reach over $150 billion by 2033. Technological shifts are profoundly impacting the sector, with a considerable increase in investment in AI-powered solutions for predictive maintenance, route optimization, and passenger flow management. The adoption of cloud-based platforms is accelerating, enabling airlines and airports to achieve greater scalability, flexibility, and cost-effectiveness in their IT operations. Consumer preferences are increasingly leaning towards seamless digital experiences, from booking and check-in to in-flight connectivity and personalized services, driving demand for advanced airline systems and mobile applications. Competitive dynamics are intensifying, with established IT giants vying for market dominance alongside agile technology startups offering specialized solutions. Market penetration rates for advanced analytics and cybersecurity solutions are rapidly increasing, reflecting the industry's commitment to digital transformation. Furthermore, the ongoing development and deployment of NextGen and SESAR initiatives in air traffic management are creating substantial opportunities for IT providers specializing in these complex systems. The growing emphasis on sustainability and the need to reduce carbon footprints are also driving investments in IT solutions that optimize flight paths and improve fuel efficiency.
Dominant Markets & Segments in IT Spending in Aviation
The Software segment is projected to dominate IT spending in aviation, driven by the critical need for advanced applications across all operational domains. Within this segment, Airline Systems are expected to command the largest share, accounting for an estimated 45% of total software spending. Key growth drivers for Airline Systems include the continuous development of passenger service systems (PSS), revenue management solutions, and customer relationship management (CRM) platforms. The increasing demand for personalized passenger experiences, loyalty programs, and seamless booking processes necessitates ongoing investment in sophisticated airline software.
Air Traffic Management (ATM) represents another significant segment, driven by global initiatives to modernize air traffic control infrastructure. Investments in ATM software are crucial for enhancing airspace capacity, improving safety, and reducing delays. The implementation of advanced surveillance technologies, communication systems, and decision support tools, often powered by AI and data analytics, are key growth drivers in this area. The push towards a Single European Sky and similar initiatives worldwide underscore the importance of standardized and interoperable ATM systems.
The Aircraft segment, while focused on hardware, also sees substantial IT spending, particularly in areas such as avionics, in-flight entertainment systems, and connectivity solutions. The ongoing integration of advanced sensors, IoT devices, and real-time data transmission capabilities within aircraft is a significant trend.
Regionally, North America and Europe are anticipated to lead IT spending in aviation, owing to the maturity of their aviation infrastructure, stringent regulatory frameworks, and the presence of major airlines and aerospace manufacturers. Asia-Pacific is emerging as a high-growth region, fueled by rapid expansion in air travel and significant investments in airport modernization and airline fleet upgrades.
IT Spending in Aviation Product Analysis
The aviation IT market is characterized by a surge in innovative products focused on enhancing operational efficiency, passenger experience, and safety. These include AI-powered predictive maintenance solutions that minimize aircraft downtime, advanced data analytics platforms for real-time operational insights, and next-generation cybersecurity tools to protect sensitive data. Cloud-based software suites are offering airlines and airports greater agility and scalability, while sophisticated in-flight connectivity and entertainment systems are transforming the passenger journey. Competitive advantages are derived from robust data integration capabilities, seamless interoperability with legacy systems, and adherence to stringent aviation industry standards.
Key Drivers, Barriers & Challenges in IT Spending in Aviation
Key Drivers:
- Digital Transformation Imperative: The need for enhanced operational efficiency, cost reduction, and improved passenger experience is driving significant IT investment.
- Technological Advancements: AI, ML, Big Data analytics, cloud computing, and IoT are enabling groundbreaking solutions.
- Regulatory Compliance & Safety Standards: Evolving regulations and the paramount importance of safety necessitate continuous IT upgrades, particularly in Air Traffic Management.
- Growing Air Traffic Demand: Increased passenger and cargo volumes require more sophisticated and scalable IT infrastructure.
Barriers & Challenges:
- High Implementation Costs: The substantial investment required for new IT systems can be a significant hurdle, especially for smaller operators.
- Legacy System Integration: Integrating new technologies with existing, often outdated, systems presents complex technical challenges.
- Cybersecurity Threats: The aviation sector is a prime target for cyberattacks, requiring continuous and substantial investment in robust security measures.
- Skilled Workforce Shortage: A lack of skilled IT professionals with aviation domain expertise can slow down adoption and implementation.
- Supply Chain Disruptions: Global supply chain issues can impact the availability and cost of hardware components, delaying projects.
Growth Drivers in the IT Spending in Aviation Market
The IT spending in the aviation market is propelled by a confluence of factors. Technological innovation remains a primary catalyst, with advancements in AI and machine learning enabling sophisticated predictive maintenance, optimizing flight operations, and personalizing passenger experiences. The relentless pursuit of operational efficiency by airlines and airports to reduce costs and improve turnaround times is a significant economic driver. Furthermore, evolving regulatory landscapes, particularly concerning air traffic management modernization and enhanced security protocols, mandate substantial IT investments. The growing demand for seamless digital passenger journeys, from booking to in-flight services, fuels spending on customer-facing software and connectivity solutions. The increasing adoption of cloud technologies provides a scalable and cost-effective platform for innovation.
Challenges Impacting IT Spending in Aviation Growth
Several challenges are impacting the growth trajectory of IT spending in the aviation sector. High upfront investment costs associated with cutting-edge technologies and infrastructure upgrades remain a significant restraint, particularly for smaller airlines and regional airports. Complexities in integrating new IT solutions with legacy systems can lead to project delays and increased implementation costs. The ever-present and evolving threat of cybersecurity breaches requires continuous and substantial resource allocation, diverting funds from other developmental areas. Additionally, regulatory hurdles and compliance requirements in different jurisdictions can create a fragmented market and slow down global deployment of standardized IT solutions. Finally, global supply chain disruptions can affect the timely procurement of essential hardware components, leading to project postponements.
Key Players Shaping the IT Spending in Aviation Market
- Amadeus IT Group
- Rockwell Collins
- SITA
- Ultra-Electronics Airport Systems
- AirIT
- Atos
- Capgemini
- Damarel Systems
- INFORM
- Lockheed Martin
- NEC
- Northrop Grumman
- PASSUR Aerospace
- RESA
- SAAB Sensis
- Siemens
- TravelSky Technology
Significant IT Spending in Aviation Industry Milestones
- 2019: Widespread adoption of AI for predictive maintenance in aircraft fleets, impacting hardware and software spending.
- 2020: Accelerated digital transformation initiatives driven by the global pandemic, with increased focus on contactless technologies and cloud-based solutions for airlines.
- 2021: Significant investments in cybersecurity solutions following high-profile data breaches in the aviation sector.
- 2022: Increased deployment of cloud infrastructure for air traffic management systems to enhance scalability and data processing capabilities.
- 2023: Growing demand for integrated passenger experience platforms, combining booking, check-in, and in-flight services.
- 2024: Emergence of advanced analytics for optimizing airline operations and fuel efficiency, impacting software services.
Future Outlook for IT Spending in Aviation Market
The future outlook for IT spending in the aviation market is exceptionally positive, driven by continued digital transformation and the integration of emerging technologies. Strategic opportunities lie in the further development of AI-driven operational intelligence, personalized passenger services, and advanced cybersecurity frameworks. The ongoing modernization of air traffic management systems worldwide presents a substantial growth catalyst. Investments in sustainable aviation solutions, leveraging IT for route optimization and carbon footprint reduction, will also gain prominence. Market potential remains high as the industry embraces a data-centric approach to enhance efficiency, safety, and customer satisfaction, solidifying IT as a critical enabler for future aviation success.
It Spending In Aviation Segmentation
-
1. Application
- 1.1. Aircraft
- 1.2. Airline System
- 1.3. Air Traffic Management
-
2. Type
- 2.1. Hardware
- 2.2. Software
- 2.3. Services
It Spending In Aviation Segmentation By Geography
-
1. North America
- 1.1. United States
- 1.2. Canada
- 1.3. Mexico
-
2. South America
- 2.1. Brazil
- 2.2. Argentina
- 2.3. Rest of South America
-
3. Europe
- 3.1. United Kingdom
- 3.2. Germany
- 3.3. France
- 3.4. Italy
- 3.5. Spain
- 3.6. Russia
- 3.7. Benelux
- 3.8. Nordics
- 3.9. Rest of Europe
-
4. Middle East & Africa
- 4.1. Turkey
- 4.2. Israel
- 4.3. GCC
- 4.4. North Africa
- 4.5. South Africa
- 4.6. Rest of Middle East & Africa
-
5. Asia Pacific
- 5.1. China
- 5.2. India
- 5.3. Japan
- 5.4. South Korea
- 5.5. ASEAN
- 5.6. Oceania
- 5.7. Rest of Asia Pacific
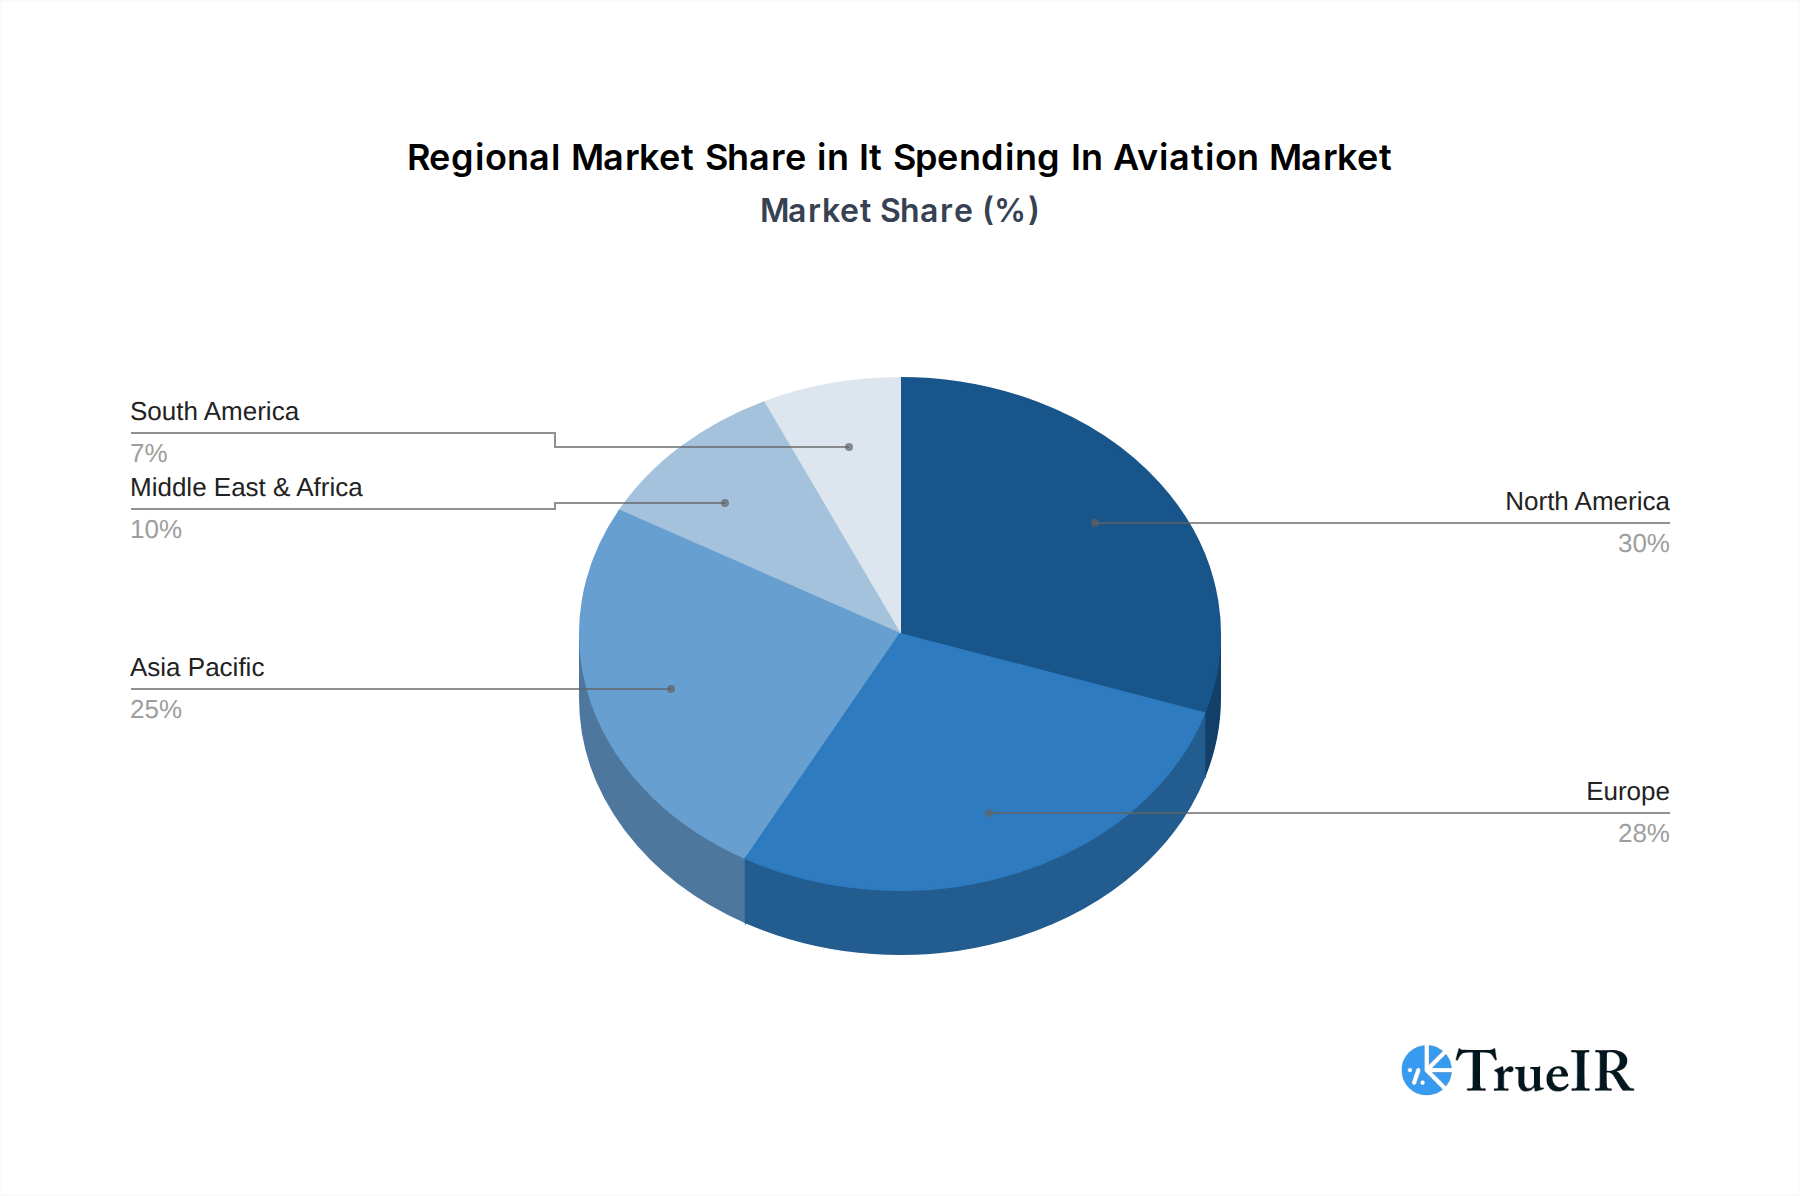
It Spending In Aviation Regional Market Share
Geographic Coverage of It Spending In Aviation
It Spending In Aviation REPORT HIGHLIGHTS
| Aspects | Details |
|---|---|
| Study Period | 2020-2034 |
| Base Year | 2025 |
| Estimated Year | 2026 |
| Forecast Period | 2026-2034 |
| Historical Period | 2020-2025 |
| Growth Rate | CAGR of 7.7% from 2020-2034 |
| Segmentation |
|
Table of Contents
- 1. Introduction
- 1.1. Research Scope
- 1.2. Market Segmentation
- 1.3. Research Methodology
- 1.4. Definitions and Assumptions
- 2. Executive Summary
- 2.1. Introduction
- 3. Market Dynamics
- 3.1. Introduction
- 3.2. Market Drivers
- 3.3. Market Restrains
- 3.4. Market Trends
- 4. Market Factor Analysis
- 4.1. Porters Five Forces
- 4.2. Supply/Value Chain
- 4.3. PESTEL analysis
- 4.4. Market Entropy
- 4.5. Patent/Trademark Analysis
- 5. Global It Spending In Aviation Analysis, Insights and Forecast, 2020-2032
- 5.1. Market Analysis, Insights and Forecast - by Application
- 5.1.1. Aircraft
- 5.1.2. Airline System
- 5.1.3. Air Traffic Management
- 5.2. Market Analysis, Insights and Forecast - by Type
- 5.2.1. Hardware
- 5.2.2. Software
- 5.2.3. Services
- 5.3. Market Analysis, Insights and Forecast - by Region
- 5.3.1. North America
- 5.3.2. South America
- 5.3.3. Europe
- 5.3.4. Middle East & Africa
- 5.3.5. Asia Pacific
- 5.1. Market Analysis, Insights and Forecast - by Application
- 6. North America It Spending In Aviation Analysis, Insights and Forecast, 2020-2032
- 6.1. Market Analysis, Insights and Forecast - by Application
- 6.1.1. Aircraft
- 6.1.2. Airline System
- 6.1.3. Air Traffic Management
- 6.2. Market Analysis, Insights and Forecast - by Type
- 6.2.1. Hardware
- 6.2.2. Software
- 6.2.3. Services
- 6.1. Market Analysis, Insights and Forecast - by Application
- 7. South America It Spending In Aviation Analysis, Insights and Forecast, 2020-2032
- 7.1. Market Analysis, Insights and Forecast - by Application
- 7.1.1. Aircraft
- 7.1.2. Airline System
- 7.1.3. Air Traffic Management
- 7.2. Market Analysis, Insights and Forecast - by Type
- 7.2.1. Hardware
- 7.2.2. Software
- 7.2.3. Services
- 7.1. Market Analysis, Insights and Forecast - by Application
- 8. Europe It Spending In Aviation Analysis, Insights and Forecast, 2020-2032
- 8.1. Market Analysis, Insights and Forecast - by Application
- 8.1.1. Aircraft
- 8.1.2. Airline System
- 8.1.3. Air Traffic Management
- 8.2. Market Analysis, Insights and Forecast - by Type
- 8.2.1. Hardware
- 8.2.2. Software
- 8.2.3. Services
- 8.1. Market Analysis, Insights and Forecast - by Application
- 9. Middle East & Africa It Spending In Aviation Analysis, Insights and Forecast, 2020-2032
- 9.1. Market Analysis, Insights and Forecast - by Application
- 9.1.1. Aircraft
- 9.1.2. Airline System
- 9.1.3. Air Traffic Management
- 9.2. Market Analysis, Insights and Forecast - by Type
- 9.2.1. Hardware
- 9.2.2. Software
- 9.2.3. Services
- 9.1. Market Analysis, Insights and Forecast - by Application
- 10. Asia Pacific It Spending In Aviation Analysis, Insights and Forecast, 2020-2032
- 10.1. Market Analysis, Insights and Forecast - by Application
- 10.1.1. Aircraft
- 10.1.2. Airline System
- 10.1.3. Air Traffic Management
- 10.2. Market Analysis, Insights and Forecast - by Type
- 10.2.1. Hardware
- 10.2.2. Software
- 10.2.3. Services
- 10.1. Market Analysis, Insights and Forecast - by Application
- 11. Competitive Analysis
- 11.1. Global Market Share Analysis 2025
- 11.2. Company Profiles
- 11.2.1 Amadeus IT Group
- 11.2.1.1. Overview
- 11.2.1.2. Products
- 11.2.1.3. SWOT Analysis
- 11.2.1.4. Recent Developments
- 11.2.1.5. Financials (Based on Availability)
- 11.2.2 Rockwell Collins
- 11.2.2.1. Overview
- 11.2.2.2. Products
- 11.2.2.3. SWOT Analysis
- 11.2.2.4. Recent Developments
- 11.2.2.5. Financials (Based on Availability)
- 11.2.3 SITA
- 11.2.3.1. Overview
- 11.2.3.2. Products
- 11.2.3.3. SWOT Analysis
- 11.2.3.4. Recent Developments
- 11.2.3.5. Financials (Based on Availability)
- 11.2.4 Ultra-Electronics Airport Systems
- 11.2.4.1. Overview
- 11.2.4.2. Products
- 11.2.4.3. SWOT Analysis
- 11.2.4.4. Recent Developments
- 11.2.4.5. Financials (Based on Availability)
- 11.2.5 AirIT
- 11.2.5.1. Overview
- 11.2.5.2. Products
- 11.2.5.3. SWOT Analysis
- 11.2.5.4. Recent Developments
- 11.2.5.5. Financials (Based on Availability)
- 11.2.6 Atos
- 11.2.6.1. Overview
- 11.2.6.2. Products
- 11.2.6.3. SWOT Analysis
- 11.2.6.4. Recent Developments
- 11.2.6.5. Financials (Based on Availability)
- 11.2.7 Capgemini
- 11.2.7.1. Overview
- 11.2.7.2. Products
- 11.2.7.3. SWOT Analysis
- 11.2.7.4. Recent Developments
- 11.2.7.5. Financials (Based on Availability)
- 11.2.8 Damarel Systems
- 11.2.8.1. Overview
- 11.2.8.2. Products
- 11.2.8.3. SWOT Analysis
- 11.2.8.4. Recent Developments
- 11.2.8.5. Financials (Based on Availability)
- 11.2.9 INFORM
- 11.2.9.1. Overview
- 11.2.9.2. Products
- 11.2.9.3. SWOT Analysis
- 11.2.9.4. Recent Developments
- 11.2.9.5. Financials (Based on Availability)
- 11.2.10 Lockheed Martin
- 11.2.10.1. Overview
- 11.2.10.2. Products
- 11.2.10.3. SWOT Analysis
- 11.2.10.4. Recent Developments
- 11.2.10.5. Financials (Based on Availability)
- 11.2.11 NEC
- 11.2.11.1. Overview
- 11.2.11.2. Products
- 11.2.11.3. SWOT Analysis
- 11.2.11.4. Recent Developments
- 11.2.11.5. Financials (Based on Availability)
- 11.2.12 Northrop Grumman
- 11.2.12.1. Overview
- 11.2.12.2. Products
- 11.2.12.3. SWOT Analysis
- 11.2.12.4. Recent Developments
- 11.2.12.5. Financials (Based on Availability)
- 11.2.13 PASSUR Aerospace
- 11.2.13.1. Overview
- 11.2.13.2. Products
- 11.2.13.3. SWOT Analysis
- 11.2.13.4. Recent Developments
- 11.2.13.5. Financials (Based on Availability)
- 11.2.14 RESA
- 11.2.14.1. Overview
- 11.2.14.2. Products
- 11.2.14.3. SWOT Analysis
- 11.2.14.4. Recent Developments
- 11.2.14.5. Financials (Based on Availability)
- 11.2.15 SAAB Sensis
- 11.2.15.1. Overview
- 11.2.15.2. Products
- 11.2.15.3. SWOT Analysis
- 11.2.15.4. Recent Developments
- 11.2.15.5. Financials (Based on Availability)
- 11.2.16 Siemens
- 11.2.16.1. Overview
- 11.2.16.2. Products
- 11.2.16.3. SWOT Analysis
- 11.2.16.4. Recent Developments
- 11.2.16.5. Financials (Based on Availability)
- 11.2.17 TravelSky Technology
- 11.2.17.1. Overview
- 11.2.17.2. Products
- 11.2.17.3. SWOT Analysis
- 11.2.17.4. Recent Developments
- 11.2.17.5. Financials (Based on Availability)
- 11.2.1 Amadeus IT Group
List of Figures
- Figure 1: Global It Spending In Aviation Revenue Breakdown (undefined, %) by Region 2025 & 2033
- Figure 2: North America It Spending In Aviation Revenue (undefined), by Application 2025 & 2033
- Figure 3: North America It Spending In Aviation Revenue Share (%), by Application 2025 & 2033
- Figure 4: North America It Spending In Aviation Revenue (undefined), by Type 2025 & 2033
- Figure 5: North America It Spending In Aviation Revenue Share (%), by Type 2025 & 2033
- Figure 6: North America It Spending In Aviation Revenue (undefined), by Country 2025 & 2033
- Figure 7: North America It Spending In Aviation Revenue Share (%), by Country 2025 & 2033
- Figure 8: South America It Spending In Aviation Revenue (undefined), by Application 2025 & 2033
- Figure 9: South America It Spending In Aviation Revenue Share (%), by Application 2025 & 2033
- Figure 10: South America It Spending In Aviation Revenue (undefined), by Type 2025 & 2033
- Figure 11: South America It Spending In Aviation Revenue Share (%), by Type 2025 & 2033
- Figure 12: South America It Spending In Aviation Revenue (undefined), by Country 2025 & 2033
- Figure 13: South America It Spending In Aviation Revenue Share (%), by Country 2025 & 2033
- Figure 14: Europe It Spending In Aviation Revenue (undefined), by Application 2025 & 2033
- Figure 15: Europe It Spending In Aviation Revenue Share (%), by Application 2025 & 2033
- Figure 16: Europe It Spending In Aviation Revenue (undefined), by Type 2025 & 2033
- Figure 17: Europe It Spending In Aviation Revenue Share (%), by Type 2025 & 2033
- Figure 18: Europe It Spending In Aviation Revenue (undefined), by Country 2025 & 2033
- Figure 19: Europe It Spending In Aviation Revenue Share (%), by Country 2025 & 2033
- Figure 20: Middle East & Africa It Spending In Aviation Revenue (undefined), by Application 2025 & 2033
- Figure 21: Middle East & Africa It Spending In Aviation Revenue Share (%), by Application 2025 & 2033
- Figure 22: Middle East & Africa It Spending In Aviation Revenue (undefined), by Type 2025 & 2033
- Figure 23: Middle East & Africa It Spending In Aviation Revenue Share (%), by Type 2025 & 2033
- Figure 24: Middle East & Africa It Spending In Aviation Revenue (undefined), by Country 2025 & 2033
- Figure 25: Middle East & Africa It Spending In Aviation Revenue Share (%), by Country 2025 & 2033
- Figure 26: Asia Pacific It Spending In Aviation Revenue (undefined), by Application 2025 & 2033
- Figure 27: Asia Pacific It Spending In Aviation Revenue Share (%), by Application 2025 & 2033
- Figure 28: Asia Pacific It Spending In Aviation Revenue (undefined), by Type 2025 & 2033
- Figure 29: Asia Pacific It Spending In Aviation Revenue Share (%), by Type 2025 & 2033
- Figure 30: Asia Pacific It Spending In Aviation Revenue (undefined), by Country 2025 & 2033
- Figure 31: Asia Pacific It Spending In Aviation Revenue Share (%), by Country 2025 & 2033
List of Tables
- Table 1: Global It Spending In Aviation Revenue undefined Forecast, by Application 2020 & 2033
- Table 2: Global It Spending In Aviation Revenue undefined Forecast, by Type 2020 & 2033
- Table 3: Global It Spending In Aviation Revenue undefined Forecast, by Region 2020 & 2033
- Table 4: Global It Spending In Aviation Revenue undefined Forecast, by Application 2020 & 2033
- Table 5: Global It Spending In Aviation Revenue undefined Forecast, by Type 2020 & 2033
- Table 6: Global It Spending In Aviation Revenue undefined Forecast, by Country 2020 & 2033
- Table 7: United States It Spending In Aviation Revenue (undefined) Forecast, by Application 2020 & 2033
- Table 8: Canada It Spending In Aviation Revenue (undefined) Forecast, by Application 2020 & 2033
- Table 9: Mexico It Spending In Aviation Revenue (undefined) Forecast, by Application 2020 & 2033
- Table 10: Global It Spending In Aviation Revenue undefined Forecast, by Application 2020 & 2033
- Table 11: Global It Spending In Aviation Revenue undefined Forecast, by Type 2020 & 2033
- Table 12: Global It Spending In Aviation Revenue undefined Forecast, by Country 2020 & 2033
- Table 13: Brazil It Spending In Aviation Revenue (undefined) Forecast, by Application 2020 & 2033
- Table 14: Argentina It Spending In Aviation Revenue (undefined) Forecast, by Application 2020 & 2033
- Table 15: Rest of South America It Spending In Aviation Revenue (undefined) Forecast, by Application 2020 & 2033
- Table 16: Global It Spending In Aviation Revenue undefined Forecast, by Application 2020 & 2033
- Table 17: Global It Spending In Aviation Revenue undefined Forecast, by Type 2020 & 2033
- Table 18: Global It Spending In Aviation Revenue undefined Forecast, by Country 2020 & 2033
- Table 19: United Kingdom It Spending In Aviation Revenue (undefined) Forecast, by Application 2020 & 2033
- Table 20: Germany It Spending In Aviation Revenue (undefined) Forecast, by Application 2020 & 2033
- Table 21: France It Spending In Aviation Revenue (undefined) Forecast, by Application 2020 & 2033
- Table 22: Italy It Spending In Aviation Revenue (undefined) Forecast, by Application 2020 & 2033
- Table 23: Spain It Spending In Aviation Revenue (undefined) Forecast, by Application 2020 & 2033
- Table 24: Russia It Spending In Aviation Revenue (undefined) Forecast, by Application 2020 & 2033
- Table 25: Benelux It Spending In Aviation Revenue (undefined) Forecast, by Application 2020 & 2033
- Table 26: Nordics It Spending In Aviation Revenue (undefined) Forecast, by Application 2020 & 2033
- Table 27: Rest of Europe It Spending In Aviation Revenue (undefined) Forecast, by Application 2020 & 2033
- Table 28: Global It Spending In Aviation Revenue undefined Forecast, by Application 2020 & 2033
- Table 29: Global It Spending In Aviation Revenue undefined Forecast, by Type 2020 & 2033
- Table 30: Global It Spending In Aviation Revenue undefined Forecast, by Country 2020 & 2033
- Table 31: Turkey It Spending In Aviation Revenue (undefined) Forecast, by Application 2020 & 2033
- Table 32: Israel It Spending In Aviation Revenue (undefined) Forecast, by Application 2020 & 2033
- Table 33: GCC It Spending In Aviation Revenue (undefined) Forecast, by Application 2020 & 2033
- Table 34: North Africa It Spending In Aviation Revenue (undefined) Forecast, by Application 2020 & 2033
- Table 35: South Africa It Spending In Aviation Revenue (undefined) Forecast, by Application 2020 & 2033
- Table 36: Rest of Middle East & Africa It Spending In Aviation Revenue (undefined) Forecast, by Application 2020 & 2033
- Table 37: Global It Spending In Aviation Revenue undefined Forecast, by Application 2020 & 2033
- Table 38: Global It Spending In Aviation Revenue undefined Forecast, by Type 2020 & 2033
- Table 39: Global It Spending In Aviation Revenue undefined Forecast, by Country 2020 & 2033
- Table 40: China It Spending In Aviation Revenue (undefined) Forecast, by Application 2020 & 2033
- Table 41: India It Spending In Aviation Revenue (undefined) Forecast, by Application 2020 & 2033
- Table 42: Japan It Spending In Aviation Revenue (undefined) Forecast, by Application 2020 & 2033
- Table 43: South Korea It Spending In Aviation Revenue (undefined) Forecast, by Application 2020 & 2033
- Table 44: ASEAN It Spending In Aviation Revenue (undefined) Forecast, by Application 2020 & 2033
- Table 45: Oceania It Spending In Aviation Revenue (undefined) Forecast, by Application 2020 & 2033
- Table 46: Rest of Asia Pacific It Spending In Aviation Revenue (undefined) Forecast, by Application 2020 & 2033
Frequently Asked Questions
1. What is the projected Compound Annual Growth Rate (CAGR) of the It Spending In Aviation?
The projected CAGR is approximately 7.7%.
2. Which companies are prominent players in the It Spending In Aviation?
Key companies in the market include Amadeus IT Group, Rockwell Collins, SITA, Ultra-Electronics Airport Systems, AirIT, Atos, Capgemini, Damarel Systems, INFORM, Lockheed Martin, NEC, Northrop Grumman, PASSUR Aerospace, RESA, SAAB Sensis, Siemens, TravelSky Technology.
3. What are the main segments of the It Spending In Aviation?
The market segments include Application, Type.
4. Can you provide details about the market size?
The market size is estimated to be USD XXX N/A as of 2022.
5. What are some drivers contributing to market growth?
N/A
6. What are the notable trends driving market growth?
N/A
7. Are there any restraints impacting market growth?
N/A
8. Can you provide examples of recent developments in the market?
N/A
9. What pricing options are available for accessing the report?
Pricing options include single-user, multi-user, and enterprise licenses priced at USD 3950.00, USD 5925.00, and USD 7900.00 respectively.
10. Is the market size provided in terms of value or volume?
The market size is provided in terms of value, measured in N/A.
11. Are there any specific market keywords associated with the report?
Yes, the market keyword associated with the report is "It Spending In Aviation," which aids in identifying and referencing the specific market segment covered.
12. How do I determine which pricing option suits my needs best?
The pricing options vary based on user requirements and access needs. Individual users may opt for single-user licenses, while businesses requiring broader access may choose multi-user or enterprise licenses for cost-effective access to the report.
13. Are there any additional resources or data provided in the It Spending In Aviation report?
While the report offers comprehensive insights, it's advisable to review the specific contents or supplementary materials provided to ascertain if additional resources or data are available.
14. How can I stay updated on further developments or reports in the It Spending In Aviation?
To stay informed about further developments, trends, and reports in the It Spending In Aviation, consider subscribing to industry newsletters, following relevant companies and organizations, or regularly checking reputable industry news sources and publications.
Methodology
Step 1 - Identification of Relevant Samples Size from Population Database


Step 2 - Approaches for Defining Global Market Size (Value, Volume* & Price*)

Note*: In applicable scenarios
Step 3 - Data Sources
Primary Research
- Web Analytics
- Survey Reports
- Research Institute
- Latest Research Reports
- Opinion Leaders
Secondary Research
- Annual Reports
- White Paper
- Latest Press Release
- Industry Association
- Paid Database
- Investor Presentations

Step 4 - Data Triangulation
Involves using different sources of information in order to increase the validity of a study
These sources are likely to be stakeholders in a program - participants, other researchers, program staff, other community members, and so on.
Then we put all data in single framework & apply various statistical tools to find out the dynamic on the market.
During the analysis stage, feedback from the stakeholder groups would be compared to determine areas of agreement as well as areas of divergence