

Key Insights
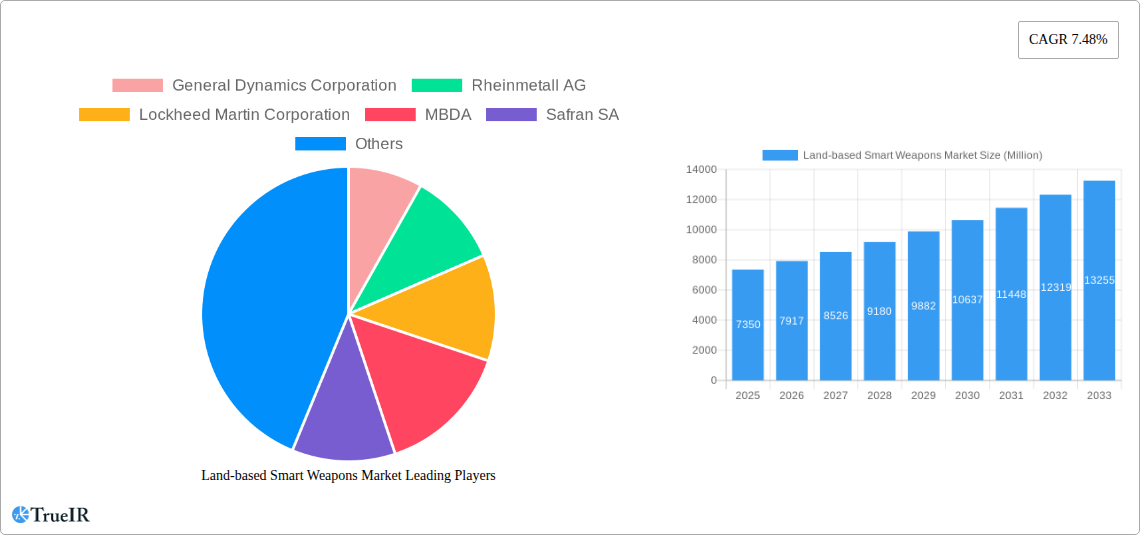
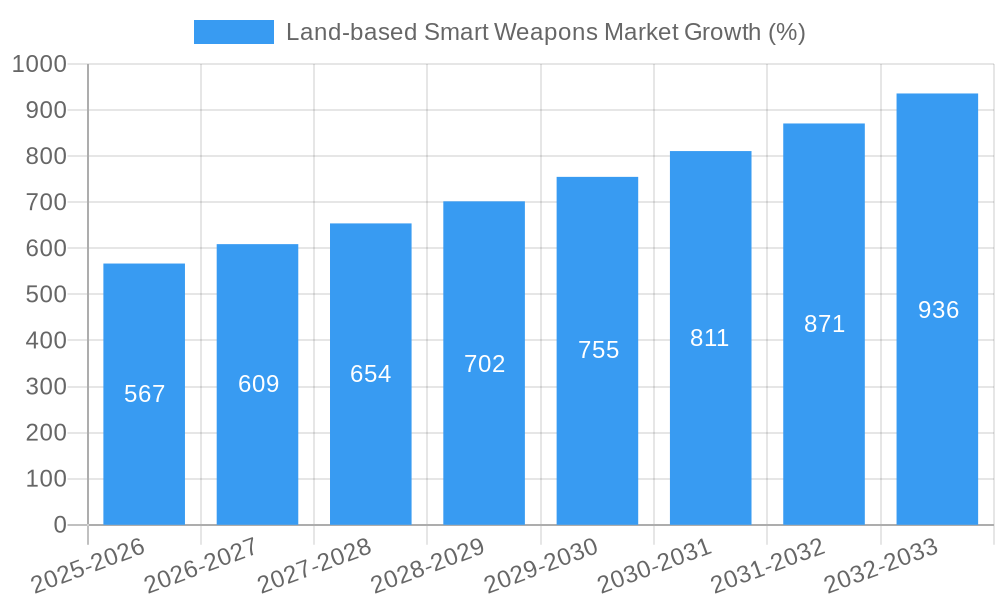
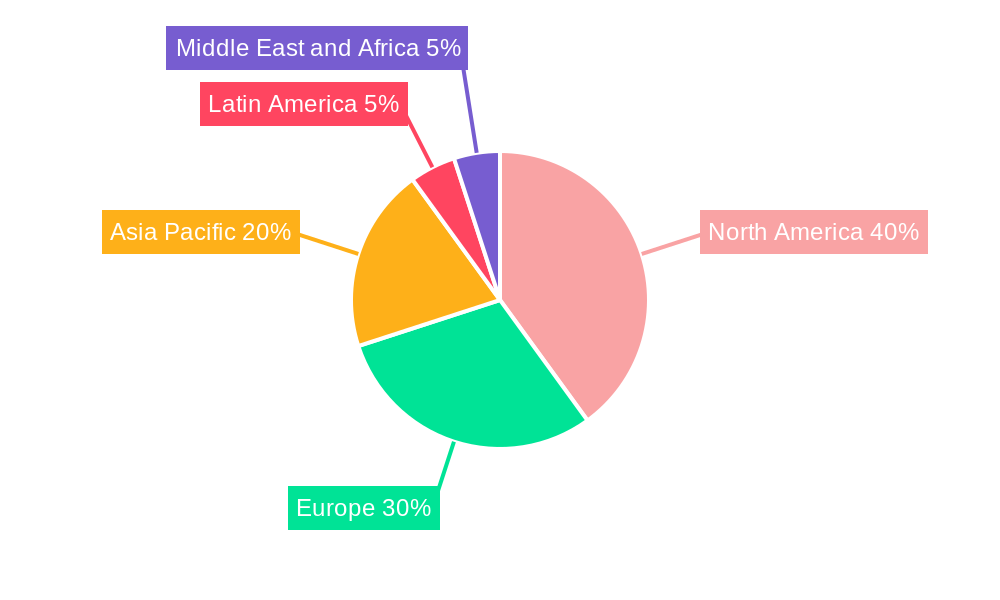
The land-based smart weapons market, valued at $7.35 billion in 2025, is projected to experience robust growth, driven by escalating geopolitical tensions, modernization of military arsenals, and the increasing demand for precision-guided munitions. The market's Compound Annual Growth Rate (CAGR) of 7.48% from 2025 to 2033 indicates a significant expansion, reaching an estimated market value exceeding $14 billion by 2033. Key growth drivers include advancements in guidance technologies like satellite, radar, infrared, and laser guidance systems, enhancing accuracy and minimizing collateral damage. The increasing adoption of sophisticated smart weapons by both developed and developing nations further fuels this expansion. Technological advancements, such as the integration of artificial intelligence and improved sensor capabilities, are expected to continue driving market growth. However, the high cost of development and procurement, coupled with stringent regulatory frameworks surrounding the production and export of these weapons, poses a significant restraint. The market is segmented by product type (missiles, ammunitions, and other products) and guidance technology, with missiles currently dominating due to their long-range capabilities and destructive power. Regionally, North America and Europe are anticipated to hold significant market share, driven by substantial defense budgets and technological advancements in these regions. However, the Asia-Pacific region is predicted to witness substantial growth, driven by increasing military spending from key players such as China and India.
The competitive landscape is dominated by major players like Lockheed Martin, General Dynamics, Raytheon Technologies (RTX), and BAE Systems, who invest heavily in research and development to maintain their market position. These companies actively engage in mergers, acquisitions, and strategic partnerships to expand their product portfolios and geographical reach. Future market growth will hinge on technological innovations, particularly in autonomous targeting systems and the integration of unmanned aerial vehicles (UAVs) for enhanced delivery precision. The potential for increased collaboration between governments and private sector companies in the development of smart weapons is also a key factor impacting long-term market prospects. Furthermore, the evolving geopolitical landscape and the increasing focus on asymmetric warfare will continue to shape the dynamics of this critical market.
Land-based Smart Weapons Market: A Comprehensive Market Report (2019-2033)
This in-depth report provides a comprehensive analysis of the Land-based Smart Weapons Market, offering invaluable insights for industry stakeholders, investors, and researchers. Covering the period from 2019 to 2033, with a focus on the 2025-2033 forecast period, this report delves into market size, segmentation, competitive dynamics, and future growth potential. The study utilizes a robust methodology, incorporating both qualitative and quantitative data, to paint a clear picture of this dynamic market. Keywords: Land-based Smart Weapons, Missiles, Ammunitions, Satellite Guidance, Radar Guidance, Infrared Guidance, Laser Guidance, General Dynamics, Rheinmetall, Lockheed Martin, MBDA, Safran, Rafael Advanced Defense Systems, RTX, BAE Systems, Northrop Grumman, Defense Market.
Land-based Smart Weapons Market Market Structure & Competitive Landscape
The Land-based Smart Weapons market exhibits a moderately concentrated structure, with a Herfindahl-Hirschman Index (HHI) estimated at xx in 2025. Key players, including General Dynamics Corporation, Rheinmetall AG, Lockheed Martin Corporation, MBDA, Safran SA, Rafael Advanced Defense Systems Ltd, RTX Corporation, BAE Systems PLC, and Northrop Grumman Corporation, hold significant market share, driving innovation and shaping competitive dynamics. The market is characterized by ongoing mergers and acquisitions (M&A) activity, with an estimated xx Million USD worth of deals concluded between 2019 and 2024. This consolidation reflects the strategic importance of technological advancement and global reach.
- Market Concentration: Moderately concentrated, with the top 5 players accounting for approximately xx% of the market share in 2025.
- Innovation Drivers: Continuous advancements in guidance technologies (e.g., AI-powered targeting), miniaturization, and increased lethality drive market innovation.
- Regulatory Impacts: Stringent export controls and international arms trade treaties significantly influence market growth and player strategies.
- Product Substitutes: The emergence of cyber warfare and other asymmetric warfare tactics presents limited substitutes.
- End-user Segmentation: The market is primarily driven by government defense agencies and militaries worldwide. Demand varies considerably based on geopolitical stability and regional conflicts.
- M&A Trends: Consolidation continues, with larger players acquiring smaller companies to expand their product portfolios and technological capabilities.
Land-based Smart Weapons Market Market Trends & Opportunities
The global Land-based Smart Weapons market is projected to experience significant growth, with a Compound Annual Growth Rate (CAGR) of xx% during the forecast period (2025-2033). This growth is fueled by increasing defense budgets globally, particularly in regions experiencing geopolitical instability. Technological advancements, such as the integration of artificial intelligence and improved guidance systems, enhance the accuracy and effectiveness of smart weapons, driving market demand. The market penetration rate of smart weapons within land-based defense systems is expected to reach xx% by 2033, indicating considerable room for expansion. Furthermore, growing demand for precision-guided munitions, reducing civilian casualties, and the development of more sophisticated countermeasures present both opportunities and challenges for market players. The market size is estimated at xx Million USD in 2025 and is expected to reach xx Million USD by 2033.
Dominant Markets & Segments in Land-based Smart Weapons Market
The North American market currently holds the largest share of the Land-based Smart Weapons market, driven by substantial defense spending and technological advancements. However, the Asia-Pacific region is expected to witness the fastest growth rate, fueled by increasing defense modernization programs in countries like India and China.
Leading Segments:
- Product: Missiles dominate the market, followed by ammunitions. The "Other Products" segment (e.g., targeting systems) is experiencing rapid growth.
- Technology: Infrared Guidance currently holds the largest market share due to its effectiveness and cost-efficiency. However, Satellite Guidance and Laser Guidance technologies are showing significant growth potential.
Key Growth Drivers:
- Increased Defense Budgets: Governments globally are allocating substantial funds to upgrade their defense capabilities.
- Technological Advancements: Constant improvements in guidance and targeting systems are enhancing the effectiveness of smart weapons.
- Geopolitical Instability: Regional conflicts and tensions drive demand for advanced weaponry.
Land-based Smart Weapons Market Product Analysis
The Land-based Smart Weapons market is characterized by a wide range of products, from precision-guided missiles to advanced ammunition. Technological advancements such as improved guidance systems (GPS, laser, infrared), enhanced warheads, and better penetration capabilities are driving innovation. Companies are focusing on developing smaller, lighter, and more cost-effective smart weapons to meet diverse battlefield requirements. This includes integrating AI and machine learning for improved accuracy and autonomous targeting capabilities, which is transforming the competitive landscape.
Key Drivers, Barriers & Challenges in Land-based Smart Weapons Market
Key Drivers:
- Technological advancements in guidance and targeting systems.
- Increased defense spending by various countries.
- Growing demand for precision-guided munitions to reduce civilian casualties.
- Geopolitical instability and regional conflicts.
Key Challenges and Restraints:
- Stringent export controls and international arms trade regulations.
- High development and production costs.
- Concerns regarding the ethical implications of autonomous weapons systems.
- Supply chain disruptions impacting the availability of critical components. This has led to an estimated xx% increase in production costs in 2024.
Growth Drivers in the Land-based Smart Weapons Market Market
The primary growth drivers include the continuous advancement of guidance technologies, coupled with rising defense spending and geopolitical instability in several regions. The integration of AI and machine learning is improving precision and reducing collateral damage, further stimulating market growth. Government initiatives supporting R&D in this sector also fuel market expansion.
Challenges Impacting Land-based Smart Weapons Market Growth
The market faces challenges such as stringent regulations on the export and development of advanced weaponry. Supply chain vulnerabilities and potential disruptions pose significant risks, along with the ethical concerns associated with autonomous weapons systems. Competitive pressures and the high cost of R&D are also significant challenges for companies in this field.
Key Players Shaping the Land-based Smart Weapons Market Market
- General Dynamics Corporation
- Rheinmetall AG
- Lockheed Martin Corporation
- MBDA
- Safran SA
- Rafael Advanced Defense Systems Ltd
- RTX Corporation
- BAE Systems PLC
- Northrop Grumman Corporation
- IA
Significant Land-based Smart Weapons Market Industry Milestones
- 2021: Introduction of a new AI-powered targeting system by Lockheed Martin.
- 2022: Merger between two smaller ammunition manufacturers resulting in increased market share for the combined entity.
- 2023: Successful field testing of a hypersonic missile by a major defense contractor. This significantly impacted market perception of missile technology capabilities.
- 2024: New export restrictions imposed on certain types of smart weapons, impacting global supply chains.
Future Outlook for Land-based Smart Weapons Market Market
The Land-based Smart Weapons market is poised for continued growth, driven by advancements in AI, hypersonic technology, and the ongoing demand for precision-guided munitions. Strategic partnerships, investments in R&D, and the development of next-generation weapons systems will shape the market's trajectory. The market offers significant opportunities for companies that can successfully navigate the regulatory environment and meet the evolving demands of defense forces worldwide.
Land-based Smart Weapons Market Segmentation
-
1. Product
- 1.1. Missiles
- 1.2. Ammunitions and Other Products
-
2. Technology
- 2.1. Satellite Guidance
- 2.2. Radar Guidance
- 2.3. Infrared Guidance
- 2.4. Laser Guidance
- 2.5. Other Technologies
Land-based Smart Weapons Market Segmentation By Geography
-
1. North America
- 1.1. United States
- 1.2. Canada
-
2. Europe
- 2.1. United Kingdom
- 2.2. France
- 2.3. Germany
- 2.4. Russia
- 2.5. Rest of Europe
-
3. Asia Pacific
- 3.1. China
- 3.2. India
- 3.3. Japan
- 3.4. Rest of Asia Pacific
-
4. Latin America
- 4.1. Brazil
- 4.2. Rest of Latin America
-
5. Middle East and Africa
- 5.1. Saudi Arabia
- 5.2. United Arab Emirates
- 5.3. Israel
- 5.4. Rest of Middle East and Africa
Land-based Smart Weapons Market REPORT HIGHLIGHTS
| Aspects | Details |
|---|---|
| Study Period | 2019-2033 |
| Base Year | 2024 |
| Estimated Year | 2025 |
| Forecast Period | 2025-2033 |
| Historical Period | 2019-2024 |
| Growth Rate | CAGR of 7.48% from 2019-2033 |
| Segmentation |
|
Table of Contents
- 1. Introduction
- 1.1. Research Scope
- 1.2. Market Segmentation
- 1.3. Research Methodology
- 1.4. Definitions and Assumptions
- 2. Executive Summary
- 2.1. Introduction
- 3. Market Dynamics
- 3.1. Introduction
- 3.2. Market Drivers
- 3.3. Market Restrains
- 3.4. Market Trends
- 3.4.1. Ammunitions and Other Products Segment is Expected to Witness Highest Growth
- 4. Market Factor Analysis
- 4.1. Porters Five Forces
- 4.2. Supply/Value Chain
- 4.3. PESTEL analysis
- 4.4. Market Entropy
- 4.5. Patent/Trademark Analysis
- 5. Global Land-based Smart Weapons Market Analysis, Insights and Forecast, 2019-2031
- 5.1. Market Analysis, Insights and Forecast - by Product
- 5.1.1. Missiles
- 5.1.2. Ammunitions and Other Products
- 5.2. Market Analysis, Insights and Forecast - by Technology
- 5.2.1. Satellite Guidance
- 5.2.2. Radar Guidance
- 5.2.3. Infrared Guidance
- 5.2.4. Laser Guidance
- 5.2.5. Other Technologies
- 5.3. Market Analysis, Insights and Forecast - by Region
- 5.3.1. North America
- 5.3.2. Europe
- 5.3.3. Asia Pacific
- 5.3.4. Latin America
- 5.3.5. Middle East and Africa
- 5.1. Market Analysis, Insights and Forecast - by Product
- 6. North America Land-based Smart Weapons Market Analysis, Insights and Forecast, 2019-2031
- 6.1. Market Analysis, Insights and Forecast - by Product
- 6.1.1. Missiles
- 6.1.2. Ammunitions and Other Products
- 6.2. Market Analysis, Insights and Forecast - by Technology
- 6.2.1. Satellite Guidance
- 6.2.2. Radar Guidance
- 6.2.3. Infrared Guidance
- 6.2.4. Laser Guidance
- 6.2.5. Other Technologies
- 6.1. Market Analysis, Insights and Forecast - by Product
- 7. Europe Land-based Smart Weapons Market Analysis, Insights and Forecast, 2019-2031
- 7.1. Market Analysis, Insights and Forecast - by Product
- 7.1.1. Missiles
- 7.1.2. Ammunitions and Other Products
- 7.2. Market Analysis, Insights and Forecast - by Technology
- 7.2.1. Satellite Guidance
- 7.2.2. Radar Guidance
- 7.2.3. Infrared Guidance
- 7.2.4. Laser Guidance
- 7.2.5. Other Technologies
- 7.1. Market Analysis, Insights and Forecast - by Product
- 8. Asia Pacific Land-based Smart Weapons Market Analysis, Insights and Forecast, 2019-2031
- 8.1. Market Analysis, Insights and Forecast - by Product
- 8.1.1. Missiles
- 8.1.2. Ammunitions and Other Products
- 8.2. Market Analysis, Insights and Forecast - by Technology
- 8.2.1. Satellite Guidance
- 8.2.2. Radar Guidance
- 8.2.3. Infrared Guidance
- 8.2.4. Laser Guidance
- 8.2.5. Other Technologies
- 8.1. Market Analysis, Insights and Forecast - by Product
- 9. Latin America Land-based Smart Weapons Market Analysis, Insights and Forecast, 2019-2031
- 9.1. Market Analysis, Insights and Forecast - by Product
- 9.1.1. Missiles
- 9.1.2. Ammunitions and Other Products
- 9.2. Market Analysis, Insights and Forecast - by Technology
- 9.2.1. Satellite Guidance
- 9.2.2. Radar Guidance
- 9.2.3. Infrared Guidance
- 9.2.4. Laser Guidance
- 9.2.5. Other Technologies
- 9.1. Market Analysis, Insights and Forecast - by Product
- 10. Middle East and Africa Land-based Smart Weapons Market Analysis, Insights and Forecast, 2019-2031
- 10.1. Market Analysis, Insights and Forecast - by Product
- 10.1.1. Missiles
- 10.1.2. Ammunitions and Other Products
- 10.2. Market Analysis, Insights and Forecast - by Technology
- 10.2.1. Satellite Guidance
- 10.2.2. Radar Guidance
- 10.2.3. Infrared Guidance
- 10.2.4. Laser Guidance
- 10.2.5. Other Technologies
- 10.1. Market Analysis, Insights and Forecast - by Product
- 11. North America Land-based Smart Weapons Market Analysis, Insights and Forecast, 2019-2031
- 11.1. Market Analysis, Insights and Forecast - By Country/Sub-region
- 11.1.1 United States
- 11.1.2 Canada
- 12. Europe Land-based Smart Weapons Market Analysis, Insights and Forecast, 2019-2031
- 12.1. Market Analysis, Insights and Forecast - By Country/Sub-region
- 12.1.1 United Kingdom
- 12.1.2 France
- 12.1.3 Germany
- 12.1.4 Russia
- 12.1.5 Rest of Europe
- 13. Asia Pacific Land-based Smart Weapons Market Analysis, Insights and Forecast, 2019-2031
- 13.1. Market Analysis, Insights and Forecast - By Country/Sub-region
- 13.1.1 China
- 13.1.2 India
- 13.1.3 Japan
- 13.1.4 Rest of Asia Pacific
- 14. Latin America Land-based Smart Weapons Market Analysis, Insights and Forecast, 2019-2031
- 14.1. Market Analysis, Insights and Forecast - By Country/Sub-region
- 14.1.1 Brazil
- 14.1.2 Rest of Latin America
- 15. Middle East and Africa Land-based Smart Weapons Market Analysis, Insights and Forecast, 2019-2031
- 15.1. Market Analysis, Insights and Forecast - By Country/Sub-region
- 15.1.1 Saudi Arabia
- 15.1.2 United Arab Emirates
- 15.1.3 Israel
- 15.1.4 Rest of Middle East and Africa
- 16. Competitive Analysis
- 16.1. Global Market Share Analysis 2024
- 16.2. Company Profiles
- 16.2.1 General Dynamics Corporation
- 16.2.1.1. Overview
- 16.2.1.2. Products
- 16.2.1.3. SWOT Analysis
- 16.2.1.4. Recent Developments
- 16.2.1.5. Financials (Based on Availability)
- 16.2.2 Rheinmetall AG
- 16.2.2.1. Overview
- 16.2.2.2. Products
- 16.2.2.3. SWOT Analysis
- 16.2.2.4. Recent Developments
- 16.2.2.5. Financials (Based on Availability)
- 16.2.3 Lockheed Martin Corporation
- 16.2.3.1. Overview
- 16.2.3.2. Products
- 16.2.3.3. SWOT Analysis
- 16.2.3.4. Recent Developments
- 16.2.3.5. Financials (Based on Availability)
- 16.2.4 MBDA
- 16.2.4.1. Overview
- 16.2.4.2. Products
- 16.2.4.3. SWOT Analysis
- 16.2.4.4. Recent Developments
- 16.2.4.5. Financials (Based on Availability)
- 16.2.5 Safran SA
- 16.2.5.1. Overview
- 16.2.5.2. Products
- 16.2.5.3. SWOT Analysis
- 16.2.5.4. Recent Developments
- 16.2.5.5. Financials (Based on Availability)
- 16.2.6 Rafael Advanced Defense Systems Ltd
- 16.2.6.1. Overview
- 16.2.6.2. Products
- 16.2.6.3. SWOT Analysis
- 16.2.6.4. Recent Developments
- 16.2.6.5. Financials (Based on Availability)
- 16.2.7 RTX Corporation
- 16.2.7.1. Overview
- 16.2.7.2. Products
- 16.2.7.3. SWOT Analysis
- 16.2.7.4. Recent Developments
- 16.2.7.5. Financials (Based on Availability)
- 16.2.8 BAE Systems PLC
- 16.2.8.1. Overview
- 16.2.8.2. Products
- 16.2.8.3. SWOT Analysis
- 16.2.8.4. Recent Developments
- 16.2.8.5. Financials (Based on Availability)
- 16.2.9 Northrop Grumman Corporation
- 16.2.9.1. Overview
- 16.2.9.2. Products
- 16.2.9.3. SWOT Analysis
- 16.2.9.4. Recent Developments
- 16.2.9.5. Financials (Based on Availability)
- 16.2.10 IA
- 16.2.10.1. Overview
- 16.2.10.2. Products
- 16.2.10.3. SWOT Analysis
- 16.2.10.4. Recent Developments
- 16.2.10.5. Financials (Based on Availability)
- 16.2.1 General Dynamics Corporation
List of Figures
- Figure 1: Global Land-based Smart Weapons Market Revenue Breakdown (Million, %) by Region 2024 & 2032
- Figure 2: North America Land-based Smart Weapons Market Revenue (Million), by Country 2024 & 2032
- Figure 3: North America Land-based Smart Weapons Market Revenue Share (%), by Country 2024 & 2032
- Figure 4: Europe Land-based Smart Weapons Market Revenue (Million), by Country 2024 & 2032
- Figure 5: Europe Land-based Smart Weapons Market Revenue Share (%), by Country 2024 & 2032
- Figure 6: Asia Pacific Land-based Smart Weapons Market Revenue (Million), by Country 2024 & 2032
- Figure 7: Asia Pacific Land-based Smart Weapons Market Revenue Share (%), by Country 2024 & 2032
- Figure 8: Latin America Land-based Smart Weapons Market Revenue (Million), by Country 2024 & 2032
- Figure 9: Latin America Land-based Smart Weapons Market Revenue Share (%), by Country 2024 & 2032
- Figure 10: Middle East and Africa Land-based Smart Weapons Market Revenue (Million), by Country 2024 & 2032
- Figure 11: Middle East and Africa Land-based Smart Weapons Market Revenue Share (%), by Country 2024 & 2032
- Figure 12: North America Land-based Smart Weapons Market Revenue (Million), by Product 2024 & 2032
- Figure 13: North America Land-based Smart Weapons Market Revenue Share (%), by Product 2024 & 2032
- Figure 14: North America Land-based Smart Weapons Market Revenue (Million), by Technology 2024 & 2032
- Figure 15: North America Land-based Smart Weapons Market Revenue Share (%), by Technology 2024 & 2032
- Figure 16: North America Land-based Smart Weapons Market Revenue (Million), by Country 2024 & 2032
- Figure 17: North America Land-based Smart Weapons Market Revenue Share (%), by Country 2024 & 2032
- Figure 18: Europe Land-based Smart Weapons Market Revenue (Million), by Product 2024 & 2032
- Figure 19: Europe Land-based Smart Weapons Market Revenue Share (%), by Product 2024 & 2032
- Figure 20: Europe Land-based Smart Weapons Market Revenue (Million), by Technology 2024 & 2032
- Figure 21: Europe Land-based Smart Weapons Market Revenue Share (%), by Technology 2024 & 2032
- Figure 22: Europe Land-based Smart Weapons Market Revenue (Million), by Country 2024 & 2032
- Figure 23: Europe Land-based Smart Weapons Market Revenue Share (%), by Country 2024 & 2032
- Figure 24: Asia Pacific Land-based Smart Weapons Market Revenue (Million), by Product 2024 & 2032
- Figure 25: Asia Pacific Land-based Smart Weapons Market Revenue Share (%), by Product 2024 & 2032
- Figure 26: Asia Pacific Land-based Smart Weapons Market Revenue (Million), by Technology 2024 & 2032
- Figure 27: Asia Pacific Land-based Smart Weapons Market Revenue Share (%), by Technology 2024 & 2032
- Figure 28: Asia Pacific Land-based Smart Weapons Market Revenue (Million), by Country 2024 & 2032
- Figure 29: Asia Pacific Land-based Smart Weapons Market Revenue Share (%), by Country 2024 & 2032
- Figure 30: Latin America Land-based Smart Weapons Market Revenue (Million), by Product 2024 & 2032
- Figure 31: Latin America Land-based Smart Weapons Market Revenue Share (%), by Product 2024 & 2032
- Figure 32: Latin America Land-based Smart Weapons Market Revenue (Million), by Technology 2024 & 2032
- Figure 33: Latin America Land-based Smart Weapons Market Revenue Share (%), by Technology 2024 & 2032
- Figure 34: Latin America Land-based Smart Weapons Market Revenue (Million), by Country 2024 & 2032
- Figure 35: Latin America Land-based Smart Weapons Market Revenue Share (%), by Country 2024 & 2032
- Figure 36: Middle East and Africa Land-based Smart Weapons Market Revenue (Million), by Product 2024 & 2032
- Figure 37: Middle East and Africa Land-based Smart Weapons Market Revenue Share (%), by Product 2024 & 2032
- Figure 38: Middle East and Africa Land-based Smart Weapons Market Revenue (Million), by Technology 2024 & 2032
- Figure 39: Middle East and Africa Land-based Smart Weapons Market Revenue Share (%), by Technology 2024 & 2032
- Figure 40: Middle East and Africa Land-based Smart Weapons Market Revenue (Million), by Country 2024 & 2032
- Figure 41: Middle East and Africa Land-based Smart Weapons Market Revenue Share (%), by Country 2024 & 2032
List of Tables
- Table 1: Global Land-based Smart Weapons Market Revenue Million Forecast, by Region 2019 & 2032
- Table 2: Global Land-based Smart Weapons Market Revenue Million Forecast, by Product 2019 & 2032
- Table 3: Global Land-based Smart Weapons Market Revenue Million Forecast, by Technology 2019 & 2032
- Table 4: Global Land-based Smart Weapons Market Revenue Million Forecast, by Region 2019 & 2032
- Table 5: Global Land-based Smart Weapons Market Revenue Million Forecast, by Country 2019 & 2032
- Table 6: United States Land-based Smart Weapons Market Revenue (Million) Forecast, by Application 2019 & 2032
- Table 7: Canada Land-based Smart Weapons Market Revenue (Million) Forecast, by Application 2019 & 2032
- Table 8: Global Land-based Smart Weapons Market Revenue Million Forecast, by Country 2019 & 2032
- Table 9: United Kingdom Land-based Smart Weapons Market Revenue (Million) Forecast, by Application 2019 & 2032
- Table 10: France Land-based Smart Weapons Market Revenue (Million) Forecast, by Application 2019 & 2032
- Table 11: Germany Land-based Smart Weapons Market Revenue (Million) Forecast, by Application 2019 & 2032
- Table 12: Russia Land-based Smart Weapons Market Revenue (Million) Forecast, by Application 2019 & 2032
- Table 13: Rest of Europe Land-based Smart Weapons Market Revenue (Million) Forecast, by Application 2019 & 2032
- Table 14: Global Land-based Smart Weapons Market Revenue Million Forecast, by Country 2019 & 2032
- Table 15: China Land-based Smart Weapons Market Revenue (Million) Forecast, by Application 2019 & 2032
- Table 16: India Land-based Smart Weapons Market Revenue (Million) Forecast, by Application 2019 & 2032
- Table 17: Japan Land-based Smart Weapons Market Revenue (Million) Forecast, by Application 2019 & 2032
- Table 18: Rest of Asia Pacific Land-based Smart Weapons Market Revenue (Million) Forecast, by Application 2019 & 2032
- Table 19: Global Land-based Smart Weapons Market Revenue Million Forecast, by Country 2019 & 2032
- Table 20: Brazil Land-based Smart Weapons Market Revenue (Million) Forecast, by Application 2019 & 2032
- Table 21: Rest of Latin America Land-based Smart Weapons Market Revenue (Million) Forecast, by Application 2019 & 2032
- Table 22: Global Land-based Smart Weapons Market Revenue Million Forecast, by Country 2019 & 2032
- Table 23: Saudi Arabia Land-based Smart Weapons Market Revenue (Million) Forecast, by Application 2019 & 2032
- Table 24: United Arab Emirates Land-based Smart Weapons Market Revenue (Million) Forecast, by Application 2019 & 2032
- Table 25: Israel Land-based Smart Weapons Market Revenue (Million) Forecast, by Application 2019 & 2032
- Table 26: Rest of Middle East and Africa Land-based Smart Weapons Market Revenue (Million) Forecast, by Application 2019 & 2032
- Table 27: Global Land-based Smart Weapons Market Revenue Million Forecast, by Product 2019 & 2032
- Table 28: Global Land-based Smart Weapons Market Revenue Million Forecast, by Technology 2019 & 2032
- Table 29: Global Land-based Smart Weapons Market Revenue Million Forecast, by Country 2019 & 2032
- Table 30: United States Land-based Smart Weapons Market Revenue (Million) Forecast, by Application 2019 & 2032
- Table 31: Canada Land-based Smart Weapons Market Revenue (Million) Forecast, by Application 2019 & 2032
- Table 32: Global Land-based Smart Weapons Market Revenue Million Forecast, by Product 2019 & 2032
- Table 33: Global Land-based Smart Weapons Market Revenue Million Forecast, by Technology 2019 & 2032
- Table 34: Global Land-based Smart Weapons Market Revenue Million Forecast, by Country 2019 & 2032
- Table 35: United Kingdom Land-based Smart Weapons Market Revenue (Million) Forecast, by Application 2019 & 2032
- Table 36: France Land-based Smart Weapons Market Revenue (Million) Forecast, by Application 2019 & 2032
- Table 37: Germany Land-based Smart Weapons Market Revenue (Million) Forecast, by Application 2019 & 2032
- Table 38: Russia Land-based Smart Weapons Market Revenue (Million) Forecast, by Application 2019 & 2032
- Table 39: Rest of Europe Land-based Smart Weapons Market Revenue (Million) Forecast, by Application 2019 & 2032
- Table 40: Global Land-based Smart Weapons Market Revenue Million Forecast, by Product 2019 & 2032
- Table 41: Global Land-based Smart Weapons Market Revenue Million Forecast, by Technology 2019 & 2032
- Table 42: Global Land-based Smart Weapons Market Revenue Million Forecast, by Country 2019 & 2032
- Table 43: China Land-based Smart Weapons Market Revenue (Million) Forecast, by Application 2019 & 2032
- Table 44: India Land-based Smart Weapons Market Revenue (Million) Forecast, by Application 2019 & 2032
- Table 45: Japan Land-based Smart Weapons Market Revenue (Million) Forecast, by Application 2019 & 2032
- Table 46: Rest of Asia Pacific Land-based Smart Weapons Market Revenue (Million) Forecast, by Application 2019 & 2032
- Table 47: Global Land-based Smart Weapons Market Revenue Million Forecast, by Product 2019 & 2032
- Table 48: Global Land-based Smart Weapons Market Revenue Million Forecast, by Technology 2019 & 2032
- Table 49: Global Land-based Smart Weapons Market Revenue Million Forecast, by Country 2019 & 2032
- Table 50: Brazil Land-based Smart Weapons Market Revenue (Million) Forecast, by Application 2019 & 2032
- Table 51: Rest of Latin America Land-based Smart Weapons Market Revenue (Million) Forecast, by Application 2019 & 2032
- Table 52: Global Land-based Smart Weapons Market Revenue Million Forecast, by Product 2019 & 2032
- Table 53: Global Land-based Smart Weapons Market Revenue Million Forecast, by Technology 2019 & 2032
- Table 54: Global Land-based Smart Weapons Market Revenue Million Forecast, by Country 2019 & 2032
- Table 55: Saudi Arabia Land-based Smart Weapons Market Revenue (Million) Forecast, by Application 2019 & 2032
- Table 56: United Arab Emirates Land-based Smart Weapons Market Revenue (Million) Forecast, by Application 2019 & 2032
- Table 57: Israel Land-based Smart Weapons Market Revenue (Million) Forecast, by Application 2019 & 2032
- Table 58: Rest of Middle East and Africa Land-based Smart Weapons Market Revenue (Million) Forecast, by Application 2019 & 2032
Frequently Asked Questions
1. What is the projected Compound Annual Growth Rate (CAGR) of the Land-based Smart Weapons Market?
The projected CAGR is approximately 7.48%.
2. Which companies are prominent players in the Land-based Smart Weapons Market?
Key companies in the market include General Dynamics Corporation, Rheinmetall AG, Lockheed Martin Corporation, MBDA, Safran SA, Rafael Advanced Defense Systems Ltd, RTX Corporation, BAE Systems PLC, Northrop Grumman Corporation, IA.
3. What are the main segments of the Land-based Smart Weapons Market?
The market segments include Product, Technology.
4. Can you provide details about the market size?
The market size is estimated to be USD 7.35 Million as of 2022.
5. What are some drivers contributing to market growth?
N/A
6. What are the notable trends driving market growth?
Ammunitions and Other Products Segment is Expected to Witness Highest Growth.
7. Are there any restraints impacting market growth?
N/A
8. Can you provide examples of recent developments in the market?
N/A
9. What pricing options are available for accessing the report?
Pricing options include single-user, multi-user, and enterprise licenses priced at USD 4750, USD 5250, and USD 8750 respectively.
10. Is the market size provided in terms of value or volume?
The market size is provided in terms of value, measured in Million.
11. Are there any specific market keywords associated with the report?
Yes, the market keyword associated with the report is "Land-based Smart Weapons Market," which aids in identifying and referencing the specific market segment covered.
12. How do I determine which pricing option suits my needs best?
The pricing options vary based on user requirements and access needs. Individual users may opt for single-user licenses, while businesses requiring broader access may choose multi-user or enterprise licenses for cost-effective access to the report.
13. Are there any additional resources or data provided in the Land-based Smart Weapons Market report?
While the report offers comprehensive insights, it's advisable to review the specific contents or supplementary materials provided to ascertain if additional resources or data are available.
14. How can I stay updated on further developments or reports in the Land-based Smart Weapons Market?
To stay informed about further developments, trends, and reports in the Land-based Smart Weapons Market, consider subscribing to industry newsletters, following relevant companies and organizations, or regularly checking reputable industry news sources and publications.
Methodology
Step 1 - Identification of Relevant Samples Size from Population Database


Step 2 - Approaches for Defining Global Market Size (Value, Volume* & Price*)

Note*: In applicable scenarios
Step 3 - Data Sources
Primary Research
- Web Analytics
- Survey Reports
- Research Institute
- Latest Research Reports
- Opinion Leaders
Secondary Research
- Annual Reports
- White Paper
- Latest Press Release
- Industry Association
- Paid Database
- Investor Presentations

Step 4 - Data Triangulation
Involves using different sources of information in order to increase the validity of a study
These sources are likely to be stakeholders in a program - participants, other researchers, program staff, other community members, and so on.
Then we put all data in single framework & apply various statistical tools to find out the dynamic on the market.
During the analysis stage, feedback from the stakeholder groups would be compared to determine areas of agreement as well as areas of divergence
