

Key Insights
The Unexploded Ordnance (UXO) Detection market is projected for substantial growth, with an estimated market size of $3.15 billion. This expansion is driven by a robust CAGR of 14.42% from a base year of 2025. Key growth drivers include rising geopolitical tensions, active demining operations in post-conflict zones, and increased infrastructure development necessitating the identification of legacy ordnance. Technological advancements in geophysical sensors, AI-driven data analysis, and enhanced drone survey capabilities are improving detection accuracy and efficiency, stimulating market demand. Furthermore, regulatory requirements and a heightened focus on environmental safety and remediation are bolstering the market outlook.
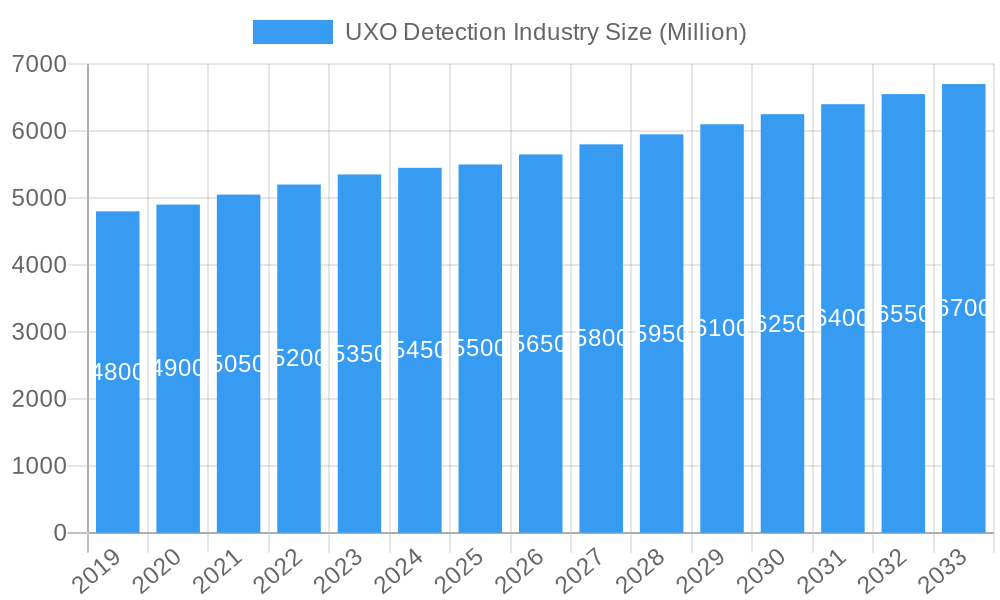
UXO Detection Industry Market Size (In Billion)
The UXO Detection market is segmented into Hardware and Software. The Hardware segment, including advanced metal detectors, ground-penetrating radar (GPR), magnetometers, and specialized vehicles, currently dominates the market. However, the Software segment, focused on data processing, interpretation, and mapping, is experiencing accelerated growth. This is due to the increasing volume and complexity of data from advanced hardware, and the growing dependence on sophisticated algorithms for accurate threat assessment and site clearance. Leading companies such as Vallon GmbH, Seequent Limited, and Gem Systems Inc. are investing in R&D for integrated and intelligent solutions. Geographically, North America and Europe are established markets with mature demining programs and strict safety regulations. The Asia Pacific region, particularly India and China, offers significant growth potential driven by infrastructure expansion and historical military activities.
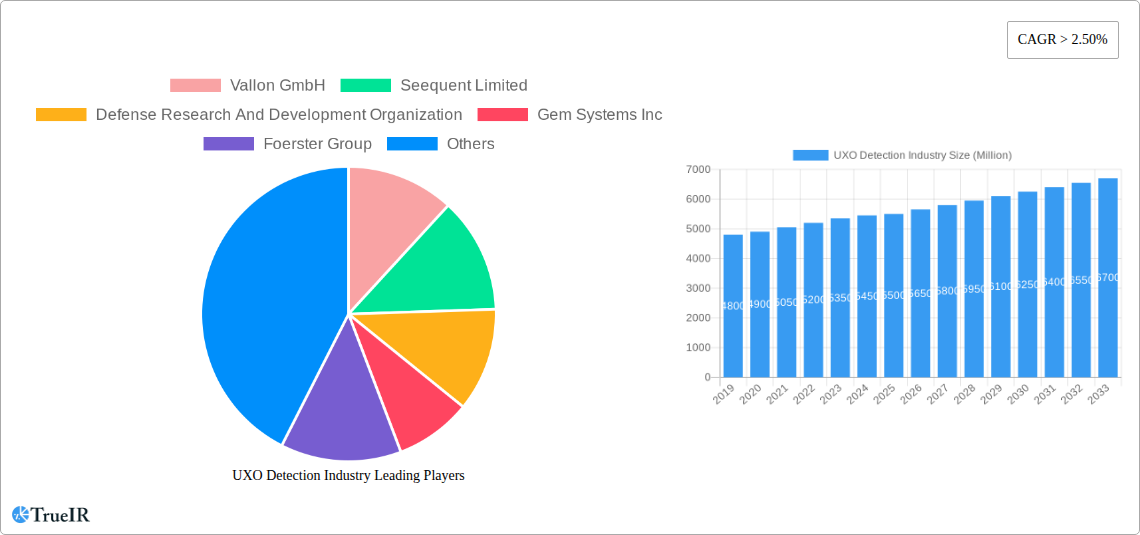
UXO Detection Industry Company Market Share
UXO Detection Industry Market Structure & Competitive Landscape
The Unexploded Ordnance (UXO) Detection Industry exhibits a moderately concentrated market structure, with key players investing heavily in research and development to drive innovation. Innovation drivers are primarily fueled by advancements in sensor technology, data processing, and artificial intelligence, leading to improved accuracy and efficiency in UXO identification and mapping. Regulatory impacts, particularly stringent safety standards and environmental protection mandates in sectors like construction, infrastructure development, and defense, are shaping market entry and operational requirements. Product substitutes, while limited in terms of direct replacement for specialized UXO detection equipment, include advancements in drone-based inspection and remote sensing technologies that augment traditional methods. End-user segmentation reveals significant demand from defense and security, followed by infrastructure development and civil engineering projects. Mergers and Acquisitions (M&A) trends are observed as companies seek to expand their technological portfolios, geographical reach, and market share. Recent M&A activity indicates a consolidation phase, with an estimated 50 to 100 significant M&A deals recorded globally over the historical period. Concentration ratios in the top 5 companies are estimated to be around 40% to 60%.
UXO Detection Industry Market Trends & Opportunities
The UXO Detection Industry is poised for substantial growth, with the global market size projected to reach $7,500 Million by 2033, exhibiting a Compound Annual Growth Rate (CAGR) of 8.5% from the base year of 2025. This robust expansion is driven by a confluence of technological advancements, increasing global awareness of UXO hazards, and a surge in infrastructure development and decommissioning projects worldwide. Technological shifts are a primary catalyst, with the integration of Artificial Intelligence (AI) and Machine Learning (ML) revolutionizing data analysis and interpretation, leading to faster and more accurate detection. Advanced sensor technologies, including more sensitive magnetometers, ground-penetrating radar (GPR), and electromagnetic induction (EMI) systems, are continuously being developed to enhance detection capabilities for a wider range of ordnance types and at greater depths. The evolution of drone-based UXO detection platforms is also a significant trend, offering improved aerial reconnaissance, reduced human exposure to hazardous environments, and enhanced data collection efficiency.
Consumer preferences are increasingly leaning towards non-intrusive and highly efficient detection methods. Clients are demanding solutions that minimize environmental impact and disruption to ongoing operations, pushing for the adoption of advanced software for predictive analysis and site assessment. This has created a fertile ground for software-based UXO detection solutions that integrate with hardware to provide comprehensive site management and risk assessment tools.
Competitive dynamics are intensifying, with established players actively investing in R&D and strategic partnerships to maintain their market leadership. The emergence of new entrants, particularly technology startups specializing in niche areas like AI-powered data analysis for UXO, is also contributing to market dynamism. The growing number of international demining efforts and the increasing focus on land reclamation for economic development are further bolstering demand. Furthermore, the aging infrastructure in many developed nations necessitates extensive site surveys and potential remediation, inadvertently driving the need for UXO detection services. The forecast period anticipates a significant increase in market penetration rates, with UXO detection solutions becoming more integrated into standard civil engineering and defense planning processes, moving from specialized niche applications to mainstream risk mitigation strategies. The total market opportunity is estimated to expand from $4,000 Million in 2024 to $7,500 Million by 2033.
Dominant Markets & Segments in UXO Detection Industry
The global UXO Detection Industry is significantly influenced by regional infrastructure development, stringent safety policies, and the presence of legacy contamination. Currently, the Hardware segment holds a dominant position within the System Type classification, driven by the fundamental need for robust and reliable detection equipment. This segment is expected to represent an estimated 70% to 80% of the total market value during the forecast period.
Key Growth Drivers in the Hardware Segment:
- Defense and Military Modernization: Ongoing military exercises, training grounds, and areas of historical conflict globally necessitate continuous UXO clearance and detection. Government budgetary allocations towards defense and national security are a primary driver, with estimated annual defense spending exceeding $2,000,000 Million across major economies.
- Infrastructure Development Projects: Large-scale construction projects, including urban expansion, transportation networks (railways, highways), and energy infrastructure (pipelines, power plants), often require thorough site surveys to identify and mitigate UXO risks. The global infrastructure spending is projected to surpass $8,000,000 Million annually.
- Environmental Remediation and Land Reclamation: The decommissioning of former military sites, industrial areas, and the need to reclaim land for civilian use are significant contributors to hardware demand. Regulatory mandates for environmental safety further enforce these activities.
- Technological Advancements in Sensors: Continuous innovation in magnetometer, GPR, and EMI technologies, leading to enhanced sensitivity, accuracy, and portability, fuels the adoption of new hardware. The global market for sensor technology is estimated to grow by 7% CAGR.
Regionally, North America and Europe currently dominate the UXO Detection Industry, primarily due to mature infrastructure development cycles, robust regulatory frameworks, and a significant legacy of ordnance contamination from past conflicts. These regions collectively account for an estimated 55% to 65% of the global market share. The United States, with its extensive military history and ongoing infrastructure modernization, represents a significant market within North America, contributing an estimated $1,500 Million annually to the UXO detection market. Germany and the United Kingdom are key players in Europe, driven by extensive demining efforts and infrastructure upgrade programs.
The Software segment, while currently smaller, is experiencing the fastest growth rate, projected to achieve a CAGR of 12% over the forecast period. This segment's dominance will increase as integrated solutions and data analytics become more critical. The development of sophisticated software for data visualization, site modeling, risk assessment, and automated anomaly detection is transforming how UXO detection projects are managed. The integration of AI and machine learning in software is enhancing the efficiency and accuracy of interpreting sensor data, allowing for more precise identification and localization of UXO threats. The estimated market value for UXO detection software is projected to grow from $500 Million in 2025 to over $1,500 Million by 2033.
UXO Detection Industry Product Analysis
Product innovations in the UXO Detection Industry are centered on enhancing detection accuracy, improving data processing capabilities, and increasing operational efficiency and safety. Key advancements include the development of multi-sensor fusion technologies that combine data from various sensors (e.g., magnetometers, GPR, EMI) for more reliable anomaly identification. Advanced algorithms and AI are being integrated into software platforms to automate data analysis, reducing interpretation time and human error. Competitive advantages are derived from systems offering greater depth penetration, higher resolution imaging, and the ability to distinguish between metallic debris and actual ordnance. Applications span a wide range, from large-scale infrastructure development and military site clearance to archaeological surveys and maritime UXO surveys, demonstrating the versatility and critical importance of these technologies in ensuring safety and enabling development.
Key Drivers, Barriers & Challenges in UXO Detection Industry
Key Drivers in the UXO Detection Industry:
- Technological Advancements: Continuous innovation in sensor technology, AI-driven data analytics, and drone integration significantly enhances detection capabilities. For example, the development of ultra-sensitive magnetometers capable of detecting smaller ferrous objects at greater depths.
- Infrastructure Development: Global investments in infrastructure, including transportation, energy, and urban development, necessitate comprehensive site surveys for UXO, driving demand for detection services. Global infrastructure spending is projected to exceed $8,000,000 Million annually.
- Regulatory Mandates: Stringent government regulations and environmental safety standards in construction and defense sectors mandate UXO clearance, creating a consistent demand.
- Geopolitical Factors: Ongoing global conflicts and a legacy of historical ordnance contamination in various regions necessitate continuous demining and clearance efforts, with annual demining budgets estimated at $500 Million.
Barriers & Challenges in UXO Detection Industry:
- High Initial Investment Costs: Advanced UXO detection equipment and software require significant capital expenditure, posing a barrier for smaller companies and less developed regions. The average cost of a high-end UXO detection system can range from $50,000 to $500,000.
- Complex Regulatory Landscape: Navigating diverse and evolving regulatory requirements across different countries and jurisdictions can be challenging and time-consuming.
- Supply Chain Disruptions: The global supply chain for specialized components used in detection equipment can be vulnerable to disruptions, impacting production timelines and costs.
- Skilled Workforce Shortage: A lack of adequately trained personnel to operate sophisticated equipment and interpret complex data can limit market growth.
- Competitive Pressures: Intense competition among existing players and the emergence of new technologies can lead to price wars and reduced profit margins.
Growth Drivers in the UXO Detection Industry Market
Key growth drivers in the UXO Detection Industry are multifaceted. Technologically, advancements in AI and machine learning are revolutionizing data interpretation, leading to faster and more accurate identification of unexploded ordnance. The integration of drone technology with advanced sensors allows for safer, more efficient aerial surveys, expanding operational capabilities into challenging terrains. Economically, robust global infrastructure development, particularly in emerging economies, is creating significant demand for site clearance and safety assessments, with global infrastructure spending projected to exceed $8,000,000 Million annually. Regulatory drivers, such as stringent environmental protection laws and safety standards in construction and defense sectors, mandate thorough UXO surveys before any ground disturbance. This ensures a consistent demand for detection services.
Challenges Impacting UXO Detection Industry Growth
Challenges impacting UXO Detection Industry growth include significant regulatory complexities that vary widely across different countries, requiring substantial time and resources for compliance. Supply chain issues, particularly for specialized electronic components, can lead to production delays and increased costs for equipment manufacturers. Competitive pressures from both established players and emerging technology providers are intensifying, potentially leading to price erosion and impacting profitability. The substantial initial investment required for sophisticated detection equipment and software also presents a barrier to entry for smaller organizations. Furthermore, a persistent shortage of skilled professionals trained in operating advanced detection systems and interpreting complex geospatial data limits the scalability of operations.
Key Players Shaping the UXO Detection Industry Market
- Vallon GmbH
- Seequent Limited
- Defense Research And Development Organization
- Gem Systems Inc
- Foerster Group
- Schonstedt Instrument Company
- OPEC Systems Pty Ltd
- Dynasafe AB
- MRS Management Limited
Significant UXO Detection Industry Industry Milestones
- 2019: Introduction of advanced AI algorithms for automated anomaly detection in sensor data.
- 2020: Significant increase in drone-based UXO survey deployments for infrastructure projects.
- 2021: Development of multi-sensor fusion systems offering enhanced detection accuracy.
- 2022: Increased regulatory focus on maritime UXO surveys for offshore wind farm development.
- 2023: Expansion of cloud-based data management solutions for UXO detection projects.
- 2024: Strategic partnerships formed to integrate advanced GPR technology with drone platforms.
Future Outlook for UXO Detection Industry Market
The future outlook for the UXO Detection Industry is exceptionally positive, driven by continued technological innovation and increasing global demand. The integration of AI and machine learning will further refine detection accuracy and speed, while drone technology will continue to expand operational capabilities. Robust infrastructure development projects worldwide and stricter regulatory enforcement for land safety will sustain market growth. Emerging markets, with their significant development potential and often considerable legacy UXO contamination, represent substantial growth catalysts. Strategic opportunities lie in the development of integrated, end-to-end UXO management solutions encompassing detection, assessment, and remediation planning, ensuring a safer and more productive use of land globally. The market is projected to reach $7,500 Million by 2033.
UXO Detection Industry Segmentation
-
1. System Type
- 1.1. Hardware
- 1.2. Software
UXO Detection Industry Segmentation By Geography
-
1. North America
- 1.1. United States
- 1.2. Canada
-
2. Europe
- 2.1. Germany
- 2.2. United Kingdom
- 2.3. France
- 2.4. Rest of Europe
-
3. Asia Pacific
- 3.1. India
- 3.2. China
- 3.3. Japan
- 3.4. South Korea
- 3.5. Rest of Asia Pacific
-
4. Latin America
- 4.1. Mexico
- 4.2. Brazil
- 4.3. Rest Of Latin America
-
5. Middle East and Africa
- 5.1. Saudi Arabia
- 5.2. Israel
- 5.3. Rest Of Middle East and Africa
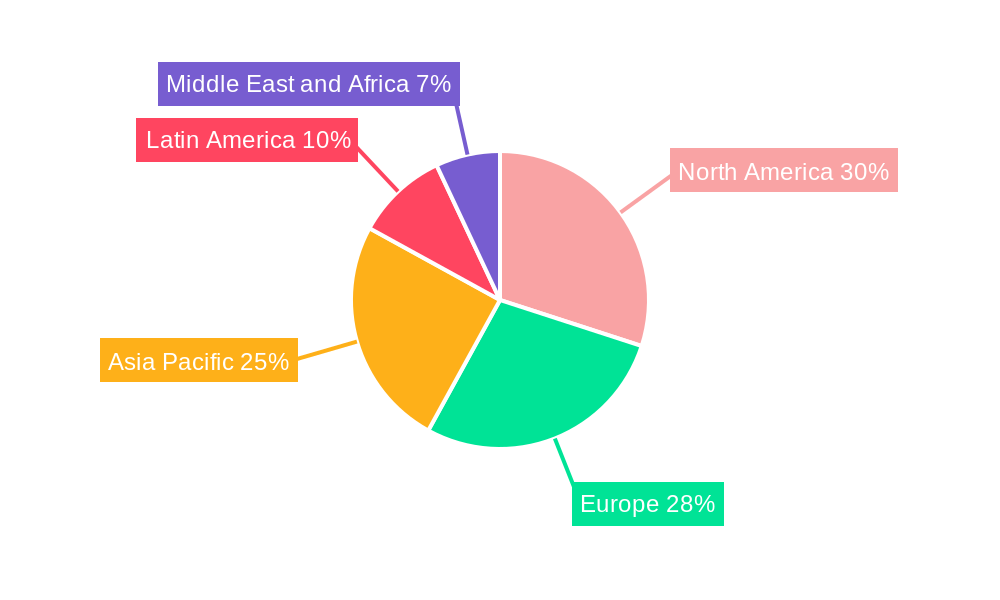
UXO Detection Industry Regional Market Share
Geographic Coverage of UXO Detection Industry
UXO Detection Industry REPORT HIGHLIGHTS
| Aspects | Details |
|---|---|
| Study Period | 2020-2034 |
| Base Year | 2025 |
| Estimated Year | 2026 |
| Forecast Period | 2026-2034 |
| Historical Period | 2020-2025 |
| Growth Rate | CAGR of 14.42% from 2020-2034 |
| Segmentation |
|
Table of Contents
- 1. Introduction
- 1.1. Research Scope
- 1.2. Market Segmentation
- 1.3. Research Objective
- 1.4. Definitions and Assumptions
- 2. Executive Summary
- 2.1. Market Snapshot
- 3. Market Dynamics
- 3.1. Market Drivers
- 3.2. Market Restrains
- 3.3. Market Trends
- 3.4. Market Opportunities
- 4. Market Factor Analysis
- 4.1. Porters Five Forces
- 4.1.1. Bargaining Power of Suppliers
- 4.1.2. Bargaining Power of Buyers
- 4.1.3. Threat of New Entrants
- 4.1.4. Threat of Substitutes
- 4.1.5. Competitive Rivalry
- 4.2. PESTEL analysis
- 4.3. BCG Analysis
- 4.3.1. Stars (High Growth, High Market Share)
- 4.3.2. Cash Cows (Low Growth, High Market Share)
- 4.3.3. Question Mark (High Growth, Low Market Share)
- 4.3.4. Dogs (Low Growth, Low Market Share)
- 4.4. Ansoff Matrix Analysis
- 4.5. Supply Chain Analysis
- 4.6. Regulatory Landscape
- 4.7. Current Market Potential and Opportunity Assessment (TAM–SAM–SOM Framework)
- 4.8. TIR Analyst Note
- 4.1. Porters Five Forces
- 5. Market Analysis, Insights and Forecast 2021-2033
- 5.1. Market Analysis, Insights and Forecast - by System Type
- 5.1.1. Hardware
- 5.1.2. Software
- 5.2. Market Analysis, Insights and Forecast - by Region
- 5.2.1. North America
- 5.2.2. Europe
- 5.2.3. Asia Pacific
- 5.2.4. Latin America
- 5.2.5. Middle East and Africa
- 5.1. Market Analysis, Insights and Forecast - by System Type
- 6. Global UXO Detection Industry Analysis, Insights and Forecast, 2021-2033
- 6.1. Market Analysis, Insights and Forecast - by System Type
- 6.1.1. Hardware
- 6.1.2. Software
- 6.1. Market Analysis, Insights and Forecast - by System Type
- 7. North America UXO Detection Industry Analysis, Insights and Forecast, 2020-2032
- 7.1. Market Analysis, Insights and Forecast - by System Type
- 7.1.1. Hardware
- 7.1.2. Software
- 7.1. Market Analysis, Insights and Forecast - by System Type
- 8. Europe UXO Detection Industry Analysis, Insights and Forecast, 2020-2032
- 8.1. Market Analysis, Insights and Forecast - by System Type
- 8.1.1. Hardware
- 8.1.2. Software
- 8.1. Market Analysis, Insights and Forecast - by System Type
- 9. Asia Pacific UXO Detection Industry Analysis, Insights and Forecast, 2020-2032
- 9.1. Market Analysis, Insights and Forecast - by System Type
- 9.1.1. Hardware
- 9.1.2. Software
- 9.1. Market Analysis, Insights and Forecast - by System Type
- 10. Latin America UXO Detection Industry Analysis, Insights and Forecast, 2020-2032
- 10.1. Market Analysis, Insights and Forecast - by System Type
- 10.1.1. Hardware
- 10.1.2. Software
- 10.1. Market Analysis, Insights and Forecast - by System Type
- 11. Middle East and Africa UXO Detection Industry Analysis, Insights and Forecast, 2020-2032
- 11.1. Market Analysis, Insights and Forecast - by System Type
- 11.1.1. Hardware
- 11.1.2. Software
- 11.1. Market Analysis, Insights and Forecast - by System Type
- 12. Competitive Analysis
- 12.1. Company Profiles
- 12.1.1 Vallon GmbH
- 12.1.1.1. Company Overview
- 12.1.1.2. Products
- 12.1.1.3. Company Financials
- 12.1.1.4. SWOT Analysis
- 12.1.2 Seequent Limited
- 12.1.2.1. Company Overview
- 12.1.2.2. Products
- 12.1.2.3. Company Financials
- 12.1.2.4. SWOT Analysis
- 12.1.3 Defense Research And Development Organization
- 12.1.3.1. Company Overview
- 12.1.3.2. Products
- 12.1.3.3. Company Financials
- 12.1.3.4. SWOT Analysis
- 12.1.4 Gem Systems Inc
- 12.1.4.1. Company Overview
- 12.1.4.2. Products
- 12.1.4.3. Company Financials
- 12.1.4.4. SWOT Analysis
- 12.1.5 Foerster Group
- 12.1.5.1. Company Overview
- 12.1.5.2. Products
- 12.1.5.3. Company Financials
- 12.1.5.4. SWOT Analysis
- 12.1.6 Schonstedt Instrument Company
- 12.1.6.1. Company Overview
- 12.1.6.2. Products
- 12.1.6.3. Company Financials
- 12.1.6.4. SWOT Analysis
- 12.1.7 OPEC Systems Pty Ltd
- 12.1.7.1. Company Overview
- 12.1.7.2. Products
- 12.1.7.3. Company Financials
- 12.1.7.4. SWOT Analysis
- 12.1.8 Dynasafe AB
- 12.1.8.1. Company Overview
- 12.1.8.2. Products
- 12.1.8.3. Company Financials
- 12.1.8.4. SWOT Analysis
- 12.1.9 MRS Management Limited*List Not Exhaustive
- 12.1.9.1. Company Overview
- 12.1.9.2. Products
- 12.1.9.3. Company Financials
- 12.1.9.4. SWOT Analysis
- 12.1.1 Vallon GmbH
- 12.2. Market Entropy
- 12.2.1 Company's Key Areas Served
- 12.2.2 Recent Developments
- 12.3. Company Market Share Analysis 2025
- 12.3.1 Top 5 Companies Market Share Analysis
- 12.3.2 Top 3 Companies Market Share Analysis
- 12.4. List of Potential Customers
- 13. Research Methodology
List of Figures
- Figure 1: Global UXO Detection Industry Revenue Breakdown (billion, %) by Region 2025 & 2033
- Figure 2: North America UXO Detection Industry Revenue (billion), by System Type 2025 & 2033
- Figure 3: North America UXO Detection Industry Revenue Share (%), by System Type 2025 & 2033
- Figure 4: North America UXO Detection Industry Revenue (billion), by Country 2025 & 2033
- Figure 5: North America UXO Detection Industry Revenue Share (%), by Country 2025 & 2033
- Figure 6: Europe UXO Detection Industry Revenue (billion), by System Type 2025 & 2033
- Figure 7: Europe UXO Detection Industry Revenue Share (%), by System Type 2025 & 2033
- Figure 8: Europe UXO Detection Industry Revenue (billion), by Country 2025 & 2033
- Figure 9: Europe UXO Detection Industry Revenue Share (%), by Country 2025 & 2033
- Figure 10: Asia Pacific UXO Detection Industry Revenue (billion), by System Type 2025 & 2033
- Figure 11: Asia Pacific UXO Detection Industry Revenue Share (%), by System Type 2025 & 2033
- Figure 12: Asia Pacific UXO Detection Industry Revenue (billion), by Country 2025 & 2033
- Figure 13: Asia Pacific UXO Detection Industry Revenue Share (%), by Country 2025 & 2033
- Figure 14: Latin America UXO Detection Industry Revenue (billion), by System Type 2025 & 2033
- Figure 15: Latin America UXO Detection Industry Revenue Share (%), by System Type 2025 & 2033
- Figure 16: Latin America UXO Detection Industry Revenue (billion), by Country 2025 & 2033
- Figure 17: Latin America UXO Detection Industry Revenue Share (%), by Country 2025 & 2033
- Figure 18: Middle East and Africa UXO Detection Industry Revenue (billion), by System Type 2025 & 2033
- Figure 19: Middle East and Africa UXO Detection Industry Revenue Share (%), by System Type 2025 & 2033
- Figure 20: Middle East and Africa UXO Detection Industry Revenue (billion), by Country 2025 & 2033
- Figure 21: Middle East and Africa UXO Detection Industry Revenue Share (%), by Country 2025 & 2033
List of Tables
- Table 1: Global UXO Detection Industry Revenue billion Forecast, by System Type 2020 & 2033
- Table 2: Global UXO Detection Industry Revenue billion Forecast, by Region 2020 & 2033
- Table 3: Global UXO Detection Industry Revenue billion Forecast, by System Type 2020 & 2033
- Table 4: Global UXO Detection Industry Revenue billion Forecast, by Country 2020 & 2033
- Table 5: United States UXO Detection Industry Revenue (billion) Forecast, by Application 2020 & 2033
- Table 6: Canada UXO Detection Industry Revenue (billion) Forecast, by Application 2020 & 2033
- Table 7: Global UXO Detection Industry Revenue billion Forecast, by System Type 2020 & 2033
- Table 8: Global UXO Detection Industry Revenue billion Forecast, by Country 2020 & 2033
- Table 9: Germany UXO Detection Industry Revenue (billion) Forecast, by Application 2020 & 2033
- Table 10: United Kingdom UXO Detection Industry Revenue (billion) Forecast, by Application 2020 & 2033
- Table 11: France UXO Detection Industry Revenue (billion) Forecast, by Application 2020 & 2033
- Table 12: Rest of Europe UXO Detection Industry Revenue (billion) Forecast, by Application 2020 & 2033
- Table 13: Global UXO Detection Industry Revenue billion Forecast, by System Type 2020 & 2033
- Table 14: Global UXO Detection Industry Revenue billion Forecast, by Country 2020 & 2033
- Table 15: India UXO Detection Industry Revenue (billion) Forecast, by Application 2020 & 2033
- Table 16: China UXO Detection Industry Revenue (billion) Forecast, by Application 2020 & 2033
- Table 17: Japan UXO Detection Industry Revenue (billion) Forecast, by Application 2020 & 2033
- Table 18: South Korea UXO Detection Industry Revenue (billion) Forecast, by Application 2020 & 2033
- Table 19: Rest of Asia Pacific UXO Detection Industry Revenue (billion) Forecast, by Application 2020 & 2033
- Table 20: Global UXO Detection Industry Revenue billion Forecast, by System Type 2020 & 2033
- Table 21: Global UXO Detection Industry Revenue billion Forecast, by Country 2020 & 2033
- Table 22: Mexico UXO Detection Industry Revenue (billion) Forecast, by Application 2020 & 2033
- Table 23: Brazil UXO Detection Industry Revenue (billion) Forecast, by Application 2020 & 2033
- Table 24: Rest Of Latin America UXO Detection Industry Revenue (billion) Forecast, by Application 2020 & 2033
- Table 25: Global UXO Detection Industry Revenue billion Forecast, by System Type 2020 & 2033
- Table 26: Global UXO Detection Industry Revenue billion Forecast, by Country 2020 & 2033
- Table 27: Saudi Arabia UXO Detection Industry Revenue (billion) Forecast, by Application 2020 & 2033
- Table 28: Israel UXO Detection Industry Revenue (billion) Forecast, by Application 2020 & 2033
- Table 29: Rest Of Middle East and Africa UXO Detection Industry Revenue (billion) Forecast, by Application 2020 & 2033
Frequently Asked Questions
1. What is the projected Compound Annual Growth Rate (CAGR) of the UXO Detection Industry?
The projected CAGR is approximately 14.42%.
2. Which companies are prominent players in the UXO Detection Industry?
Key companies in the market include Vallon GmbH, Seequent Limited, Defense Research And Development Organization, Gem Systems Inc, Foerster Group, Schonstedt Instrument Company, OPEC Systems Pty Ltd, Dynasafe AB, MRS Management Limited*List Not Exhaustive.
3. What are the main segments of the UXO Detection Industry?
The market segments include System Type.
4. Can you provide details about the market size?
The market size is estimated to be USD 3.15 billion as of 2022.
5. What are some drivers contributing to market growth?
N/A
6. What are the notable trends driving market growth?
Hardware Segment To Exhibit The Highest Growth Rate.
7. Are there any restraints impacting market growth?
N/A
8. Can you provide examples of recent developments in the market?
N/A
9. What pricing options are available for accessing the report?
Pricing options include single-user, multi-user, and enterprise licenses priced at USD 4750, USD 5250, and USD 8750 respectively.
10. Is the market size provided in terms of value or volume?
The market size is provided in terms of value, measured in billion.
11. Are there any specific market keywords associated with the report?
Yes, the market keyword associated with the report is "UXO Detection Industry," which aids in identifying and referencing the specific market segment covered.
12. How do I determine which pricing option suits my needs best?
The pricing options vary based on user requirements and access needs. Individual users may opt for single-user licenses, while businesses requiring broader access may choose multi-user or enterprise licenses for cost-effective access to the report.
13. Are there any additional resources or data provided in the UXO Detection Industry report?
While the report offers comprehensive insights, it's advisable to review the specific contents or supplementary materials provided to ascertain if additional resources or data are available.
14. How can I stay updated on further developments or reports in the UXO Detection Industry?
To stay informed about further developments, trends, and reports in the UXO Detection Industry, consider subscribing to industry newsletters, following relevant companies and organizations, or regularly checking reputable industry news sources and publications.
Methodology
Step 1 - Identification of Relevant Samples Size from Population Database


Step 2 - Approaches for Defining Global Market Size (Value, Volume* & Price*)

Note*: In applicable scenarios
Step 3 - Data Sources
Primary Research
- Web Analytics
- Survey Reports
- Research Institute
- Latest Research Reports
- Opinion Leaders
Secondary Research
- Annual Reports
- White Paper
- Latest Press Release
- Industry Association
- Paid Database
- Investor Presentations

Step 4 - Data Triangulation
Involves using different sources of information in order to increase the validity of a study
These sources are likely to be stakeholders in a program - participants, other researchers, program staff, other community members, and so on.
Then we put all data in single framework & apply various statistical tools to find out the dynamic on the market.
During the analysis stage, feedback from the stakeholder groups would be compared to determine areas of agreement as well as areas of divergence