

Key Insights
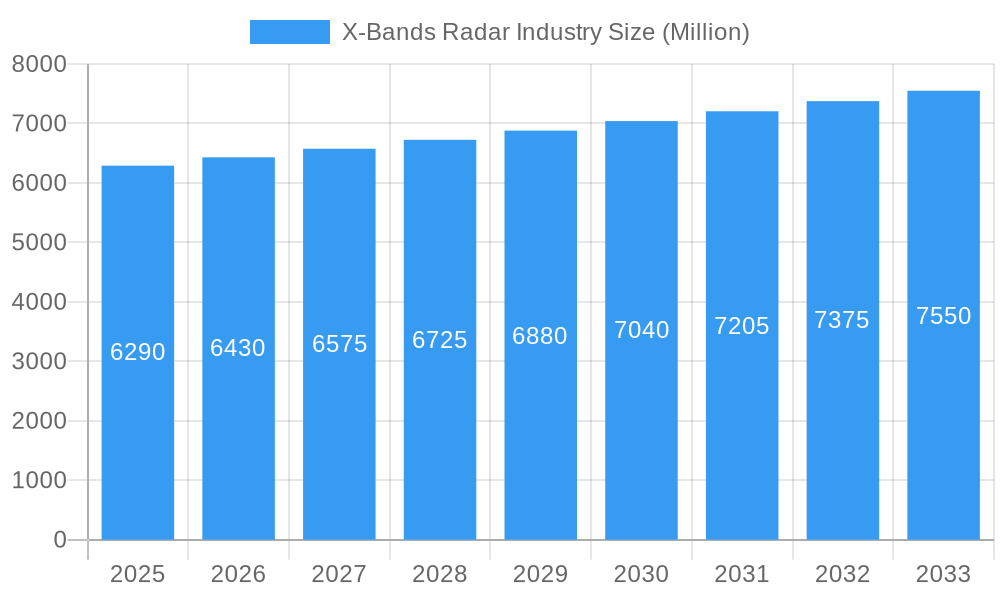
The X-Band radar market, valued at $6.29 billion in 2025, is projected to experience steady growth, driven by increasing demand for advanced surveillance and air traffic management systems. A Compound Annual Growth Rate (CAGR) of 2.26% from 2025 to 2033 indicates a continuous expansion, albeit at a moderate pace. Key drivers include the rising need for enhanced security in both civilian and military applications, necessitating sophisticated radar technologies for threat detection and situational awareness. Furthermore, technological advancements like improved signal processing, miniaturization, and the integration of AI/ML algorithms are fueling market growth. The market is segmented by platform, encompassing airborne, terrestrial, and naval applications, each exhibiting unique growth trajectories based on specific technological requirements and deployment strategies. While the airborne segment is expected to dominate due to its widespread use in aviation and defense, the terrestrial and naval segments are anticipated to witness substantial growth driven by investments in infrastructure modernization and maritime security. Geographical distribution reveals strong market presence in North America and Europe, primarily due to significant investments in defense and advanced technologies. However, the Asia-Pacific region is emerging as a key growth area, fueled by rapid economic development and increasing adoption of radar technologies across various sectors. Competitive landscape analysis reveals the presence of several key players including Thales, Vaisala, IAI, RTX Corporation, and others, constantly innovating to enhance product capabilities and market share.
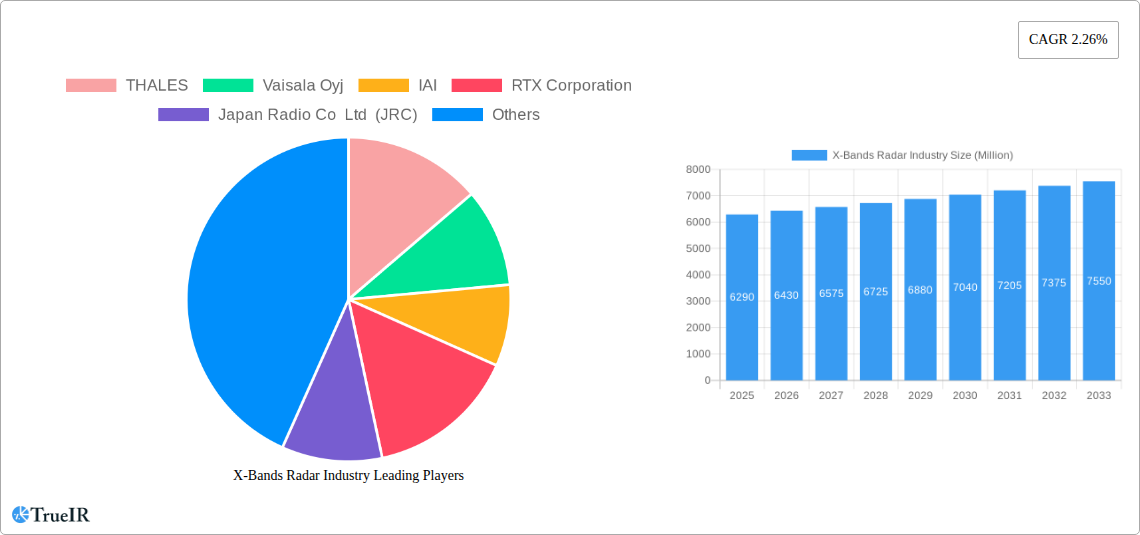
X-Bands Radar Industry Market Size (In Billion)
The relatively modest CAGR reflects a mature market, but ongoing technological advancements and increasing geopolitical concerns suggest sustained, albeit measured, growth. The diverse applications of X-Band radar across various sectors, from weather forecasting and air traffic control to defense and security, contribute to market resilience. Future growth will depend on factors such as government defense budgets, advancements in radar technology, and the emergence of new applications in areas such as autonomous vehicles and smart infrastructure. Strategic partnerships, mergers, and acquisitions are anticipated as companies strive to enhance their market positions and technological offerings. Continuous research and development efforts focused on improving radar performance, reducing costs, and enhancing integration capabilities will be crucial for market expansion in the coming years.
X-Bands Radar Industry Company Market Share
X-Bands Radar Industry Market Report: 2019-2033 Forecast
This comprehensive report provides a detailed analysis of the X-Bands Radar industry, offering invaluable insights for businesses, investors, and policymakers. The study covers the period 2019-2033, with a focus on the 2025-2033 forecast period. The report leverages extensive market research and data analysis to provide a clear understanding of market dynamics, competitive landscapes, and future growth potential. The global X-Bands Radar market is projected to reach xx Million by 2033, exhibiting a CAGR of xx% during the forecast period.
X-Bands Radar Industry Market Structure & Competitive Landscape
The X-Bands Radar market exhibits a moderately concentrated structure, with key players holding significant market shares. The Herfindahl-Hirschman Index (HHI) is estimated at xx in 2025, indicating a moderately competitive landscape. Innovation is a crucial driver, with companies continuously investing in advanced technologies like AESA (Active Electronically Scanned Array) and MIMO (Multiple-Input and Multiple-Output) radar systems to enhance performance and capabilities. Regulatory frameworks, particularly those concerning airspace management and defense applications, significantly impact market growth. Product substitutes, such as lidar and other sensor technologies, pose a competitive threat, although X-band radar continues to dominate due to its established performance and reliability in various applications.
End-user segmentation primarily includes the defense, aerospace, and maritime sectors, with the defense sector accounting for the largest share of revenue. M&A activity has been moderate in recent years, with xx Million in total deal value recorded between 2019 and 2024. Key M&A trends include vertical integration to secure supply chains and expansion into new geographical markets.
- Market Concentration: Moderately concentrated, HHI estimated at xx in 2025.
- Innovation Drivers: AESA, MIMO technologies, improved signal processing.
- Regulatory Impacts: Stringent regulations on airspace management and defense applications.
- Product Substitutes: Lidar, other sensor technologies.
- End-User Segmentation: Defense (largest share), aerospace, maritime.
- M&A Trends: Vertical integration, geographic expansion, total deal value of xx Million (2019-2024).
X-Bands Radar Industry Market Trends & Opportunities
The X-Bands Radar market is witnessing significant growth driven by increasing demand from the defense and security sectors, coupled with advancements in technology. The market size is estimated at xx Million in 2025, projected to reach xx Million by 2033, with a robust CAGR of xx%. Technological advancements such as miniaturization, improved signal processing, and the integration of AI/ML capabilities are enhancing the performance and functionalities of X-band radar systems, opening new application areas. Consumer preference is shifting towards higher precision, lower power consumption, and cost-effective solutions. Competitive dynamics are characterized by intense rivalry among established players and emerging companies focusing on niche applications. The market penetration rate is estimated to be xx% in 2025, with considerable potential for growth in developing economies.
Dominant Markets & Segments in X-Bands Radar Industry
The airborne segment currently dominates the X-bands radar market, driven by increasing demand for advanced surveillance and air traffic management systems. The North American region holds the largest market share due to substantial defense spending and technological advancements.
Key Growth Drivers:
- Airborne: Increased demand for advanced surveillance systems, air traffic control modernization, and military applications.
- Terrestrial: Growth in infrastructure development, particularly in smart cities and transportation systems, requiring advanced monitoring and security solutions.
- Naval: Increasing naval modernization programs globally, focusing on enhancing maritime security and surveillance capabilities.
Market Dominance Analysis:
The airborne segment's dominance is attributed to the high demand for sophisticated radar systems in both military and civilian aviation. North America’s leading position stems from the significant investment in defense and aerospace technologies, along with well-established manufacturing capabilities. Technological advancements and government initiatives are boosting the market growth in these segments and regions. The integration of X-band radar into unmanned aerial vehicles (UAVs) is also driving market expansion.
X-Bands Radar Industry Product Analysis
The X-Bands radar market offers a variety of products, ranging from traditional pulsed Doppler radars to advanced AESA and MIMO systems. These systems find applications in air traffic control, weather forecasting, military surveillance, and various industrial applications. Recent technological advancements have led to more compact, efficient, and cost-effective radar systems, expanding their market reach. The integration of AI and ML algorithms further enhances their capabilities, providing advanced signal processing and target recognition. Key competitive advantages include superior range, accuracy, and resolution, along with improved reliability and maintainability.
Key Drivers, Barriers & Challenges in X-Bands Radar Industry
Key Drivers:
Technological advancements like AESA and MIMO are significantly boosting market growth, enabling higher resolution and more accurate target detection. Increasing government investments in defense and security infrastructure, particularly in advanced surveillance systems, create significant demand. Stricter regulations for air traffic management are driving the adoption of more sophisticated radar systems.
Key Barriers and Challenges:
Supply chain disruptions due to geopolitical factors and the pandemic have impacted production and delivery timelines, leading to increased costs. Complex regulatory approvals and compliance requirements can hinder market entry for new players. Intense competition from established players and the emergence of substitute technologies pose significant challenges. The high cost of advanced X-band radar systems can limit their adoption in certain applications. Estimated impact on market growth due to these challenges: xx% reduction in projected growth by 2033.
Growth Drivers in the X-Bands Radar Industry Market
Technological advancements in AESA, MIMO, and signal processing are key growth drivers, enhancing radar performance and capabilities. Increased investments in defense and security globally fuel demand, particularly for advanced surveillance and air traffic control systems. Stringent regulations necessitate upgrades to existing infrastructure, driving the adoption of newer, more advanced X-band radar technology.
Challenges Impacting X-Bands Radar Industry Growth
Regulatory complexities and lengthy approval processes hinder market expansion. Supply chain vulnerabilities and disruptions significantly impact production costs and delivery times. Intense competition among established players and the emergence of substitute technologies like lidar constrain market growth.
Key Players Shaping the X-Bands Radar Industry Market
Significant X-Bands Radar Industry Industry Milestones
- 2020-Q4: THALES launched its new AESA X-band radar system for airborne applications.
- 2021-Q2: RTX Corporation acquired a smaller X-band radar manufacturer, expanding its product portfolio.
- 2022-Q3: Significant investments announced by multiple governments in upgrading national air traffic control systems.
- 2023-Q1: Introduction of several new MIMO X-band radar systems featuring advanced signal processing capabilities.
Future Outlook for X-Bands Radar Industry Market
The X-Bands radar market is poised for substantial growth driven by technological advancements, increasing demand for advanced surveillance and air traffic control systems, and strong government support for modernization programs. Strategic opportunities exist in developing advanced radar systems with AI/ML capabilities, expanding into new markets, and pursuing strategic partnerships to enhance technological capabilities and reach. The market’s potential is vast, promising considerable returns for companies that can innovate and adapt to evolving market dynamics.
X-Bands Radar Industry Segmentation
-
1. Platform
- 1.1. Airborne
- 1.2. Terrestrial
- 1.3. Naval
X-Bands Radar Industry Segmentation By Geography
-
1. North America
- 1.1. United States
- 1.2. Canada
-
2. Europe
- 2.1. United Kingdom
- 2.2. France
- 2.3. Germany
- 2.4. Russia
- 2.5. Rest of Europe
-
3. Asia Pacific
- 3.1. China
- 3.2. India
- 3.3. Japan
- 3.4. South Korea
- 3.5. Rest of Asia Pacific
-
4. Latin America
- 4.1. Brazil
- 4.2. Mexico
- 4.3. Rest of Latin America
- 5. Middle East
-
6. Saudi Arabia
- 6.1. United Arab Emirates
- 6.2. Qatar
- 6.3. South Africa
- 6.4. Rest of Middle East and Africa
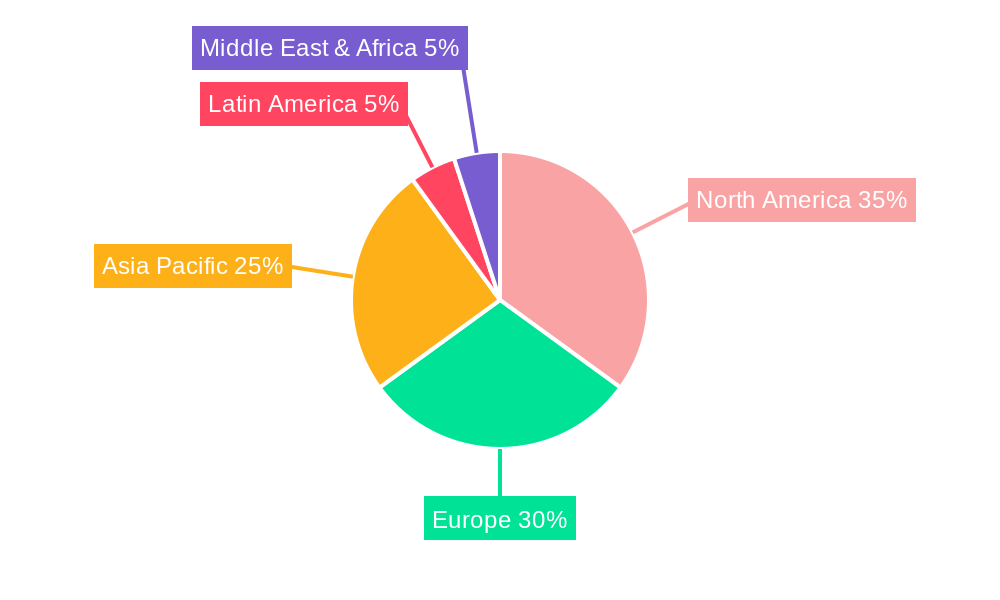
X-Bands Radar Industry Regional Market Share
Geographic Coverage of X-Bands Radar Industry
X-Bands Radar Industry REPORT HIGHLIGHTS
| Aspects | Details |
|---|---|
| Study Period | 2020-2034 |
| Base Year | 2025 |
| Estimated Year | 2026 |
| Forecast Period | 2026-2034 |
| Historical Period | 2020-2025 |
| Growth Rate | CAGR of 2.26% from 2020-2034 |
| Segmentation |
|
Table of Contents
- 1. Introduction
- 1.1. Research Scope
- 1.2. Market Segmentation
- 1.3. Research Objective
- 1.4. Definitions and Assumptions
- 2. Executive Summary
- 2.1. Market Snapshot
- 3. Market Dynamics
- 3.1. Market Drivers
- 3.2. Market Restrains
- 3.3. Market Trends
- 3.4. Market Opportunities
- 4. Market Factor Analysis
- 4.1. Porters Five Forces
- 4.1.1. Bargaining Power of Suppliers
- 4.1.2. Bargaining Power of Buyers
- 4.1.3. Threat of New Entrants
- 4.1.4. Threat of Substitutes
- 4.1.5. Competitive Rivalry
- 4.2. PESTEL analysis
- 4.3. BCG Analysis
- 4.3.1. Stars (High Growth, High Market Share)
- 4.3.2. Cash Cows (Low Growth, High Market Share)
- 4.3.3. Question Mark (High Growth, Low Market Share)
- 4.3.4. Dogs (Low Growth, Low Market Share)
- 4.4. Ansoff Matrix Analysis
- 4.5. Supply Chain Analysis
- 4.6. Regulatory Landscape
- 4.7. Current Market Potential and Opportunity Assessment (TAM–SAM–SOM Framework)
- 4.8. TIR Analyst Note
- 4.1. Porters Five Forces
- 5. Market Analysis, Insights and Forecast 2021-2033
- 5.1. Market Analysis, Insights and Forecast - by Platform
- 5.1.1. Airborne
- 5.1.2. Terrestrial
- 5.1.3. Naval
- 5.2. Market Analysis, Insights and Forecast - by Region
- 5.2.1. North America
- 5.2.2. Europe
- 5.2.3. Asia Pacific
- 5.2.4. Latin America
- 5.2.5. Middle East
- 5.2.6. Saudi Arabia
- 5.1. Market Analysis, Insights and Forecast - by Platform
- 6. Global X-Bands Radar Industry Analysis, Insights and Forecast, 2021-2033
- 6.1. Market Analysis, Insights and Forecast - by Platform
- 6.1.1. Airborne
- 6.1.2. Terrestrial
- 6.1.3. Naval
- 6.1. Market Analysis, Insights and Forecast - by Platform
- 7. North America X-Bands Radar Industry Analysis, Insights and Forecast, 2020-2032
- 7.1. Market Analysis, Insights and Forecast - by Platform
- 7.1.1. Airborne
- 7.1.2. Terrestrial
- 7.1.3. Naval
- 7.1. Market Analysis, Insights and Forecast - by Platform
- 8. Europe X-Bands Radar Industry Analysis, Insights and Forecast, 2020-2032
- 8.1. Market Analysis, Insights and Forecast - by Platform
- 8.1.1. Airborne
- 8.1.2. Terrestrial
- 8.1.3. Naval
- 8.1. Market Analysis, Insights and Forecast - by Platform
- 9. Asia Pacific X-Bands Radar Industry Analysis, Insights and Forecast, 2020-2032
- 9.1. Market Analysis, Insights and Forecast - by Platform
- 9.1.1. Airborne
- 9.1.2. Terrestrial
- 9.1.3. Naval
- 9.1. Market Analysis, Insights and Forecast - by Platform
- 10. Latin America X-Bands Radar Industry Analysis, Insights and Forecast, 2020-2032
- 10.1. Market Analysis, Insights and Forecast - by Platform
- 10.1.1. Airborne
- 10.1.2. Terrestrial
- 10.1.3. Naval
- 10.1. Market Analysis, Insights and Forecast - by Platform
- 11. Middle East X-Bands Radar Industry Analysis, Insights and Forecast, 2020-2032
- 11.1. Market Analysis, Insights and Forecast - by Platform
- 11.1.1. Airborne
- 11.1.2. Terrestrial
- 11.1.3. Naval
- 11.1. Market Analysis, Insights and Forecast - by Platform
- 12. Saudi Arabia X-Bands Radar Industry Analysis, Insights and Forecast, 2020-2032
- 12.1. Market Analysis, Insights and Forecast - by Platform
- 12.1.1. Airborne
- 12.1.2. Terrestrial
- 12.1.3. Naval
- 12.1. Market Analysis, Insights and Forecast - by Platform
- 13. Competitive Analysis
- 13.1. Company Profiles
- 13.1.1 THALES
- 13.1.1.1. Company Overview
- 13.1.1.2. Products
- 13.1.1.3. Company Financials
- 13.1.1.4. SWOT Analysis
- 13.1.2 Vaisala Oyj
- 13.1.2.1. Company Overview
- 13.1.2.2. Products
- 13.1.2.3. Company Financials
- 13.1.2.4. SWOT Analysis
- 13.1.3 IAI
- 13.1.3.1. Company Overview
- 13.1.3.2. Products
- 13.1.3.3. Company Financials
- 13.1.3.4. SWOT Analysis
- 13.1.4 RTX Corporation
- 13.1.4.1. Company Overview
- 13.1.4.2. Products
- 13.1.4.3. Company Financials
- 13.1.4.4. SWOT Analysis
- 13.1.5 Japan Radio Co Ltd (JRC)
- 13.1.5.1. Company Overview
- 13.1.5.2. Products
- 13.1.5.3. Company Financials
- 13.1.5.4. SWOT Analysis
- 13.1.6 Terma Group
- 13.1.6.1. Company Overview
- 13.1.6.2. Products
- 13.1.6.3. Company Financials
- 13.1.6.4. SWOT Analysis
- 13.1.7 HENSOLDT AG
- 13.1.7.1. Company Overview
- 13.1.7.2. Products
- 13.1.7.3. Company Financials
- 13.1.7.4. SWOT Analysis
- 13.1.8 Leonardo S p A
- 13.1.8.1. Company Overview
- 13.1.8.2. Products
- 13.1.8.3. Company Financials
- 13.1.8.4. SWOT Analysis
- 13.1.9 FURUNO ELECTRIC CO LTD
- 13.1.9.1. Company Overview
- 13.1.9.2. Products
- 13.1.9.3. Company Financials
- 13.1.9.4. SWOT Analysis
- 13.1.10 Indra Sistemas S
- 13.1.10.1. Company Overview
- 13.1.10.2. Products
- 13.1.10.3. Company Financials
- 13.1.10.4. SWOT Analysis
- 13.1.11 Reutech Radar Systems
- 13.1.11.1. Company Overview
- 13.1.11.2. Products
- 13.1.11.3. Company Financials
- 13.1.11.4. SWOT Analysis
- 13.1.12 Northrop Grumman Corporation
- 13.1.12.1. Company Overview
- 13.1.12.2. Products
- 13.1.12.3. Company Financials
- 13.1.12.4. SWOT Analysis
- 13.1.13 Saab AB
- 13.1.13.1. Company Overview
- 13.1.13.2. Products
- 13.1.13.3. Company Financials
- 13.1.13.4. SWOT Analysis
- 13.1.1 THALES
- 13.2. Market Entropy
- 13.2.1 Company's Key Areas Served
- 13.2.2 Recent Developments
- 13.3. Company Market Share Analysis 2025
- 13.3.1 Top 5 Companies Market Share Analysis
- 13.3.2 Top 3 Companies Market Share Analysis
- 13.4. List of Potential Customers
- 14. Research Methodology
List of Figures
- Figure 1: Global X-Bands Radar Industry Revenue Breakdown (Million, %) by Region 2025 & 2033
- Figure 2: North America X-Bands Radar Industry Revenue (Million), by Platform 2025 & 2033
- Figure 3: North America X-Bands Radar Industry Revenue Share (%), by Platform 2025 & 2033
- Figure 4: North America X-Bands Radar Industry Revenue (Million), by Country 2025 & 2033
- Figure 5: North America X-Bands Radar Industry Revenue Share (%), by Country 2025 & 2033
- Figure 6: Europe X-Bands Radar Industry Revenue (Million), by Platform 2025 & 2033
- Figure 7: Europe X-Bands Radar Industry Revenue Share (%), by Platform 2025 & 2033
- Figure 8: Europe X-Bands Radar Industry Revenue (Million), by Country 2025 & 2033
- Figure 9: Europe X-Bands Radar Industry Revenue Share (%), by Country 2025 & 2033
- Figure 10: Asia Pacific X-Bands Radar Industry Revenue (Million), by Platform 2025 & 2033
- Figure 11: Asia Pacific X-Bands Radar Industry Revenue Share (%), by Platform 2025 & 2033
- Figure 12: Asia Pacific X-Bands Radar Industry Revenue (Million), by Country 2025 & 2033
- Figure 13: Asia Pacific X-Bands Radar Industry Revenue Share (%), by Country 2025 & 2033
- Figure 14: Latin America X-Bands Radar Industry Revenue (Million), by Platform 2025 & 2033
- Figure 15: Latin America X-Bands Radar Industry Revenue Share (%), by Platform 2025 & 2033
- Figure 16: Latin America X-Bands Radar Industry Revenue (Million), by Country 2025 & 2033
- Figure 17: Latin America X-Bands Radar Industry Revenue Share (%), by Country 2025 & 2033
- Figure 18: Middle East X-Bands Radar Industry Revenue (Million), by Platform 2025 & 2033
- Figure 19: Middle East X-Bands Radar Industry Revenue Share (%), by Platform 2025 & 2033
- Figure 20: Middle East X-Bands Radar Industry Revenue (Million), by Country 2025 & 2033
- Figure 21: Middle East X-Bands Radar Industry Revenue Share (%), by Country 2025 & 2033
- Figure 22: Saudi Arabia X-Bands Radar Industry Revenue (Million), by Platform 2025 & 2033
- Figure 23: Saudi Arabia X-Bands Radar Industry Revenue Share (%), by Platform 2025 & 2033
- Figure 24: Saudi Arabia X-Bands Radar Industry Revenue (Million), by Country 2025 & 2033
- Figure 25: Saudi Arabia X-Bands Radar Industry Revenue Share (%), by Country 2025 & 2033
List of Tables
- Table 1: Global X-Bands Radar Industry Revenue Million Forecast, by Platform 2020 & 2033
- Table 2: Global X-Bands Radar Industry Revenue Million Forecast, by Region 2020 & 2033
- Table 3: Global X-Bands Radar Industry Revenue Million Forecast, by Platform 2020 & 2033
- Table 4: Global X-Bands Radar Industry Revenue Million Forecast, by Country 2020 & 2033
- Table 5: United States X-Bands Radar Industry Revenue (Million) Forecast, by Application 2020 & 2033
- Table 6: Canada X-Bands Radar Industry Revenue (Million) Forecast, by Application 2020 & 2033
- Table 7: Global X-Bands Radar Industry Revenue Million Forecast, by Platform 2020 & 2033
- Table 8: Global X-Bands Radar Industry Revenue Million Forecast, by Country 2020 & 2033
- Table 9: United Kingdom X-Bands Radar Industry Revenue (Million) Forecast, by Application 2020 & 2033
- Table 10: France X-Bands Radar Industry Revenue (Million) Forecast, by Application 2020 & 2033
- Table 11: Germany X-Bands Radar Industry Revenue (Million) Forecast, by Application 2020 & 2033
- Table 12: Russia X-Bands Radar Industry Revenue (Million) Forecast, by Application 2020 & 2033
- Table 13: Rest of Europe X-Bands Radar Industry Revenue (Million) Forecast, by Application 2020 & 2033
- Table 14: Global X-Bands Radar Industry Revenue Million Forecast, by Platform 2020 & 2033
- Table 15: Global X-Bands Radar Industry Revenue Million Forecast, by Country 2020 & 2033
- Table 16: China X-Bands Radar Industry Revenue (Million) Forecast, by Application 2020 & 2033
- Table 17: India X-Bands Radar Industry Revenue (Million) Forecast, by Application 2020 & 2033
- Table 18: Japan X-Bands Radar Industry Revenue (Million) Forecast, by Application 2020 & 2033
- Table 19: South Korea X-Bands Radar Industry Revenue (Million) Forecast, by Application 2020 & 2033
- Table 20: Rest of Asia Pacific X-Bands Radar Industry Revenue (Million) Forecast, by Application 2020 & 2033
- Table 21: Global X-Bands Radar Industry Revenue Million Forecast, by Platform 2020 & 2033
- Table 22: Global X-Bands Radar Industry Revenue Million Forecast, by Country 2020 & 2033
- Table 23: Brazil X-Bands Radar Industry Revenue (Million) Forecast, by Application 2020 & 2033
- Table 24: Mexico X-Bands Radar Industry Revenue (Million) Forecast, by Application 2020 & 2033
- Table 25: Rest of Latin America X-Bands Radar Industry Revenue (Million) Forecast, by Application 2020 & 2033
- Table 26: Global X-Bands Radar Industry Revenue Million Forecast, by Platform 2020 & 2033
- Table 27: Global X-Bands Radar Industry Revenue Million Forecast, by Country 2020 & 2033
- Table 28: Global X-Bands Radar Industry Revenue Million Forecast, by Platform 2020 & 2033
- Table 29: Global X-Bands Radar Industry Revenue Million Forecast, by Country 2020 & 2033
- Table 30: United Arab Emirates X-Bands Radar Industry Revenue (Million) Forecast, by Application 2020 & 2033
- Table 31: Qatar X-Bands Radar Industry Revenue (Million) Forecast, by Application 2020 & 2033
- Table 32: South Africa X-Bands Radar Industry Revenue (Million) Forecast, by Application 2020 & 2033
- Table 33: Rest of Middle East and Africa X-Bands Radar Industry Revenue (Million) Forecast, by Application 2020 & 2033
Frequently Asked Questions
1. What is the projected Compound Annual Growth Rate (CAGR) of the X-Bands Radar Industry?
The projected CAGR is approximately 2.26%.
2. Which companies are prominent players in the X-Bands Radar Industry?
Key companies in the market include THALES, Vaisala Oyj, IAI, RTX Corporation, Japan Radio Co Ltd (JRC), Terma Group, HENSOLDT AG, Leonardo S p A, FURUNO ELECTRIC CO LTD, Indra Sistemas S, Reutech Radar Systems, Northrop Grumman Corporation, Saab AB.
3. What are the main segments of the X-Bands Radar Industry?
The market segments include Platform.
4. Can you provide details about the market size?
The market size is estimated to be USD 6.29 Million as of 2022.
5. What are some drivers contributing to market growth?
Increase in Internet of Things (IoT) and Autonomous Systems; Rise in Demand for Military and Defense Satellite Communication Solutions.
6. What are the notable trends driving market growth?
Terrestrial Platform to Dominate Market Share During the Forecast Period.
7. Are there any restraints impacting market growth?
Cybersecurity Threats to Satellite Communication; Interference in Transmission of Data.
8. Can you provide examples of recent developments in the market?
N/A
9. What pricing options are available for accessing the report?
Pricing options include single-user, multi-user, and enterprise licenses priced at USD 4750, USD 5250, and USD 8750 respectively.
10. Is the market size provided in terms of value or volume?
The market size is provided in terms of value, measured in Million.
11. Are there any specific market keywords associated with the report?
Yes, the market keyword associated with the report is "X-Bands Radar Industry," which aids in identifying and referencing the specific market segment covered.
12. How do I determine which pricing option suits my needs best?
The pricing options vary based on user requirements and access needs. Individual users may opt for single-user licenses, while businesses requiring broader access may choose multi-user or enterprise licenses for cost-effective access to the report.
13. Are there any additional resources or data provided in the X-Bands Radar Industry report?
While the report offers comprehensive insights, it's advisable to review the specific contents or supplementary materials provided to ascertain if additional resources or data are available.
14. How can I stay updated on further developments or reports in the X-Bands Radar Industry?
To stay informed about further developments, trends, and reports in the X-Bands Radar Industry, consider subscribing to industry newsletters, following relevant companies and organizations, or regularly checking reputable industry news sources and publications.
Methodology
Step 1 - Identification of Relevant Samples Size from Population Database


Step 2 - Approaches for Defining Global Market Size (Value, Volume* & Price*)

Note*: In applicable scenarios
Step 3 - Data Sources
Primary Research
- Web Analytics
- Survey Reports
- Research Institute
- Latest Research Reports
- Opinion Leaders
Secondary Research
- Annual Reports
- White Paper
- Latest Press Release
- Industry Association
- Paid Database
- Investor Presentations

Step 4 - Data Triangulation
Involves using different sources of information in order to increase the validity of a study
These sources are likely to be stakeholders in a program - participants, other researchers, program staff, other community members, and so on.
Then we put all data in single framework & apply various statistical tools to find out the dynamic on the market.
During the analysis stage, feedback from the stakeholder groups would be compared to determine areas of agreement as well as areas of divergence