

Key Insights
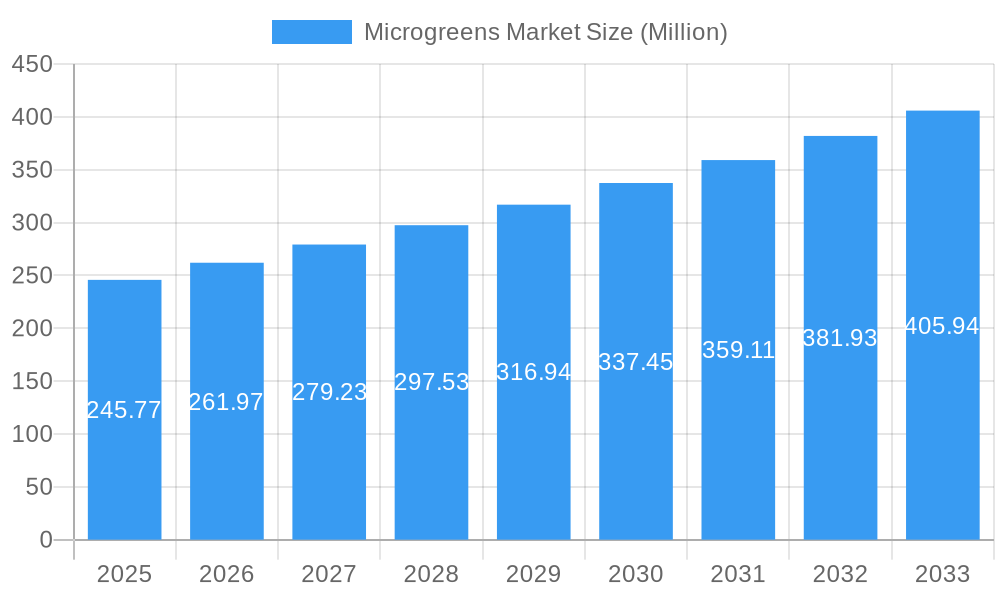
The global microgreens market, valued at $245.77 million in 2025, is projected to experience robust growth, exhibiting a Compound Annual Growth Rate (CAGR) of 6.40% from 2025 to 2033. This expansion is fueled by several key drivers. Increasing consumer awareness of the nutritional benefits of microgreens, their versatility in culinary applications, and the growing popularity of healthy eating habits are significant factors. Furthermore, the rise of indoor and vertical farming techniques offers efficient and sustainable production methods, contributing to market growth. The burgeoning food service industry, particularly restaurants and cafes emphasizing fresh, locally-sourced ingredients, significantly boosts demand. While challenges like fluctuating input costs and competition from traditional leafy greens exist, the market's positive trajectory is reinforced by expanding distribution channels and the introduction of innovative microgreen varieties. The segment of indoor and vertical farming is expected to witness above average growth due to its ability to offer year-round production and reduce reliance on land and climate dependent cultivation. Specific types like broccoli, lettuce and chicory, along with arugula and basil, are anticipated to lead in market share owing to established consumer preferences and established supply chains.
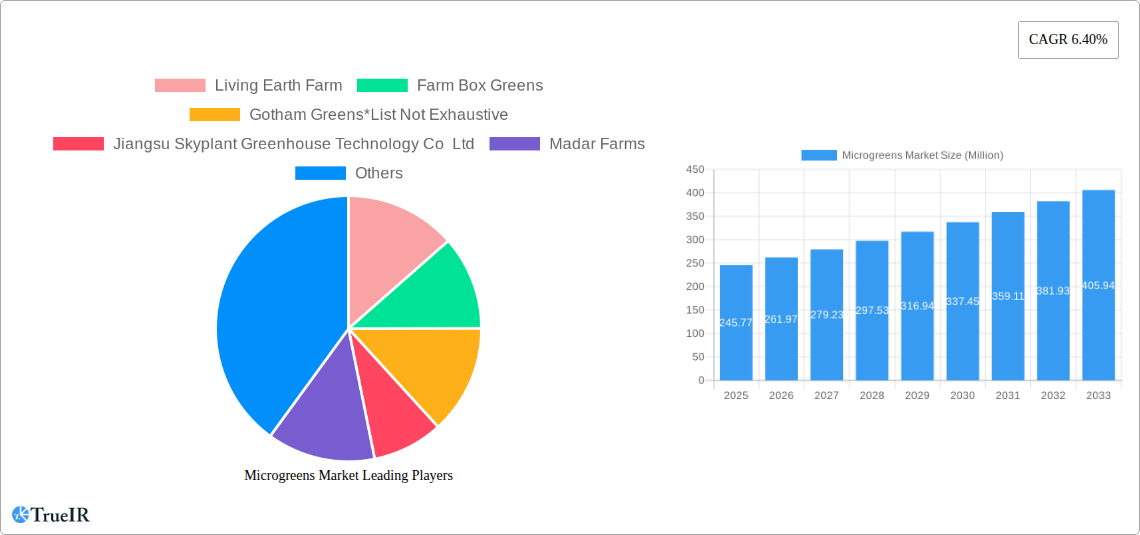
Microgreens Market Market Size (In Million)
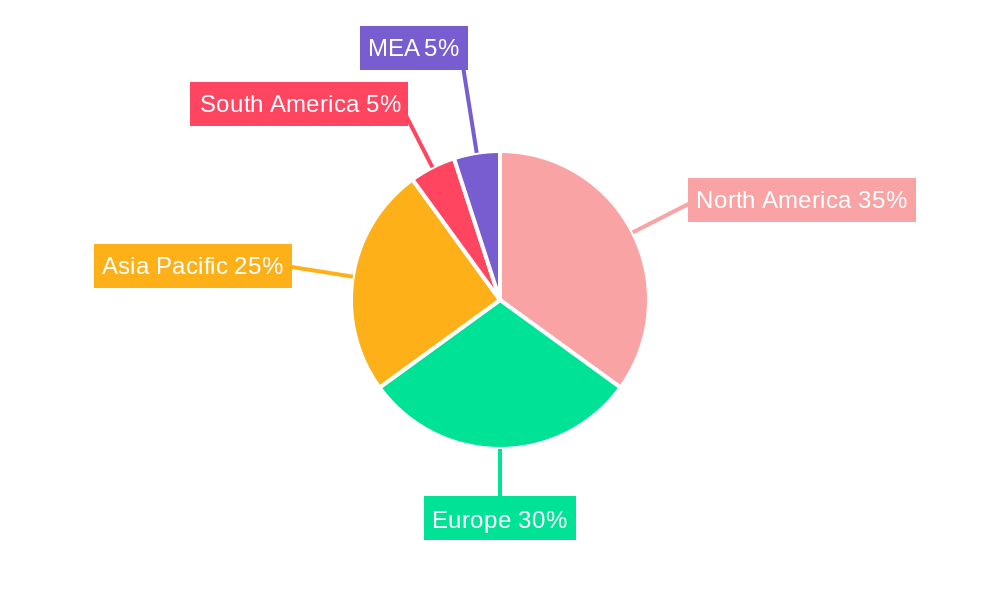
The market's geographical distribution reveals strong performance in North America and Europe, driven by high consumer disposable incomes and established markets for specialty produce. However, Asia-Pacific presents a significant growth opportunity given the region's burgeoning population, increasing health consciousness, and expanding middle class. Key players in the market are focusing on strategic partnerships, product diversification, and technological advancements to enhance market penetration and capture greater market share. The market is expected to see further fragmentation as smaller, niche producers emerge, emphasizing unique varieties or sustainable farming practices. While peat moss remains a common growth medium, the adoption of sustainable alternatives like coconut coir is anticipated to increase, mirroring broader trends in environmentally conscious consumerism. The forecast period (2025-2033) promises substantial growth, making the microgreens market an attractive sector for investment and innovation.
Microgreens Market Company Market Share
Dynamic Microgreens Market Report: 2019-2033
This comprehensive report provides an in-depth analysis of the global microgreens market, projecting robust growth from 2025 to 2033. Leveraging extensive market research and data analysis covering the period 2019-2024 (historical period), with 2025 as the base year and estimated year, this report offers invaluable insights for businesses and investors navigating this dynamic sector. The forecast period extends to 2033, providing a long-term perspective on market trajectory. The global microgreens market is valued at xx Million in 2025 and is expected to reach xx Million by 2033, exhibiting a CAGR of xx% during the forecast period.
Microgreens Market Structure & Competitive Landscape
The microgreens market exhibits a moderately fragmented structure, with numerous players competing across various segments. Market concentration is relatively low, with a Herfindahl-Hirschman Index (HHI) estimated at xx. However, larger companies like AeroFarms LLC and Goodleaf Farms are increasingly consolidating market share through strategic partnerships and technological advancements. Innovation is a key driver, with companies constantly exploring new farming techniques, product varieties, and distribution channels. Regulatory frameworks related to food safety and sustainable agriculture significantly influence market practices. Product substitutes, such as conventional leafy greens, exert competitive pressure, necessitating continuous product differentiation. The market is segmented by distribution channel (hypermarkets/supermarkets, restaurants, other channels), type (broccoli, lettuce & chicory, arugula, basil, fennel, carrots, sunflower, radish, peas, other types), farming method (indoor farming, vertical farming, commercial greenhouses, other methods), and growth medium (peat moss, soil, coconut coir, tissue paper, other mediums). M&A activity is relatively low currently, at an estimated xx deals per year, but is expected to increase as larger players seek to expand their market reach and product portfolios.
- Market Concentration: Low, with a HHI of xx
- Innovation Drivers: Technological advancements in farming techniques and product diversification.
- Regulatory Impacts: Food safety regulations and sustainable agriculture policies.
- Product Substitutes: Conventional leafy greens.
- End-User Segmentation: Hypermarkets/supermarkets, restaurants, food service, and direct-to-consumer.
- M&A Trends: Low current activity, but projected increase in the coming years.
Microgreens Market Trends & Opportunities
The global microgreens market is experiencing significant growth fueled by several key factors. The increasing consumer demand for healthy, nutritious food is a primary driver, with microgreens perceived as a highly nutritious and convenient option. The rising popularity of plant-based diets and the growing awareness of the health benefits associated with microgreens are further boosting market growth. Technological advancements, such as vertical farming and indoor agriculture, are improving production efficiency and year-round availability. This has led to a substantial increase in microgreens production, resulting in wider market penetration. The market is also witnessing the emergence of new product varieties, expanding consumer choices and market appeal. Competition is intensifying, with companies focusing on product differentiation, superior quality, and innovative packaging to gain a competitive edge. The market is witnessing a shift towards sustainable and eco-friendly farming practices, which aligns with the growing consumer preference for environmentally conscious products. The market penetration rate is currently at xx% and is projected to increase to xx% by 2033.
Dominant Markets & Segments in Microgreens Market
The North American market currently holds a dominant position, driven by high consumer awareness of health benefits and significant investments in advanced farming technologies. Europe follows as a significant market, with increasing adoption in restaurants and supermarkets. Within segments, indoor farming is witnessing rapid growth due to its ability to control environmental factors and increase production efficiency. Vertical farming is becoming increasingly popular as land availability decreases and urban farming initiatives expand. Among types, broccoli, lettuce, and chicory remain the dominant segments due to high consumer demand and established supply chains. Hypermarkets/supermarkets comprise the largest distribution channel, driven by the growing availability of microgreens in major grocery stores.
- Key Growth Drivers (North America): High consumer demand, technological advancements, and investments in advanced farming systems.
- Key Growth Drivers (Europe): Increasing adoption in restaurants and supermarkets and growing consumer interest in healthy food options.
- Dominant Farming Method: Indoor and vertical farming, due to controlled environments and efficient production.
- Dominant Types: Broccoli, lettuce and chicory, due to high consumer demand and established supply chains.
- Dominant Distribution Channel: Hypermarkets/supermarkets, due to increasing availability.
Microgreens Market Product Analysis
Microgreens product innovation is focused on expanding variety, improving shelf life, and enhancing nutritional content. Companies are developing new cultivars to cater to specific consumer preferences, such as unique flavors and textures. Technological advancements, such as precision fertigation and LED lighting, enhance product quality and yields. The competitive advantage often lies in superior flavor profiles, longer shelf life, and unique packaging to maintain freshness and quality. Market fit is achieved through product diversification, aligning with consumer demands for organic, sustainable, and ethically sourced microgreens.
Key Drivers, Barriers & Challenges in Microgreens Market
Key Drivers: The primary forces driving market growth include increasing consumer awareness of health benefits, technological advancements in farming techniques (like vertical and indoor farming), growing demand for organic and sustainably produced food, and expansion of distribution channels. The rising popularity of plant-based diets is also a significant factor.
Challenges: Key challenges include managing supply chain complexities, especially related to maintaining freshness and minimizing spoilage. Strict food safety regulations and potential regulatory hurdles in different markets pose significant challenges. Intense competition necessitates continuous innovation and effective marketing strategies. The relatively high cost of production compared to conventional leafy greens can limit market penetration, particularly in price-sensitive markets. This translates to a xx% increase in production costs in the last 5 years.
Growth Drivers in the Microgreens Market
The primary drivers for growth in the microgreens market are the increasing consumer demand for healthy and nutritious food options, technological innovations in farming practices such as vertical farming and indoor agriculture, and the expansion of distribution channels into major supermarkets and restaurants. Furthermore, the growing awareness of the environmental benefits of sustainable farming practices and the popularity of plant-based diets are significant contributing factors.
Challenges Impacting Microgreens Market Growth
Challenges impacting market growth include maintaining the freshness and quality of microgreens throughout the supply chain, managing the high production costs associated with advanced farming technologies, navigating stringent food safety regulations, and overcoming the competitive pressure from established players in the leafy greens market. These factors lead to price volatility and affect market penetration in price-sensitive segments.
Key Players Shaping the Microgreens Market Market
- Living Earth Farm
- Farm Box Greens
- Gotham Greens
- Jiangsu Skyplant Greenhouse Technology Co Ltd
- Madar Farms
- Chef's Garden Inc
- Shanghai Dehuan Industry Co Ltd
- Metro Microgreens
- Goodleaf Farms
- AeroFarms LLC
Significant Microgreens Market Industry Milestones
- August 2022: AeroFarms expanded its retail presence to 160 Fresh Market stores across 22 states.
- February 2023: Good Leaf Farm partnered with Unfold to introduce premium lines of vertically farmed greens.
- May 2023: AeroFarms launched a nationwide expansion through a collaboration with Amazon Fresh.
Future Outlook for Microgreens Market Market
The microgreens market is poised for continued growth, driven by sustained consumer demand for healthy and convenient food options, ongoing technological innovations in farming practices, and the expansion of distribution channels. Strategic partnerships, product diversification, and a focus on sustainable production will be crucial for success. The market presents significant opportunities for both established players and new entrants to capitalize on the increasing demand for this nutrient-rich food source.
Microgreens Market Segmentation
- 1. Production Analysis
- 2. Consumption Analysis
- 3. Import Market Analysis (Value & Volume)
- 4. Export Market Analysis (Value & Volume)
- 5. Price Trend Analysis
Microgreens Market Segmentation By Geography
-
1. North America
- 1.1. United States
- 1.2. Canada
- 1.3. Mexico
-
2. South America
- 2.1. Brazil
- 2.2. Argentina
- 2.3. Rest of South America
-
3. Europe
- 3.1. United Kingdom
- 3.2. Germany
- 3.3. France
- 3.4. Italy
- 3.5. Spain
- 3.6. Russia
- 3.7. Benelux
- 3.8. Nordics
- 3.9. Rest of Europe
-
4. Middle East & Africa
- 4.1. Turkey
- 4.2. Israel
- 4.3. GCC
- 4.4. North Africa
- 4.5. South Africa
- 4.6. Rest of Middle East & Africa
-
5. Asia Pacific
- 5.1. China
- 5.2. India
- 5.3. Japan
- 5.4. South Korea
- 5.5. ASEAN
- 5.6. Oceania
- 5.7. Rest of Asia Pacific
Microgreens Market Regional Market Share
Geographic Coverage of Microgreens Market
Microgreens Market REPORT HIGHLIGHTS
| Aspects | Details |
|---|---|
| Study Period | 2020-2034 |
| Base Year | 2025 |
| Estimated Year | 2026 |
| Forecast Period | 2026-2034 |
| Historical Period | 2020-2025 |
| Growth Rate | CAGR of 6.40% from 2020-2034 |
| Segmentation |
|
Table of Contents
- 1. Introduction
- 1.1. Research Scope
- 1.2. Market Segmentation
- 1.3. Research Methodology
- 1.4. Definitions and Assumptions
- 2. Executive Summary
- 2.1. Introduction
- 3. Market Dynamics
- 3.1. Introduction
- 3.2. Market Drivers
- 3.2.1. Seed Treatment As A Solution To Enhance Yield; Growing Awareness For Seed Treatment Among The Farmers; Rising Trend Of Organic Farming
- 3.3. Market Restrains
- 3.3.1. Limitations Across Farm-Level Seed Treatment; Rising Environmental Concerns
- 3.4. Market Trends
- 3.4.1. Rise in Adoption of Indoor Farming
- 4. Market Factor Analysis
- 4.1. Porters Five Forces
- 4.2. Supply/Value Chain
- 4.3. PESTEL analysis
- 4.4. Market Entropy
- 4.5. Patent/Trademark Analysis
- 5. Global Microgreens Market Analysis, Insights and Forecast, 2020-2032
- 5.1. Market Analysis, Insights and Forecast - by Production Analysis
- 5.2. Market Analysis, Insights and Forecast - by Consumption Analysis
- 5.3. Market Analysis, Insights and Forecast - by Import Market Analysis (Value & Volume)
- 5.4. Market Analysis, Insights and Forecast - by Export Market Analysis (Value & Volume)
- 5.5. Market Analysis, Insights and Forecast - by Price Trend Analysis
- 5.6. Market Analysis, Insights and Forecast - by Region
- 5.6.1. North America
- 5.6.2. South America
- 5.6.3. Europe
- 5.6.4. Middle East & Africa
- 5.6.5. Asia Pacific
- 5.1. Market Analysis, Insights and Forecast - by Production Analysis
- 6. North America Microgreens Market Analysis, Insights and Forecast, 2020-2032
- 6.1. Market Analysis, Insights and Forecast - by Production Analysis
- 6.2. Market Analysis, Insights and Forecast - by Consumption Analysis
- 6.3. Market Analysis, Insights and Forecast - by Import Market Analysis (Value & Volume)
- 6.4. Market Analysis, Insights and Forecast - by Export Market Analysis (Value & Volume)
- 6.5. Market Analysis, Insights and Forecast - by Price Trend Analysis
- 6.1. Market Analysis, Insights and Forecast - by Production Analysis
- 7. South America Microgreens Market Analysis, Insights and Forecast, 2020-2032
- 7.1. Market Analysis, Insights and Forecast - by Production Analysis
- 7.2. Market Analysis, Insights and Forecast - by Consumption Analysis
- 7.3. Market Analysis, Insights and Forecast - by Import Market Analysis (Value & Volume)
- 7.4. Market Analysis, Insights and Forecast - by Export Market Analysis (Value & Volume)
- 7.5. Market Analysis, Insights and Forecast - by Price Trend Analysis
- 7.1. Market Analysis, Insights and Forecast - by Production Analysis
- 8. Europe Microgreens Market Analysis, Insights and Forecast, 2020-2032
- 8.1. Market Analysis, Insights and Forecast - by Production Analysis
- 8.2. Market Analysis, Insights and Forecast - by Consumption Analysis
- 8.3. Market Analysis, Insights and Forecast - by Import Market Analysis (Value & Volume)
- 8.4. Market Analysis, Insights and Forecast - by Export Market Analysis (Value & Volume)
- 8.5. Market Analysis, Insights and Forecast - by Price Trend Analysis
- 8.1. Market Analysis, Insights and Forecast - by Production Analysis
- 9. Middle East & Africa Microgreens Market Analysis, Insights and Forecast, 2020-2032
- 9.1. Market Analysis, Insights and Forecast - by Production Analysis
- 9.2. Market Analysis, Insights and Forecast - by Consumption Analysis
- 9.3. Market Analysis, Insights and Forecast - by Import Market Analysis (Value & Volume)
- 9.4. Market Analysis, Insights and Forecast - by Export Market Analysis (Value & Volume)
- 9.5. Market Analysis, Insights and Forecast - by Price Trend Analysis
- 9.1. Market Analysis, Insights and Forecast - by Production Analysis
- 10. Asia Pacific Microgreens Market Analysis, Insights and Forecast, 2020-2032
- 10.1. Market Analysis, Insights and Forecast - by Production Analysis
- 10.2. Market Analysis, Insights and Forecast - by Consumption Analysis
- 10.3. Market Analysis, Insights and Forecast - by Import Market Analysis (Value & Volume)
- 10.4. Market Analysis, Insights and Forecast - by Export Market Analysis (Value & Volume)
- 10.5. Market Analysis, Insights and Forecast - by Price Trend Analysis
- 10.1. Market Analysis, Insights and Forecast - by Production Analysis
- 11. Competitive Analysis
- 11.1. Global Market Share Analysis 2025
- 11.2. Company Profiles
- 11.2.1 Living Earth Farm
- 11.2.1.1. Overview
- 11.2.1.2. Products
- 11.2.1.3. SWOT Analysis
- 11.2.1.4. Recent Developments
- 11.2.1.5. Financials (Based on Availability)
- 11.2.2 Farm Box Greens
- 11.2.2.1. Overview
- 11.2.2.2. Products
- 11.2.2.3. SWOT Analysis
- 11.2.2.4. Recent Developments
- 11.2.2.5. Financials (Based on Availability)
- 11.2.3 Gotham Greens*List Not Exhaustive
- 11.2.3.1. Overview
- 11.2.3.2. Products
- 11.2.3.3. SWOT Analysis
- 11.2.3.4. Recent Developments
- 11.2.3.5. Financials (Based on Availability)
- 11.2.4 Jiangsu Skyplant Greenhouse Technology Co Ltd
- 11.2.4.1. Overview
- 11.2.4.2. Products
- 11.2.4.3. SWOT Analysis
- 11.2.4.4. Recent Developments
- 11.2.4.5. Financials (Based on Availability)
- 11.2.5 Madar Farms
- 11.2.5.1. Overview
- 11.2.5.2. Products
- 11.2.5.3. SWOT Analysis
- 11.2.5.4. Recent Developments
- 11.2.5.5. Financials (Based on Availability)
- 11.2.6 Chef's Garden Inc
- 11.2.6.1. Overview
- 11.2.6.2. Products
- 11.2.6.3. SWOT Analysis
- 11.2.6.4. Recent Developments
- 11.2.6.5. Financials (Based on Availability)
- 11.2.7 Shanghai Dehuan Industry Co Ltd
- 11.2.7.1. Overview
- 11.2.7.2. Products
- 11.2.7.3. SWOT Analysis
- 11.2.7.4. Recent Developments
- 11.2.7.5. Financials (Based on Availability)
- 11.2.8 Metro Microgreens
- 11.2.8.1. Overview
- 11.2.8.2. Products
- 11.2.8.3. SWOT Analysis
- 11.2.8.4. Recent Developments
- 11.2.8.5. Financials (Based on Availability)
- 11.2.9 Goodleaf Farms
- 11.2.9.1. Overview
- 11.2.9.2. Products
- 11.2.9.3. SWOT Analysis
- 11.2.9.4. Recent Developments
- 11.2.9.5. Financials (Based on Availability)
- 11.2.10 AeroFarms LLC
- 11.2.10.1. Overview
- 11.2.10.2. Products
- 11.2.10.3. SWOT Analysis
- 11.2.10.4. Recent Developments
- 11.2.10.5. Financials (Based on Availability)
- 11.2.1 Living Earth Farm
List of Figures
- Figure 1: Global Microgreens Market Revenue Breakdown (Million, %) by Region 2025 & 2033
- Figure 2: North America Microgreens Market Revenue (Million), by Production Analysis 2025 & 2033
- Figure 3: North America Microgreens Market Revenue Share (%), by Production Analysis 2025 & 2033
- Figure 4: North America Microgreens Market Revenue (Million), by Consumption Analysis 2025 & 2033
- Figure 5: North America Microgreens Market Revenue Share (%), by Consumption Analysis 2025 & 2033
- Figure 6: North America Microgreens Market Revenue (Million), by Import Market Analysis (Value & Volume) 2025 & 2033
- Figure 7: North America Microgreens Market Revenue Share (%), by Import Market Analysis (Value & Volume) 2025 & 2033
- Figure 8: North America Microgreens Market Revenue (Million), by Export Market Analysis (Value & Volume) 2025 & 2033
- Figure 9: North America Microgreens Market Revenue Share (%), by Export Market Analysis (Value & Volume) 2025 & 2033
- Figure 10: North America Microgreens Market Revenue (Million), by Price Trend Analysis 2025 & 2033
- Figure 11: North America Microgreens Market Revenue Share (%), by Price Trend Analysis 2025 & 2033
- Figure 12: North America Microgreens Market Revenue (Million), by Country 2025 & 2033
- Figure 13: North America Microgreens Market Revenue Share (%), by Country 2025 & 2033
- Figure 14: South America Microgreens Market Revenue (Million), by Production Analysis 2025 & 2033
- Figure 15: South America Microgreens Market Revenue Share (%), by Production Analysis 2025 & 2033
- Figure 16: South America Microgreens Market Revenue (Million), by Consumption Analysis 2025 & 2033
- Figure 17: South America Microgreens Market Revenue Share (%), by Consumption Analysis 2025 & 2033
- Figure 18: South America Microgreens Market Revenue (Million), by Import Market Analysis (Value & Volume) 2025 & 2033
- Figure 19: South America Microgreens Market Revenue Share (%), by Import Market Analysis (Value & Volume) 2025 & 2033
- Figure 20: South America Microgreens Market Revenue (Million), by Export Market Analysis (Value & Volume) 2025 & 2033
- Figure 21: South America Microgreens Market Revenue Share (%), by Export Market Analysis (Value & Volume) 2025 & 2033
- Figure 22: South America Microgreens Market Revenue (Million), by Price Trend Analysis 2025 & 2033
- Figure 23: South America Microgreens Market Revenue Share (%), by Price Trend Analysis 2025 & 2033
- Figure 24: South America Microgreens Market Revenue (Million), by Country 2025 & 2033
- Figure 25: South America Microgreens Market Revenue Share (%), by Country 2025 & 2033
- Figure 26: Europe Microgreens Market Revenue (Million), by Production Analysis 2025 & 2033
- Figure 27: Europe Microgreens Market Revenue Share (%), by Production Analysis 2025 & 2033
- Figure 28: Europe Microgreens Market Revenue (Million), by Consumption Analysis 2025 & 2033
- Figure 29: Europe Microgreens Market Revenue Share (%), by Consumption Analysis 2025 & 2033
- Figure 30: Europe Microgreens Market Revenue (Million), by Import Market Analysis (Value & Volume) 2025 & 2033
- Figure 31: Europe Microgreens Market Revenue Share (%), by Import Market Analysis (Value & Volume) 2025 & 2033
- Figure 32: Europe Microgreens Market Revenue (Million), by Export Market Analysis (Value & Volume) 2025 & 2033
- Figure 33: Europe Microgreens Market Revenue Share (%), by Export Market Analysis (Value & Volume) 2025 & 2033
- Figure 34: Europe Microgreens Market Revenue (Million), by Price Trend Analysis 2025 & 2033
- Figure 35: Europe Microgreens Market Revenue Share (%), by Price Trend Analysis 2025 & 2033
- Figure 36: Europe Microgreens Market Revenue (Million), by Country 2025 & 2033
- Figure 37: Europe Microgreens Market Revenue Share (%), by Country 2025 & 2033
- Figure 38: Middle East & Africa Microgreens Market Revenue (Million), by Production Analysis 2025 & 2033
- Figure 39: Middle East & Africa Microgreens Market Revenue Share (%), by Production Analysis 2025 & 2033
- Figure 40: Middle East & Africa Microgreens Market Revenue (Million), by Consumption Analysis 2025 & 2033
- Figure 41: Middle East & Africa Microgreens Market Revenue Share (%), by Consumption Analysis 2025 & 2033
- Figure 42: Middle East & Africa Microgreens Market Revenue (Million), by Import Market Analysis (Value & Volume) 2025 & 2033
- Figure 43: Middle East & Africa Microgreens Market Revenue Share (%), by Import Market Analysis (Value & Volume) 2025 & 2033
- Figure 44: Middle East & Africa Microgreens Market Revenue (Million), by Export Market Analysis (Value & Volume) 2025 & 2033
- Figure 45: Middle East & Africa Microgreens Market Revenue Share (%), by Export Market Analysis (Value & Volume) 2025 & 2033
- Figure 46: Middle East & Africa Microgreens Market Revenue (Million), by Price Trend Analysis 2025 & 2033
- Figure 47: Middle East & Africa Microgreens Market Revenue Share (%), by Price Trend Analysis 2025 & 2033
- Figure 48: Middle East & Africa Microgreens Market Revenue (Million), by Country 2025 & 2033
- Figure 49: Middle East & Africa Microgreens Market Revenue Share (%), by Country 2025 & 2033
- Figure 50: Asia Pacific Microgreens Market Revenue (Million), by Production Analysis 2025 & 2033
- Figure 51: Asia Pacific Microgreens Market Revenue Share (%), by Production Analysis 2025 & 2033
- Figure 52: Asia Pacific Microgreens Market Revenue (Million), by Consumption Analysis 2025 & 2033
- Figure 53: Asia Pacific Microgreens Market Revenue Share (%), by Consumption Analysis 2025 & 2033
- Figure 54: Asia Pacific Microgreens Market Revenue (Million), by Import Market Analysis (Value & Volume) 2025 & 2033
- Figure 55: Asia Pacific Microgreens Market Revenue Share (%), by Import Market Analysis (Value & Volume) 2025 & 2033
- Figure 56: Asia Pacific Microgreens Market Revenue (Million), by Export Market Analysis (Value & Volume) 2025 & 2033
- Figure 57: Asia Pacific Microgreens Market Revenue Share (%), by Export Market Analysis (Value & Volume) 2025 & 2033
- Figure 58: Asia Pacific Microgreens Market Revenue (Million), by Price Trend Analysis 2025 & 2033
- Figure 59: Asia Pacific Microgreens Market Revenue Share (%), by Price Trend Analysis 2025 & 2033
- Figure 60: Asia Pacific Microgreens Market Revenue (Million), by Country 2025 & 2033
- Figure 61: Asia Pacific Microgreens Market Revenue Share (%), by Country 2025 & 2033
List of Tables
- Table 1: Global Microgreens Market Revenue Million Forecast, by Production Analysis 2020 & 2033
- Table 2: Global Microgreens Market Revenue Million Forecast, by Consumption Analysis 2020 & 2033
- Table 3: Global Microgreens Market Revenue Million Forecast, by Import Market Analysis (Value & Volume) 2020 & 2033
- Table 4: Global Microgreens Market Revenue Million Forecast, by Export Market Analysis (Value & Volume) 2020 & 2033
- Table 5: Global Microgreens Market Revenue Million Forecast, by Price Trend Analysis 2020 & 2033
- Table 6: Global Microgreens Market Revenue Million Forecast, by Region 2020 & 2033
- Table 7: Global Microgreens Market Revenue Million Forecast, by Production Analysis 2020 & 2033
- Table 8: Global Microgreens Market Revenue Million Forecast, by Consumption Analysis 2020 & 2033
- Table 9: Global Microgreens Market Revenue Million Forecast, by Import Market Analysis (Value & Volume) 2020 & 2033
- Table 10: Global Microgreens Market Revenue Million Forecast, by Export Market Analysis (Value & Volume) 2020 & 2033
- Table 11: Global Microgreens Market Revenue Million Forecast, by Price Trend Analysis 2020 & 2033
- Table 12: Global Microgreens Market Revenue Million Forecast, by Country 2020 & 2033
- Table 13: United States Microgreens Market Revenue (Million) Forecast, by Application 2020 & 2033
- Table 14: Canada Microgreens Market Revenue (Million) Forecast, by Application 2020 & 2033
- Table 15: Mexico Microgreens Market Revenue (Million) Forecast, by Application 2020 & 2033
- Table 16: Global Microgreens Market Revenue Million Forecast, by Production Analysis 2020 & 2033
- Table 17: Global Microgreens Market Revenue Million Forecast, by Consumption Analysis 2020 & 2033
- Table 18: Global Microgreens Market Revenue Million Forecast, by Import Market Analysis (Value & Volume) 2020 & 2033
- Table 19: Global Microgreens Market Revenue Million Forecast, by Export Market Analysis (Value & Volume) 2020 & 2033
- Table 20: Global Microgreens Market Revenue Million Forecast, by Price Trend Analysis 2020 & 2033
- Table 21: Global Microgreens Market Revenue Million Forecast, by Country 2020 & 2033
- Table 22: Brazil Microgreens Market Revenue (Million) Forecast, by Application 2020 & 2033
- Table 23: Argentina Microgreens Market Revenue (Million) Forecast, by Application 2020 & 2033
- Table 24: Rest of South America Microgreens Market Revenue (Million) Forecast, by Application 2020 & 2033
- Table 25: Global Microgreens Market Revenue Million Forecast, by Production Analysis 2020 & 2033
- Table 26: Global Microgreens Market Revenue Million Forecast, by Consumption Analysis 2020 & 2033
- Table 27: Global Microgreens Market Revenue Million Forecast, by Import Market Analysis (Value & Volume) 2020 & 2033
- Table 28: Global Microgreens Market Revenue Million Forecast, by Export Market Analysis (Value & Volume) 2020 & 2033
- Table 29: Global Microgreens Market Revenue Million Forecast, by Price Trend Analysis 2020 & 2033
- Table 30: Global Microgreens Market Revenue Million Forecast, by Country 2020 & 2033
- Table 31: United Kingdom Microgreens Market Revenue (Million) Forecast, by Application 2020 & 2033
- Table 32: Germany Microgreens Market Revenue (Million) Forecast, by Application 2020 & 2033
- Table 33: France Microgreens Market Revenue (Million) Forecast, by Application 2020 & 2033
- Table 34: Italy Microgreens Market Revenue (Million) Forecast, by Application 2020 & 2033
- Table 35: Spain Microgreens Market Revenue (Million) Forecast, by Application 2020 & 2033
- Table 36: Russia Microgreens Market Revenue (Million) Forecast, by Application 2020 & 2033
- Table 37: Benelux Microgreens Market Revenue (Million) Forecast, by Application 2020 & 2033
- Table 38: Nordics Microgreens Market Revenue (Million) Forecast, by Application 2020 & 2033
- Table 39: Rest of Europe Microgreens Market Revenue (Million) Forecast, by Application 2020 & 2033
- Table 40: Global Microgreens Market Revenue Million Forecast, by Production Analysis 2020 & 2033
- Table 41: Global Microgreens Market Revenue Million Forecast, by Consumption Analysis 2020 & 2033
- Table 42: Global Microgreens Market Revenue Million Forecast, by Import Market Analysis (Value & Volume) 2020 & 2033
- Table 43: Global Microgreens Market Revenue Million Forecast, by Export Market Analysis (Value & Volume) 2020 & 2033
- Table 44: Global Microgreens Market Revenue Million Forecast, by Price Trend Analysis 2020 & 2033
- Table 45: Global Microgreens Market Revenue Million Forecast, by Country 2020 & 2033
- Table 46: Turkey Microgreens Market Revenue (Million) Forecast, by Application 2020 & 2033
- Table 47: Israel Microgreens Market Revenue (Million) Forecast, by Application 2020 & 2033
- Table 48: GCC Microgreens Market Revenue (Million) Forecast, by Application 2020 & 2033
- Table 49: North Africa Microgreens Market Revenue (Million) Forecast, by Application 2020 & 2033
- Table 50: South Africa Microgreens Market Revenue (Million) Forecast, by Application 2020 & 2033
- Table 51: Rest of Middle East & Africa Microgreens Market Revenue (Million) Forecast, by Application 2020 & 2033
- Table 52: Global Microgreens Market Revenue Million Forecast, by Production Analysis 2020 & 2033
- Table 53: Global Microgreens Market Revenue Million Forecast, by Consumption Analysis 2020 & 2033
- Table 54: Global Microgreens Market Revenue Million Forecast, by Import Market Analysis (Value & Volume) 2020 & 2033
- Table 55: Global Microgreens Market Revenue Million Forecast, by Export Market Analysis (Value & Volume) 2020 & 2033
- Table 56: Global Microgreens Market Revenue Million Forecast, by Price Trend Analysis 2020 & 2033
- Table 57: Global Microgreens Market Revenue Million Forecast, by Country 2020 & 2033
- Table 58: China Microgreens Market Revenue (Million) Forecast, by Application 2020 & 2033
- Table 59: India Microgreens Market Revenue (Million) Forecast, by Application 2020 & 2033
- Table 60: Japan Microgreens Market Revenue (Million) Forecast, by Application 2020 & 2033
- Table 61: South Korea Microgreens Market Revenue (Million) Forecast, by Application 2020 & 2033
- Table 62: ASEAN Microgreens Market Revenue (Million) Forecast, by Application 2020 & 2033
- Table 63: Oceania Microgreens Market Revenue (Million) Forecast, by Application 2020 & 2033
- Table 64: Rest of Asia Pacific Microgreens Market Revenue (Million) Forecast, by Application 2020 & 2033
Frequently Asked Questions
1. What is the projected Compound Annual Growth Rate (CAGR) of the Microgreens Market?
The projected CAGR is approximately 6.40%.
2. Which companies are prominent players in the Microgreens Market?
Key companies in the market include Living Earth Farm, Farm Box Greens, Gotham Greens*List Not Exhaustive, Jiangsu Skyplant Greenhouse Technology Co Ltd, Madar Farms, Chef's Garden Inc, Shanghai Dehuan Industry Co Ltd, Metro Microgreens, Goodleaf Farms, AeroFarms LLC.
3. What are the main segments of the Microgreens Market?
The market segments include Production Analysis, Consumption Analysis, Import Market Analysis (Value & Volume), Export Market Analysis (Value & Volume), Price Trend Analysis.
4. Can you provide details about the market size?
The market size is estimated to be USD 245.77 Million as of 2022.
5. What are some drivers contributing to market growth?
Seed Treatment As A Solution To Enhance Yield; Growing Awareness For Seed Treatment Among The Farmers; Rising Trend Of Organic Farming.
6. What are the notable trends driving market growth?
Rise in Adoption of Indoor Farming.
7. Are there any restraints impacting market growth?
Limitations Across Farm-Level Seed Treatment; Rising Environmental Concerns.
8. Can you provide examples of recent developments in the market?
May 2023: AeroFarms, a Certified B Corporation and a prominent figure in indoor vertical farming took a significant step forward by launching a nationwide expansion through a collaboration with Amazon Fresh. This partnership aims to enhance the high-tech consumer grocery experience. Building on their prior success with Whole Foods Market in 2022, AeroFarms became the first indoor leafy greens grower to be included in Whole Foods Market's Global Planogram, setting an industry precedent.
9. What pricing options are available for accessing the report?
Pricing options include single-user, multi-user, and enterprise licenses priced at USD 4750, USD 5250, and USD 8750 respectively.
10. Is the market size provided in terms of value or volume?
The market size is provided in terms of value, measured in Million.
11. Are there any specific market keywords associated with the report?
Yes, the market keyword associated with the report is "Microgreens Market," which aids in identifying and referencing the specific market segment covered.
12. How do I determine which pricing option suits my needs best?
The pricing options vary based on user requirements and access needs. Individual users may opt for single-user licenses, while businesses requiring broader access may choose multi-user or enterprise licenses for cost-effective access to the report.
13. Are there any additional resources or data provided in the Microgreens Market report?
While the report offers comprehensive insights, it's advisable to review the specific contents or supplementary materials provided to ascertain if additional resources or data are available.
14. How can I stay updated on further developments or reports in the Microgreens Market?
To stay informed about further developments, trends, and reports in the Microgreens Market, consider subscribing to industry newsletters, following relevant companies and organizations, or regularly checking reputable industry news sources and publications.
Methodology
Step 1 - Identification of Relevant Samples Size from Population Database


Step 2 - Approaches for Defining Global Market Size (Value, Volume* & Price*)

Note*: In applicable scenarios
Step 3 - Data Sources
Primary Research
- Web Analytics
- Survey Reports
- Research Institute
- Latest Research Reports
- Opinion Leaders
Secondary Research
- Annual Reports
- White Paper
- Latest Press Release
- Industry Association
- Paid Database
- Investor Presentations

Step 4 - Data Triangulation
Involves using different sources of information in order to increase the validity of a study
These sources are likely to be stakeholders in a program - participants, other researchers, program staff, other community members, and so on.
Then we put all data in single framework & apply various statistical tools to find out the dynamic on the market.
During the analysis stage, feedback from the stakeholder groups would be compared to determine areas of agreement as well as areas of divergence