

Key Insights
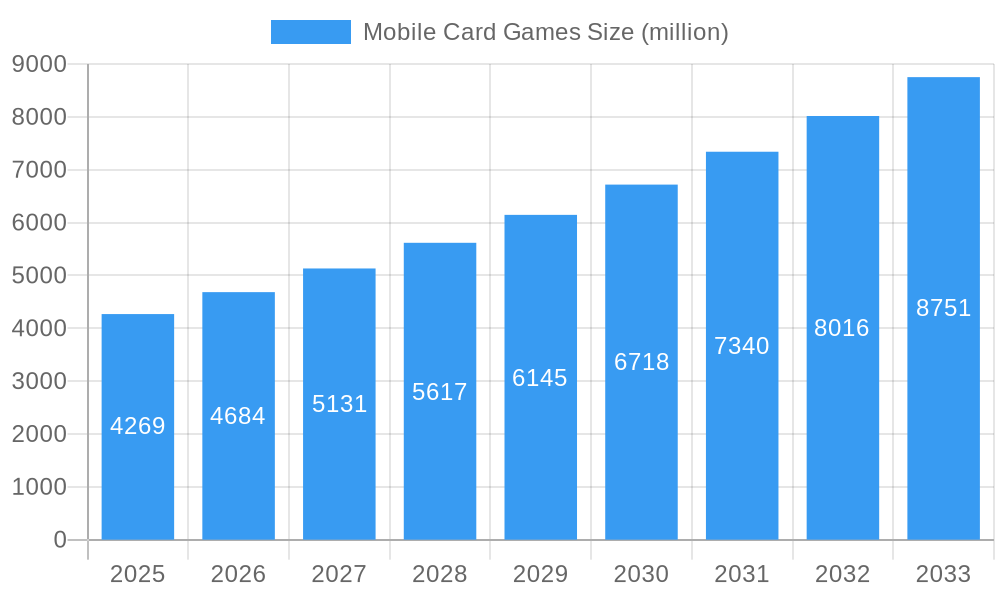
The global Mobile Card Games market is experiencing robust expansion, projected to reach USD 4269 million by 2025, with a compelling Compound Annual Growth Rate (CAGR) of 9.6% anticipated from 2025 to 2033. This significant growth is fueled by a confluence of factors, including the increasing penetration of smartphones and tablets worldwide, coupled with the widespread availability of high-speed internet. Players are drawn to the accessibility and convenience of card games playable on mobile devices, enabling them to engage in strategic gameplay anytime, anywhere. The evolution of mobile technology has also allowed for richer graphics, more complex gameplay mechanics, and seamless online multiplayer experiences, further enhancing player engagement. Free-to-play models, supported by in-app purchases for cosmetic items, boosters, or faster progression, have proven highly effective in attracting and retaining a large player base. The social aspect of these games, allowing for friendly competition and community building through guilds and tournaments, also plays a crucial role in their sustained popularity.
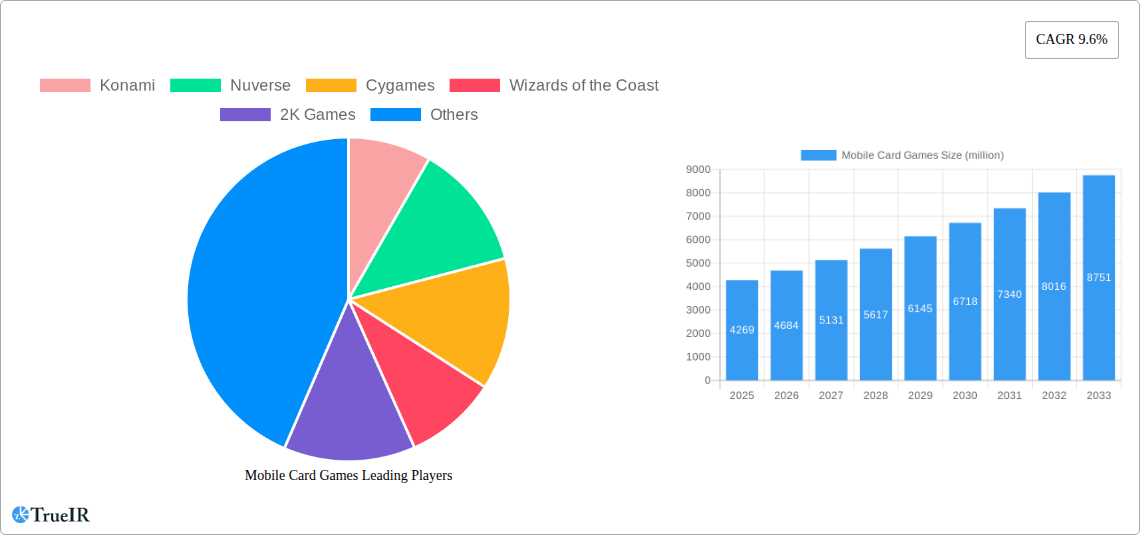
Mobile Card Games Market Size (In Billion)
The mobile card game industry is characterized by continuous innovation and a dynamic competitive landscape. Leading companies like Konami, Nuverse, Cygames, Wizards of the Coast, 2K Games, Blizzard Entertainment, Riot Game, Pokemon, Tencent, Netease, and Yoka Games are actively investing in developing new titles and refreshing existing ones to capture market share. Key trends include the integration of esports elements, the rise of collectible card games (CCGs) with deep strategic depth, and the exploration of cross-platform play to expand reach. While the market is largely driven by the appeal of strategy, collection, and competition, potential restraints could arise from market saturation, increasing development costs, and evolving player preferences that might shift towards other gaming genres. Nevertheless, the inherent replayability and evergreen appeal of card game mechanics, adapted for the mobile platform, position the market for sustained and dynamic growth throughout the forecast period.
Mobile Card Games Company Market Share
This in-depth report provides an unparalleled analysis of the global Mobile Card Games market, offering critical insights into its structure, trends, and future trajectory. Designed for industry professionals, investors, and strategists, this report leverages high-volume keywords and meticulous data analysis to illuminate the competitive landscape, emerging opportunities, and key growth drivers. Spanning from 2019 to 2033, with a base year of 2025, this report is your definitive guide to navigating the dynamic world of mobile card gaming.
Mobile Card Games Market Structure & Competitive Landscape
The Mobile Card Games market exhibits a complex and evolving structure, characterized by a moderate level of market concentration, with key players like Tencent, Netease, Konami, Nuverse, Cygames, Wizards of the Coast, 2K Games, Blizzard Entertainment, Riot Games, Pokemon, and Yoka Games vying for significant market share. Innovation drivers are predominantly technological, focusing on enhanced graphics, intuitive gameplay mechanics, and robust online multiplayer experiences. Regulatory impacts, while varied across regions, are increasingly influencing monetization strategies and player data protection. Product substitutes, primarily other mobile game genres and console card games, exert continuous pressure, necessitating constant adaptation by market participants. End-user segmentation reveals distinct preferences between Male and Female demographics, with dedicated strategies required to capture each segment. Mergers & Acquisitions (M&A) trends, though not at an explosive rate, are strategic, aimed at acquiring talent, technology, or expanding user bases. We anticipate an M&A volume of approximately 50-75 transactions annually within the forecast period, with concentration ratios for the top 5 players fluctuating between 40% and 55%.
Mobile Card Games Market Trends & Opportunities
The Mobile Card Games market is on a trajectory of robust expansion, projected to witness a Compound Annual Growth Rate (CAGR) of xx% from 2025 to 2033. This significant growth is fueled by an ever-increasing global mobile penetration rate, currently standing at over 85% and expected to climb further, alongside a burgeoning digital economy that supports in-app purchases and subscription models. Technological shifts are paramount, with advancements in Artificial Intelligence (AI) enhancing opponent behavior and personalizing player experiences, while blockchain integration is being explored for digital asset ownership and trading, promising new monetization avenues. Consumer preferences are increasingly leaning towards immersive narratives, competitive esports integration, and cross-platform playability, allowing players to engage seamlessly across their mobile devices and other platforms. The competitive dynamics are intensifying, with established giants and innovative startups alike pushing the boundaries of game design and marketing. The market size is projected to grow from an estimated $25 billion in 2025 to over $50 billion by 2033. Emerging opportunities lie in the development of hybrid card game experiences that blend traditional mechanics with RPG elements or real-time strategy, catering to a broader audience. Furthermore, the untapped potential in emerging economies, where smartphone adoption is rapidly increasing, presents a substantial growth frontier. The integration of augmented reality (AR) for enhanced in-game visualization is another promising area, offering a novel layer of engagement. The rise of influencer marketing and community-driven development will also play a crucial role in shaping consumer choices and fostering loyalty within this vibrant market.
Dominant Markets & Segments in Mobile Card Games
The Male segment currently dominates the Mobile Card Games market, driven by a long-standing affinity for strategic gameplay and competitive multiplayer experiences. This dominance is projected to continue throughout the forecast period, with an estimated 65% market share in 2025, growing to approximately 68% by 2033. Key growth drivers within this segment include the widespread availability of high-performance smartphones capable of rendering complex game graphics and supporting seamless online connectivity. Furthermore, extensive marketing campaigns and the integration of esports tournaments with significant prize pools directly appeal to the competitive spirit of this demographic.
On the iOS platform, the market exhibits strong growth, contributing an estimated 55% of the total revenue in 2025, projected to reach 58% by 2033. This dominance is attributed to the platform's reputation for delivering high-quality gaming experiences, robust app store security, and a user base with a higher propensity for in-app spending. Infrastructure supporting iOS devices, including advanced processors and high-resolution displays, is ideally suited for the visually rich and interactive nature of modern card games.
While the Female segment is currently smaller, it represents a significant growth opportunity. Its market share, estimated at 35% in 2025, is anticipated to expand to around 32% by 2033, indicating a slower but steady increase. Growth drivers for the female segment include a rising interest in narrative-driven games, social interaction features, and more accessible gameplay mechanics. The increasing adoption of smartphones among women and a growing appreciation for strategic thinking in gaming are also contributing factors.
The Android platform, while holding a smaller share than iOS, is experiencing rapid growth. Estimated at 45% of market revenue in 2025, it is projected to reach 42% by 2033. The vast global reach of Android devices, particularly in emerging markets, offers immense potential for user acquisition. Government policies promoting digital infrastructure development and increasing internet accessibility in these regions further bolster Android's growth prospects.
Mobile Card Games Product Analysis
Mobile card games are witnessing a surge in product innovation, driven by sophisticated AI for dynamic opponent behavior and personalized challenges. Developers are increasingly integrating rich narrative elements and robust social features, enhancing player engagement beyond core gameplay. Competitive advantages are being forged through cross-platform compatibility, allowing seamless transitions between mobile devices and PCs, and the exploration of blockchain technology for digital asset ownership and trading. Technological advancements are enabling more visually stunning graphics and intricate gameplay mechanics, catering to both casual and hardcore gamers seeking deep strategic experiences.
Key Drivers, Barriers & Challenges in Mobile Card Games
Key Drivers:
- Technological Advancements: Enhanced mobile processing power, AI, and improved network infrastructure enable more sophisticated gameplay and immersive experiences.
- Growing Mobile Penetration: Increasing smartphone adoption globally, especially in emerging markets, expands the potential player base.
- Esports Integration: The rise of competitive mobile gaming and associated tournaments drives engagement and monetization.
- Freemium Monetization Models: The widespread adoption of free-to-play with in-app purchases has proven highly effective.
Key Barriers & Challenges:
- Market Saturation: Intense competition from a vast array of mobile games necessitates unique selling propositions.
- Player Retention: Sustaining long-term engagement in a market with short attention spans is a constant challenge.
- Regulatory Scrutiny: Evolving regulations around in-app purchases, loot boxes, and data privacy can impact revenue streams.
- Monetization Balance: Striking a fair balance between revenue generation and player experience is crucial to avoid backlash.
Growth Drivers in the Mobile Card Games Market
The Mobile Card Games market is propelled by several key growth drivers. Technologically, the continuous evolution of mobile hardware, including more powerful processors and improved graphics capabilities, allows for increasingly complex and visually appealing card game experiences. The integration of AI is enabling more sophisticated and adaptive opponent behaviors, enhancing replayability and player engagement. Economically, the freemium model, which offers a free entry point with optional in-app purchases, has proven highly successful in attracting and retaining a vast user base. Regulatory frameworks that encourage digital economies and protect intellectual property also contribute to a stable environment for growth.
Challenges Impacting Mobile Card Games Growth
Despite robust growth, the Mobile Card Games market faces several significant challenges. Regulatory complexities surrounding loot boxes and in-app monetization continue to evolve, posing a risk to established revenue models and requiring ongoing adaptation from developers. Supply chain issues, while less direct for software, can indirectly impact hardware availability for optimal gameplay, thereby affecting player experience. Competitive pressures are immense, with a constant influx of new titles and established players vying for player attention and spending. This necessitates continuous innovation and substantial marketing investments to maintain market presence and player engagement.
Key Players Shaping the Mobile Card Games Market
- Konami
- Nuverse
- Cygames
- Wizards of the Coast
- 2K Games
- Blizzard Entertainment
- Riot Game
- Pokemon
- Tencent
- Netease
- Yoka Games
Significant Mobile Card Games Industry Milestones
- 2019: Launch of "Legends of Runeterra" by Riot Games, introducing innovative deck-building mechanics and a player-friendly monetization system.
- 2020: Release of "Hearthstone Battlegrounds" by Blizzard Entertainment, a popular auto-battler mode that expanded the "Hearthstone" ecosystem.
- 2021: "Magic: The Gathering Arena" continues its expansion on mobile, solidifying its position as a leading digital collectible card game.
- 2022: Tencent's "Honor of Kings" introduces a highly successful card-based mini-game mode, demonstrating cross-genre appeal.
- 2023: Nuverse invests heavily in the development of new AAA mobile card titles, signaling aggressive market expansion.
- 2024: Cygames announces a collaboration with a major anime studio for a new card game IP, leveraging established fan bases.
Future Outlook for Mobile Card Games Market
The future outlook for the Mobile Card Games market is exceptionally promising, driven by continued technological innovation and evolving consumer engagement strategies. Strategic opportunities lie in the deeper integration of AI for hyper-personalized gameplay and dynamic content generation, ensuring sustained player interest. The exploration of decentralized technologies, such as NFTs for unique in-game assets, presents a significant avenue for novel monetization and player ownership. Furthermore, the expansion into emerging markets with tailored game designs and accessible monetization models will unlock substantial untapped potential. The market is poised for further growth as developers continue to push the boundaries of what is possible in mobile gaming, creating more immersive, social, and competitive experiences.
Mobile Card Games Segmentation
-
1. Application
- 1.1. Male
- 1.2. Female
-
2. Type
- 2.1. iOS
- 2.2. Android
Mobile Card Games Segmentation By Geography
-
1. North America
- 1.1. United States
- 1.2. Canada
- 1.3. Mexico
-
2. South America
- 2.1. Brazil
- 2.2. Argentina
- 2.3. Rest of South America
-
3. Europe
- 3.1. United Kingdom
- 3.2. Germany
- 3.3. France
- 3.4. Italy
- 3.5. Spain
- 3.6. Russia
- 3.7. Benelux
- 3.8. Nordics
- 3.9. Rest of Europe
-
4. Middle East & Africa
- 4.1. Turkey
- 4.2. Israel
- 4.3. GCC
- 4.4. North Africa
- 4.5. South Africa
- 4.6. Rest of Middle East & Africa
-
5. Asia Pacific
- 5.1. China
- 5.2. India
- 5.3. Japan
- 5.4. South Korea
- 5.5. ASEAN
- 5.6. Oceania
- 5.7. Rest of Asia Pacific
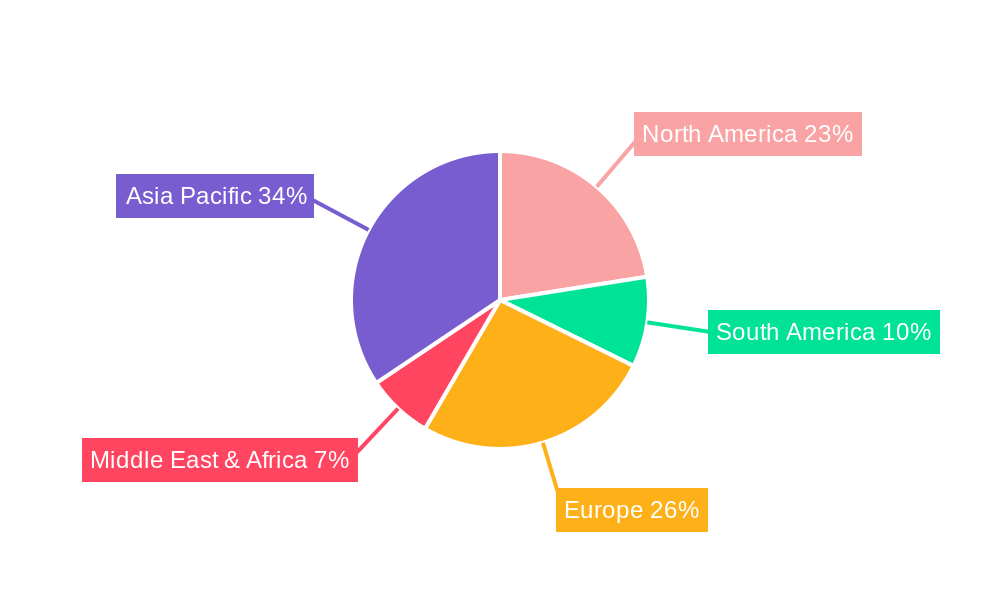
Mobile Card Games Regional Market Share
Geographic Coverage of Mobile Card Games
Mobile Card Games REPORT HIGHLIGHTS
| Aspects | Details |
|---|---|
| Study Period | 2020-2034 |
| Base Year | 2025 |
| Estimated Year | 2026 |
| Forecast Period | 2026-2034 |
| Historical Period | 2020-2025 |
| Growth Rate | CAGR of 9.6% from 2020-2034 |
| Segmentation |
|
Table of Contents
- 1. Introduction
- 1.1. Research Scope
- 1.2. Market Segmentation
- 1.3. Research Objective
- 1.4. Definitions and Assumptions
- 2. Executive Summary
- 2.1. Market Snapshot
- 3. Market Dynamics
- 3.1. Market Drivers
- 3.2. Market Restrains
- 3.3. Market Trends
- 3.4. Market Opportunities
- 4. Market Factor Analysis
- 4.1. Porters Five Forces
- 4.1.1. Bargaining Power of Suppliers
- 4.1.2. Bargaining Power of Buyers
- 4.1.3. Threat of New Entrants
- 4.1.4. Threat of Substitutes
- 4.1.5. Competitive Rivalry
- 4.2. PESTEL analysis
- 4.3. BCG Analysis
- 4.3.1. Stars (High Growth, High Market Share)
- 4.3.2. Cash Cows (Low Growth, High Market Share)
- 4.3.3. Question Mark (High Growth, Low Market Share)
- 4.3.4. Dogs (Low Growth, Low Market Share)
- 4.4. Ansoff Matrix Analysis
- 4.5. Supply Chain Analysis
- 4.6. Regulatory Landscape
- 4.7. Current Market Potential and Opportunity Assessment (TAM–SAM–SOM Framework)
- 4.8. TIR Analyst Note
- 4.1. Porters Five Forces
- 5. Market Analysis, Insights and Forecast 2021-2033
- 5.1. Market Analysis, Insights and Forecast - by Application
- 5.1.1. Male
- 5.1.2. Female
- 5.2. Market Analysis, Insights and Forecast - by Type
- 5.2.1. iOS
- 5.2.2. Android
- 5.3. Market Analysis, Insights and Forecast - by Region
- 5.3.1. North America
- 5.3.2. South America
- 5.3.3. Europe
- 5.3.4. Middle East & Africa
- 5.3.5. Asia Pacific
- 5.1. Market Analysis, Insights and Forecast - by Application
- 6. Global Mobile Card Games Analysis, Insights and Forecast, 2021-2033
- 6.1. Market Analysis, Insights and Forecast - by Application
- 6.1.1. Male
- 6.1.2. Female
- 6.2. Market Analysis, Insights and Forecast - by Type
- 6.2.1. iOS
- 6.2.2. Android
- 6.1. Market Analysis, Insights and Forecast - by Application
- 7. North America Mobile Card Games Analysis, Insights and Forecast, 2020-2032
- 7.1. Market Analysis, Insights and Forecast - by Application
- 7.1.1. Male
- 7.1.2. Female
- 7.2. Market Analysis, Insights and Forecast - by Type
- 7.2.1. iOS
- 7.2.2. Android
- 7.1. Market Analysis, Insights and Forecast - by Application
- 8. South America Mobile Card Games Analysis, Insights and Forecast, 2020-2032
- 8.1. Market Analysis, Insights and Forecast - by Application
- 8.1.1. Male
- 8.1.2. Female
- 8.2. Market Analysis, Insights and Forecast - by Type
- 8.2.1. iOS
- 8.2.2. Android
- 8.1. Market Analysis, Insights and Forecast - by Application
- 9. Europe Mobile Card Games Analysis, Insights and Forecast, 2020-2032
- 9.1. Market Analysis, Insights and Forecast - by Application
- 9.1.1. Male
- 9.1.2. Female
- 9.2. Market Analysis, Insights and Forecast - by Type
- 9.2.1. iOS
- 9.2.2. Android
- 9.1. Market Analysis, Insights and Forecast - by Application
- 10. Middle East & Africa Mobile Card Games Analysis, Insights and Forecast, 2020-2032
- 10.1. Market Analysis, Insights and Forecast - by Application
- 10.1.1. Male
- 10.1.2. Female
- 10.2. Market Analysis, Insights and Forecast - by Type
- 10.2.1. iOS
- 10.2.2. Android
- 10.1. Market Analysis, Insights and Forecast - by Application
- 11. Asia Pacific Mobile Card Games Analysis, Insights and Forecast, 2020-2032
- 11.1. Market Analysis, Insights and Forecast - by Application
- 11.1.1. Male
- 11.1.2. Female
- 11.2. Market Analysis, Insights and Forecast - by Type
- 11.2.1. iOS
- 11.2.2. Android
- 11.1. Market Analysis, Insights and Forecast - by Application
- 12. Competitive Analysis
- 12.1. Company Profiles
- 12.1.1 Konami
- 12.1.1.1. Company Overview
- 12.1.1.2. Products
- 12.1.1.3. Company Financials
- 12.1.1.4. SWOT Analysis
- 12.1.2 Nuverse
- 12.1.2.1. Company Overview
- 12.1.2.2. Products
- 12.1.2.3. Company Financials
- 12.1.2.4. SWOT Analysis
- 12.1.3 Cygames
- 12.1.3.1. Company Overview
- 12.1.3.2. Products
- 12.1.3.3. Company Financials
- 12.1.3.4. SWOT Analysis
- 12.1.4 Wizards of the Coast
- 12.1.4.1. Company Overview
- 12.1.4.2. Products
- 12.1.4.3. Company Financials
- 12.1.4.4. SWOT Analysis
- 12.1.5 2K Games
- 12.1.5.1. Company Overview
- 12.1.5.2. Products
- 12.1.5.3. Company Financials
- 12.1.5.4. SWOT Analysis
- 12.1.6 Blizzard Entertainment
- 12.1.6.1. Company Overview
- 12.1.6.2. Products
- 12.1.6.3. Company Financials
- 12.1.6.4. SWOT Analysis
- 12.1.7 Riot Game
- 12.1.7.1. Company Overview
- 12.1.7.2. Products
- 12.1.7.3. Company Financials
- 12.1.7.4. SWOT Analysis
- 12.1.8 Pokemon
- 12.1.8.1. Company Overview
- 12.1.8.2. Products
- 12.1.8.3. Company Financials
- 12.1.8.4. SWOT Analysis
- 12.1.9 Tencent
- 12.1.9.1. Company Overview
- 12.1.9.2. Products
- 12.1.9.3. Company Financials
- 12.1.9.4. SWOT Analysis
- 12.1.10 Netease
- 12.1.10.1. Company Overview
- 12.1.10.2. Products
- 12.1.10.3. Company Financials
- 12.1.10.4. SWOT Analysis
- 12.1.11 Yoka Games
- 12.1.11.1. Company Overview
- 12.1.11.2. Products
- 12.1.11.3. Company Financials
- 12.1.11.4. SWOT Analysis
- 12.1.1 Konami
- 12.2. Market Entropy
- 12.2.1 Company's Key Areas Served
- 12.2.2 Recent Developments
- 12.3. Company Market Share Analysis 2025
- 12.3.1 Top 5 Companies Market Share Analysis
- 12.3.2 Top 3 Companies Market Share Analysis
- 12.4. List of Potential Customers
- 13. Research Methodology
List of Figures
- Figure 1: Global Mobile Card Games Revenue Breakdown (million, %) by Region 2025 & 2033
- Figure 2: North America Mobile Card Games Revenue (million), by Application 2025 & 2033
- Figure 3: North America Mobile Card Games Revenue Share (%), by Application 2025 & 2033
- Figure 4: North America Mobile Card Games Revenue (million), by Type 2025 & 2033
- Figure 5: North America Mobile Card Games Revenue Share (%), by Type 2025 & 2033
- Figure 6: North America Mobile Card Games Revenue (million), by Country 2025 & 2033
- Figure 7: North America Mobile Card Games Revenue Share (%), by Country 2025 & 2033
- Figure 8: South America Mobile Card Games Revenue (million), by Application 2025 & 2033
- Figure 9: South America Mobile Card Games Revenue Share (%), by Application 2025 & 2033
- Figure 10: South America Mobile Card Games Revenue (million), by Type 2025 & 2033
- Figure 11: South America Mobile Card Games Revenue Share (%), by Type 2025 & 2033
- Figure 12: South America Mobile Card Games Revenue (million), by Country 2025 & 2033
- Figure 13: South America Mobile Card Games Revenue Share (%), by Country 2025 & 2033
- Figure 14: Europe Mobile Card Games Revenue (million), by Application 2025 & 2033
- Figure 15: Europe Mobile Card Games Revenue Share (%), by Application 2025 & 2033
- Figure 16: Europe Mobile Card Games Revenue (million), by Type 2025 & 2033
- Figure 17: Europe Mobile Card Games Revenue Share (%), by Type 2025 & 2033
- Figure 18: Europe Mobile Card Games Revenue (million), by Country 2025 & 2033
- Figure 19: Europe Mobile Card Games Revenue Share (%), by Country 2025 & 2033
- Figure 20: Middle East & Africa Mobile Card Games Revenue (million), by Application 2025 & 2033
- Figure 21: Middle East & Africa Mobile Card Games Revenue Share (%), by Application 2025 & 2033
- Figure 22: Middle East & Africa Mobile Card Games Revenue (million), by Type 2025 & 2033
- Figure 23: Middle East & Africa Mobile Card Games Revenue Share (%), by Type 2025 & 2033
- Figure 24: Middle East & Africa Mobile Card Games Revenue (million), by Country 2025 & 2033
- Figure 25: Middle East & Africa Mobile Card Games Revenue Share (%), by Country 2025 & 2033
- Figure 26: Asia Pacific Mobile Card Games Revenue (million), by Application 2025 & 2033
- Figure 27: Asia Pacific Mobile Card Games Revenue Share (%), by Application 2025 & 2033
- Figure 28: Asia Pacific Mobile Card Games Revenue (million), by Type 2025 & 2033
- Figure 29: Asia Pacific Mobile Card Games Revenue Share (%), by Type 2025 & 2033
- Figure 30: Asia Pacific Mobile Card Games Revenue (million), by Country 2025 & 2033
- Figure 31: Asia Pacific Mobile Card Games Revenue Share (%), by Country 2025 & 2033
List of Tables
- Table 1: Global Mobile Card Games Revenue million Forecast, by Application 2020 & 2033
- Table 2: Global Mobile Card Games Revenue million Forecast, by Type 2020 & 2033
- Table 3: Global Mobile Card Games Revenue million Forecast, by Region 2020 & 2033
- Table 4: Global Mobile Card Games Revenue million Forecast, by Application 2020 & 2033
- Table 5: Global Mobile Card Games Revenue million Forecast, by Type 2020 & 2033
- Table 6: Global Mobile Card Games Revenue million Forecast, by Country 2020 & 2033
- Table 7: United States Mobile Card Games Revenue (million) Forecast, by Application 2020 & 2033
- Table 8: Canada Mobile Card Games Revenue (million) Forecast, by Application 2020 & 2033
- Table 9: Mexico Mobile Card Games Revenue (million) Forecast, by Application 2020 & 2033
- Table 10: Global Mobile Card Games Revenue million Forecast, by Application 2020 & 2033
- Table 11: Global Mobile Card Games Revenue million Forecast, by Type 2020 & 2033
- Table 12: Global Mobile Card Games Revenue million Forecast, by Country 2020 & 2033
- Table 13: Brazil Mobile Card Games Revenue (million) Forecast, by Application 2020 & 2033
- Table 14: Argentina Mobile Card Games Revenue (million) Forecast, by Application 2020 & 2033
- Table 15: Rest of South America Mobile Card Games Revenue (million) Forecast, by Application 2020 & 2033
- Table 16: Global Mobile Card Games Revenue million Forecast, by Application 2020 & 2033
- Table 17: Global Mobile Card Games Revenue million Forecast, by Type 2020 & 2033
- Table 18: Global Mobile Card Games Revenue million Forecast, by Country 2020 & 2033
- Table 19: United Kingdom Mobile Card Games Revenue (million) Forecast, by Application 2020 & 2033
- Table 20: Germany Mobile Card Games Revenue (million) Forecast, by Application 2020 & 2033
- Table 21: France Mobile Card Games Revenue (million) Forecast, by Application 2020 & 2033
- Table 22: Italy Mobile Card Games Revenue (million) Forecast, by Application 2020 & 2033
- Table 23: Spain Mobile Card Games Revenue (million) Forecast, by Application 2020 & 2033
- Table 24: Russia Mobile Card Games Revenue (million) Forecast, by Application 2020 & 2033
- Table 25: Benelux Mobile Card Games Revenue (million) Forecast, by Application 2020 & 2033
- Table 26: Nordics Mobile Card Games Revenue (million) Forecast, by Application 2020 & 2033
- Table 27: Rest of Europe Mobile Card Games Revenue (million) Forecast, by Application 2020 & 2033
- Table 28: Global Mobile Card Games Revenue million Forecast, by Application 2020 & 2033
- Table 29: Global Mobile Card Games Revenue million Forecast, by Type 2020 & 2033
- Table 30: Global Mobile Card Games Revenue million Forecast, by Country 2020 & 2033
- Table 31: Turkey Mobile Card Games Revenue (million) Forecast, by Application 2020 & 2033
- Table 32: Israel Mobile Card Games Revenue (million) Forecast, by Application 2020 & 2033
- Table 33: GCC Mobile Card Games Revenue (million) Forecast, by Application 2020 & 2033
- Table 34: North Africa Mobile Card Games Revenue (million) Forecast, by Application 2020 & 2033
- Table 35: South Africa Mobile Card Games Revenue (million) Forecast, by Application 2020 & 2033
- Table 36: Rest of Middle East & Africa Mobile Card Games Revenue (million) Forecast, by Application 2020 & 2033
- Table 37: Global Mobile Card Games Revenue million Forecast, by Application 2020 & 2033
- Table 38: Global Mobile Card Games Revenue million Forecast, by Type 2020 & 2033
- Table 39: Global Mobile Card Games Revenue million Forecast, by Country 2020 & 2033
- Table 40: China Mobile Card Games Revenue (million) Forecast, by Application 2020 & 2033
- Table 41: India Mobile Card Games Revenue (million) Forecast, by Application 2020 & 2033
- Table 42: Japan Mobile Card Games Revenue (million) Forecast, by Application 2020 & 2033
- Table 43: South Korea Mobile Card Games Revenue (million) Forecast, by Application 2020 & 2033
- Table 44: ASEAN Mobile Card Games Revenue (million) Forecast, by Application 2020 & 2033
- Table 45: Oceania Mobile Card Games Revenue (million) Forecast, by Application 2020 & 2033
- Table 46: Rest of Asia Pacific Mobile Card Games Revenue (million) Forecast, by Application 2020 & 2033
Frequently Asked Questions
1. What is the projected Compound Annual Growth Rate (CAGR) of the Mobile Card Games?
The projected CAGR is approximately 9.6%.
2. Which companies are prominent players in the Mobile Card Games?
Key companies in the market include Konami, Nuverse, Cygames, Wizards of the Coast, 2K Games, Blizzard Entertainment, Riot Game, Pokemon, Tencent, Netease, Yoka Games.
3. What are the main segments of the Mobile Card Games?
The market segments include Application, Type.
4. Can you provide details about the market size?
The market size is estimated to be USD 4269 million as of 2022.
5. What are some drivers contributing to market growth?
N/A
6. What are the notable trends driving market growth?
N/A
7. Are there any restraints impacting market growth?
N/A
8. Can you provide examples of recent developments in the market?
N/A
9. What pricing options are available for accessing the report?
Pricing options include single-user, multi-user, and enterprise licenses priced at USD 2900.00, USD 4350.00, and USD 5800.00 respectively.
10. Is the market size provided in terms of value or volume?
The market size is provided in terms of value, measured in million.
11. Are there any specific market keywords associated with the report?
Yes, the market keyword associated with the report is "Mobile Card Games," which aids in identifying and referencing the specific market segment covered.
12. How do I determine which pricing option suits my needs best?
The pricing options vary based on user requirements and access needs. Individual users may opt for single-user licenses, while businesses requiring broader access may choose multi-user or enterprise licenses for cost-effective access to the report.
13. Are there any additional resources or data provided in the Mobile Card Games report?
While the report offers comprehensive insights, it's advisable to review the specific contents or supplementary materials provided to ascertain if additional resources or data are available.
14. How can I stay updated on further developments or reports in the Mobile Card Games?
To stay informed about further developments, trends, and reports in the Mobile Card Games, consider subscribing to industry newsletters, following relevant companies and organizations, or regularly checking reputable industry news sources and publications.
Methodology
Step 1 - Identification of Relevant Samples Size from Population Database


Step 2 - Approaches for Defining Global Market Size (Value, Volume* & Price*)

Note*: In applicable scenarios
Step 3 - Data Sources
Primary Research
- Web Analytics
- Survey Reports
- Research Institute
- Latest Research Reports
- Opinion Leaders
Secondary Research
- Annual Reports
- White Paper
- Latest Press Release
- Industry Association
- Paid Database
- Investor Presentations

Step 4 - Data Triangulation
Involves using different sources of information in order to increase the validity of a study
These sources are likely to be stakeholders in a program - participants, other researchers, program staff, other community members, and so on.
Then we put all data in single framework & apply various statistical tools to find out the dynamic on the market.
During the analysis stage, feedback from the stakeholder groups would be compared to determine areas of agreement as well as areas of divergence