

Key Insights
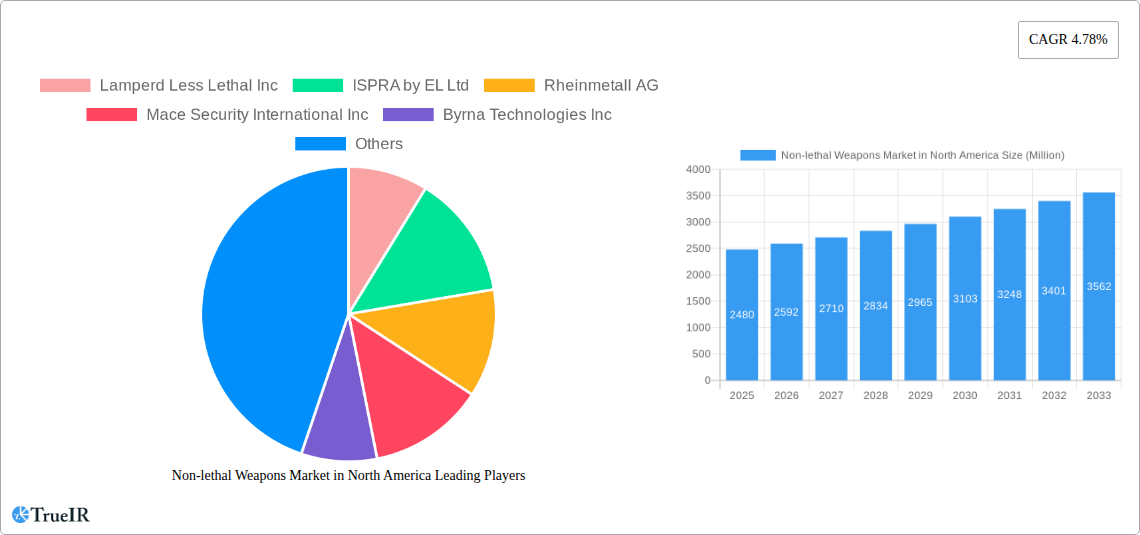
The North American non-lethal weapons market, valued at $2.48 billion in 2025, is projected to experience robust growth, driven by increasing demand from law enforcement and military agencies. This growth is fueled by several key factors. Firstly, a rising preference for less-lethal options to minimize casualties and collateral damage during crowd control and conflict situations is significantly impacting market expansion. Secondly, technological advancements in non-lethal weaponry, such as improved accuracy and effectiveness of pepper sprays and tasers, are leading to wider adoption. Furthermore, stringent regulations regarding the use of lethal force are pushing agencies to adopt more humane alternatives. The market is segmented by weapon type (sponge grenades, sting grenades, pepper sprays, electroshock weapons), application (law enforcement, military), and deployment method (area denial, anti-personnel). The market's growth is expected to be particularly strong within law enforcement, driven by the need for effective tools to manage civil unrest and high-risk situations while minimizing the risk of fatalities. This segment is likely to benefit from innovations in less-lethal ammunition and delivery systems.
Despite the positive outlook, the market faces certain restraints. The high cost associated with procuring and maintaining advanced non-lethal weapons could hinder growth, particularly for smaller agencies. Additionally, concerns regarding the potential for misuse and the ethical implications of certain non-lethal technologies necessitate careful regulation and ongoing dialogue. Nevertheless, the overall market trajectory remains positive, driven by a combination of technological advancements and a growing emphasis on minimizing harm in conflict and public safety scenarios. The continuous development of sophisticated, effective, and ethically sound non-lethal weaponry is expected to ensure sustained market expansion throughout the forecast period (2025-2033). Key players such as Axon Enterprise, Safariland, and Rheinmetall AG are expected to maintain their competitive edge through R&D and strategic partnerships.
Non-lethal Weapons Market in North America: A Comprehensive Market Report (2019-2033)
This in-depth report provides a comprehensive analysis of the Non-lethal Weapons Market in North America, covering market size, growth trends, competitive landscape, and future outlook from 2019 to 2033. The study period spans 2019-2033, with 2025 as the base and estimated year. The forecast period is 2025-2033, and the historical period is 2019-2024. This report is crucial for stakeholders seeking to understand this dynamic market and make informed strategic decisions.
Non-lethal Weapons Market in North America Market Structure & Competitive Landscape
The North American non-lethal weapons market exhibits a moderately concentrated structure, with several key players dominating specific segments. The market is characterized by ongoing innovation, driven by advancements in directed energy weapons, electroshock devices, and chemical agents. Stringent regulations regarding the use and sale of non-lethal weapons significantly influence market dynamics. Product substitutes, such as physical restraints and de-escalation techniques, pose competitive pressures. The end-user segment is primarily divided between law enforcement and military applications, with law enforcement currently holding the larger market share. Mergers and acquisitions (M&A) activity has been relatively moderate in recent years, with a total estimated value of xx Million in the period 2019-2024, primarily driven by companies seeking to expand their product portfolio and geographical reach. Concentration ratios show a xx% market share held by the top 5 players in 2024.
- High Barriers to Entry: Significant R&D investment, stringent regulatory approvals, and specialized manufacturing capabilities create high barriers to entry.
- Technological Advancements: Continuous innovation in less-lethal technologies fuels market growth.
- Regulatory Scrutiny: Government regulations regarding the use and deployment of non-lethal weapons impact market expansion.
- Substitute Products: The availability of alternative crowd control measures and de-escalation techniques limits market growth.
- End-User Segmentation: Demand from Law Enforcement and Military sectors drives market growth.
- M&A Activity: Recent consolidation activity focuses on expanding product portfolios and market reach.
Non-lethal Weapons Market in North America Market Trends & Opportunities
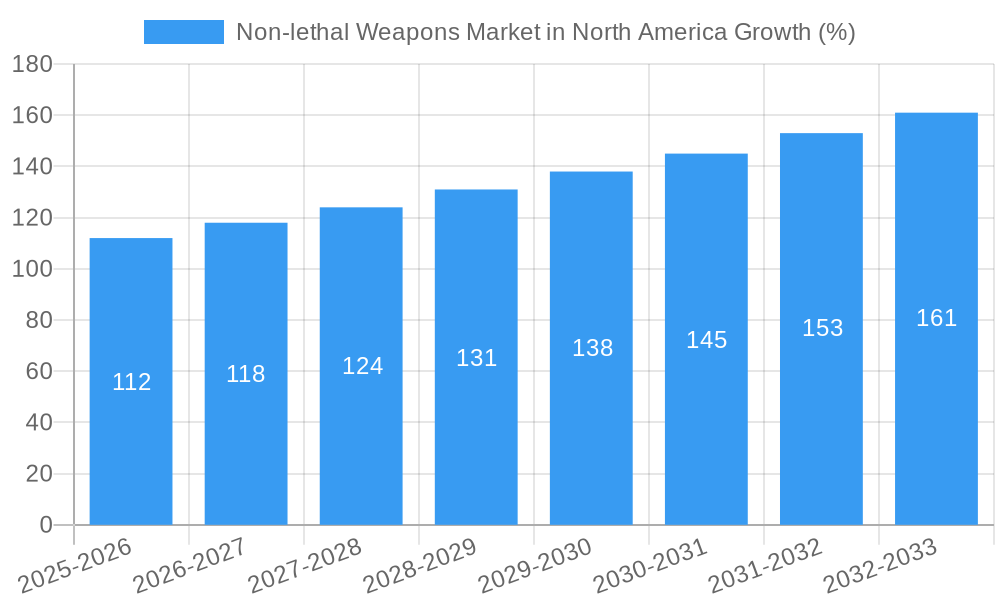
The North American non-lethal weapons market is experiencing significant growth, with a projected Compound Annual Growth Rate (CAGR) of xx% from 2025 to 2033. This expansion is primarily fueled by rising demand from law enforcement agencies seeking safer alternatives to lethal force, increasing military spending on non-lethal technologies, and advancements in less-lethal weapons technology. The market penetration rate for non-lethal weapons within law enforcement agencies stands at approximately xx% in 2025, with potential for substantial growth as agencies prioritize less-lethal options. Consumer preferences are shifting towards non-lethal solutions that are both effective and minimize long-term harm to civilians. The competitive landscape is characterized by intense rivalry among established players and emerging companies, driving innovation and price competition.
Dominant Markets & Segments in Non-lethal Weapons Market in North America
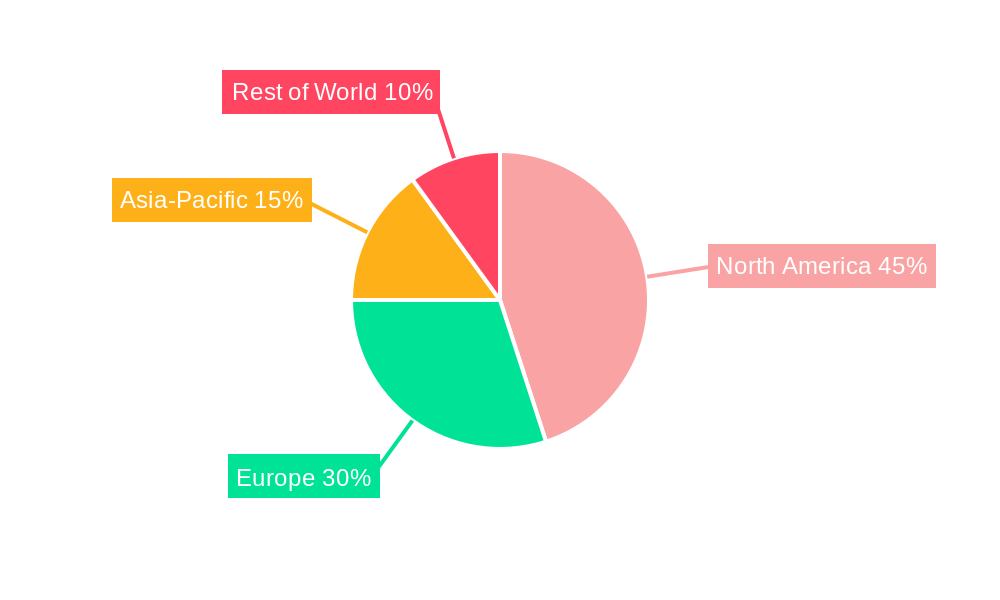
The United States represents the dominant market within North America, accounting for xx% of the total market value in 2024. Significant growth is anticipated in Canada and Mexico, driven by increased government spending and rising demand from law enforcement.
Leading Segments:
- Application: Law Enforcement (xx Million in 2024, xx% Market Share) currently dominates, followed by Military (xx Million in 2024, xx% Market Share).
- Type: Anti-personnel ammunition holds the largest market share (xx% in 2024) due to widespread adoption by law enforcement. Area denial systems are experiencing a high growth rate.
- Product: Pepper sprays show high market penetration (xx% in 2024), followed by electroshock weapons and sting grenades. Sponge grenades hold a smaller market share but exhibit potential for growth.
Key Growth Drivers:
- Increased Government Funding: Rising budgets allocated to public safety and national defense fuel market growth.
- Emphasis on De-escalation Tactics: Law enforcement's focus on minimizing harm is driving adoption of non-lethal options.
- Technological Advancements: Development of sophisticated and effective non-lethal technologies enhances market appeal.
Non-lethal Weapons Market in North America Product Analysis
Recent innovations include non-lethal firearms that mimic traditional firearms in design and handling, while utilizing pepper projectiles. The market also sees advancements in non-lethal shotgun shells compatible with standard shotguns, alongside specialized pepper ball launchers offering increased range and accuracy. These innovations improve user familiarity and enhance tactical flexibility, contributing to broader market acceptance. Competitive advantages are gained through improved accuracy, range, effectiveness, and reduced collateral damage potential.
Key Drivers, Barriers & Challenges in Non-lethal Weapons Market in North America
Key Drivers: Technological advancements, such as improved accuracy and range in pepper spray and electroshock devices, are pushing market growth. Rising government spending on public safety and defense budgets also contributes significantly. Favorable regulatory environments in certain regions also facilitate market expansion.
Challenges: Stringent regulatory approvals and liability concerns for manufacturers significantly impede market growth. Supply chain disruptions can impact the timely availability of components, affecting production and sales. Intense competition among established and emerging players further creates pricing pressures, limiting profitability for some companies. The perceived effectiveness of non-lethal weapons relative to lethal alternatives influences adoption rates. The estimated annual loss due to regulatory hurdles is xx Million.
Growth Drivers in the Non-lethal Weapons Market in North America Market
The market is driven by increasing demand from law enforcement agencies aiming to reduce lethal force incidents, coupled with technological advancements leading to more effective and safer non-lethal weapons. Government investments in national security and public safety are also key drivers. The growing need for crowd control solutions in urban environments and during protests fuels market demand.
Challenges Impacting Non-lethal Weapons Market in North America Growth
High manufacturing costs, stringent regulations, and potential legal liabilities related to the use of non-lethal weapons pose significant challenges. The perception of efficacy can also be a hurdle for adoption. Supply chain complexities and potential for misuse can further hinder market expansion.
Key Players Shaping the Non-lethal Weapons Market in North America Market
- Lamperd Less Lethal Inc
- Ispra by EL Ltd
- Rheinmetall AG
- Mace Security International Inc
- Byrna Technologies Inc
- Condor Non-Lethal Technologies
- Pepperball Technologies Inc (UTS United Tactical Systems LLC)
- NonLethal Technologies Inc
- Zarc International Inc
- Axon Enterprise Inc
- Armament Systems & Procedures Inc
- PACEM Solutions International
- Combined Systems Inc
- Herstal Group
- Bruzer Less Lethal
- Safariland LLC
Significant Non-lethal Weapons Market in North America Industry Milestones
- August 2023: Byrna Technologies launches a non-lethal firearm and a non-lethal shotgun shell, expanding product offerings and market reach.
- March 2023: Guard Dog Security introduces the Fireball, a new pepper ball launcher, increasing competition and improving product diversity.
- August 2022: Applied Research Associates secures a USD 48 Million contract for non-lethal weapon R&D, signifying increased investment in the sector and technological advancements.
Future Outlook for Non-lethal Weapons Market in North America Market
The North American non-lethal weapons market is poised for continued growth, driven by technological advancements, increased government spending, and the growing need for effective and safe crowd control solutions. Strategic partnerships and collaborations among key players will further accelerate market expansion. The focus on less-lethal solutions with improved accuracy, range, and reduced collateral damage will enhance market potential. The market is expected to reach xx Million by 2033.
Non-lethal Weapons Market in North America Segmentation
-
1. Type
-
1.1. Area Denial
- 1.1.1. Anti-vehicle
- 1.1.2. Anti-personnel
-
1.2. Ammunition
- 1.2.1. Rubber Bullets
- 1.2.2. Wax Bullets
- 1.2.3. Plastic Bullets
- 1.2.4. Bean Bag Rounds
- 1.2.5. Sponge Grenade
-
1.3. Explosives
- 1.3.1. Flash Bang Grenades
- 1.3.2. Sting Grenads
-
1.4. Gases and Sprays
- 1.4.1. Water Canons
- 1.4.2. Scent-based Weapons
- 1.4.3. Teargas
- 1.4.4. Pepper Sprays
- 1.5. Directed Energy Weapons
- 1.6. Electroshock Weapons
-
1.1. Area Denial
-
2. Application
- 2.1. Law Enforcement
- 2.2. Military
-
3. Geography
- 3.1. United States
- 3.2. Canada
Non-lethal Weapons Market in North America Segmentation By Geography
- 1. United States
- 2. Canada
Non-lethal Weapons Market in North America REPORT HIGHLIGHTS
| Aspects | Details |
|---|---|
| Study Period | 2019-2033 |
| Base Year | 2024 |
| Estimated Year | 2025 |
| Forecast Period | 2025-2033 |
| Historical Period | 2019-2024 |
| Growth Rate | CAGR of 4.78% from 2019-2033 |
| Segmentation |
|
Table of Contents
- 1. Introduction
- 1.1. Research Scope
- 1.2. Market Segmentation
- 1.3. Research Methodology
- 1.4. Definitions and Assumptions
- 2. Executive Summary
- 2.1. Introduction
- 3. Market Dynamics
- 3.1. Introduction
- 3.2. Market Drivers
- 3.3. Market Restrains
- 3.4. Market Trends
- 3.4.1. Ammunition Segment to Register the Highest CAGR During the Forecast Period
- 4. Market Factor Analysis
- 4.1. Porters Five Forces
- 4.2. Supply/Value Chain
- 4.3. PESTEL analysis
- 4.4. Market Entropy
- 4.5. Patent/Trademark Analysis
- 5. Non-lethal Weapons Market in North America Analysis, Insights and Forecast, 2019-2031
- 5.1. Market Analysis, Insights and Forecast - by Type
- 5.1.1. Area Denial
- 5.1.1.1. Anti-vehicle
- 5.1.1.2. Anti-personnel
- 5.1.2. Ammunition
- 5.1.2.1. Rubber Bullets
- 5.1.2.2. Wax Bullets
- 5.1.2.3. Plastic Bullets
- 5.1.2.4. Bean Bag Rounds
- 5.1.2.5. Sponge Grenade
- 5.1.3. Explosives
- 5.1.3.1. Flash Bang Grenades
- 5.1.3.2. Sting Grenads
- 5.1.4. Gases and Sprays
- 5.1.4.1. Water Canons
- 5.1.4.2. Scent-based Weapons
- 5.1.4.3. Teargas
- 5.1.4.4. Pepper Sprays
- 5.1.5. Directed Energy Weapons
- 5.1.6. Electroshock Weapons
- 5.1.1. Area Denial
- 5.2. Market Analysis, Insights and Forecast - by Application
- 5.2.1. Law Enforcement
- 5.2.2. Military
- 5.3. Market Analysis, Insights and Forecast - by Geography
- 5.3.1. United States
- 5.3.2. Canada
- 5.4. Market Analysis, Insights and Forecast - by Region
- 5.4.1. United States
- 5.4.2. Canada
- 5.1. Market Analysis, Insights and Forecast - by Type
- 6. United States Non-lethal Weapons Market in North America Analysis, Insights and Forecast, 2019-2031
- 6.1. Market Analysis, Insights and Forecast - by Type
- 6.1.1. Area Denial
- 6.1.1.1. Anti-vehicle
- 6.1.1.2. Anti-personnel
- 6.1.2. Ammunition
- 6.1.2.1. Rubber Bullets
- 6.1.2.2. Wax Bullets
- 6.1.2.3. Plastic Bullets
- 6.1.2.4. Bean Bag Rounds
- 6.1.2.5. Sponge Grenade
- 6.1.3. Explosives
- 6.1.3.1. Flash Bang Grenades
- 6.1.3.2. Sting Grenads
- 6.1.4. Gases and Sprays
- 6.1.4.1. Water Canons
- 6.1.4.2. Scent-based Weapons
- 6.1.4.3. Teargas
- 6.1.4.4. Pepper Sprays
- 6.1.5. Directed Energy Weapons
- 6.1.6. Electroshock Weapons
- 6.1.1. Area Denial
- 6.2. Market Analysis, Insights and Forecast - by Application
- 6.2.1. Law Enforcement
- 6.2.2. Military
- 6.3. Market Analysis, Insights and Forecast - by Geography
- 6.3.1. United States
- 6.3.2. Canada
- 6.1. Market Analysis, Insights and Forecast - by Type
- 7. Canada Non-lethal Weapons Market in North America Analysis, Insights and Forecast, 2019-2031
- 7.1. Market Analysis, Insights and Forecast - by Type
- 7.1.1. Area Denial
- 7.1.1.1. Anti-vehicle
- 7.1.1.2. Anti-personnel
- 7.1.2. Ammunition
- 7.1.2.1. Rubber Bullets
- 7.1.2.2. Wax Bullets
- 7.1.2.3. Plastic Bullets
- 7.1.2.4. Bean Bag Rounds
- 7.1.2.5. Sponge Grenade
- 7.1.3. Explosives
- 7.1.3.1. Flash Bang Grenades
- 7.1.3.2. Sting Grenads
- 7.1.4. Gases and Sprays
- 7.1.4.1. Water Canons
- 7.1.4.2. Scent-based Weapons
- 7.1.4.3. Teargas
- 7.1.4.4. Pepper Sprays
- 7.1.5. Directed Energy Weapons
- 7.1.6. Electroshock Weapons
- 7.1.1. Area Denial
- 7.2. Market Analysis, Insights and Forecast - by Application
- 7.2.1. Law Enforcement
- 7.2.2. Military
- 7.3. Market Analysis, Insights and Forecast - by Geography
- 7.3.1. United States
- 7.3.2. Canada
- 7.1. Market Analysis, Insights and Forecast - by Type
- 8. United States Non-lethal Weapons Market in North America Analysis, Insights and Forecast, 2019-2031
- 9. Canada Non-lethal Weapons Market in North America Analysis, Insights and Forecast, 2019-2031
- 10. Mexico Non-lethal Weapons Market in North America Analysis, Insights and Forecast, 2019-2031
- 11. Rest of North America Non-lethal Weapons Market in North America Analysis, Insights and Forecast, 2019-2031
- 12. Competitive Analysis
- 12.1. Market Share Analysis 2024
- 12.2. Company Profiles
- 12.2.1 Lamperd Less Lethal Inc
- 12.2.1.1. Overview
- 12.2.1.2. Products
- 12.2.1.3. SWOT Analysis
- 12.2.1.4. Recent Developments
- 12.2.1.5. Financials (Based on Availability)
- 12.2.2 ISPRA by EL Ltd
- 12.2.2.1. Overview
- 12.2.2.2. Products
- 12.2.2.3. SWOT Analysis
- 12.2.2.4. Recent Developments
- 12.2.2.5. Financials (Based on Availability)
- 12.2.3 Rheinmetall AG
- 12.2.3.1. Overview
- 12.2.3.2. Products
- 12.2.3.3. SWOT Analysis
- 12.2.3.4. Recent Developments
- 12.2.3.5. Financials (Based on Availability)
- 12.2.4 Mace Security International Inc
- 12.2.4.1. Overview
- 12.2.4.2. Products
- 12.2.4.3. SWOT Analysis
- 12.2.4.4. Recent Developments
- 12.2.4.5. Financials (Based on Availability)
- 12.2.5 Byrna Technologies Inc
- 12.2.5.1. Overview
- 12.2.5.2. Products
- 12.2.5.3. SWOT Analysis
- 12.2.5.4. Recent Developments
- 12.2.5.5. Financials (Based on Availability)
- 12.2.6 Condor Non-Lethal Technologies
- 12.2.6.1. Overview
- 12.2.6.2. Products
- 12.2.6.3. SWOT Analysis
- 12.2.6.4. Recent Developments
- 12.2.6.5. Financials (Based on Availability)
- 12.2.7 Pepperball Technologies Inc (UTS United Tactical Systems LLC)
- 12.2.7.1. Overview
- 12.2.7.2. Products
- 12.2.7.3. SWOT Analysis
- 12.2.7.4. Recent Developments
- 12.2.7.5. Financials (Based on Availability)
- 12.2.8 NonLethal Technologies Inc
- 12.2.8.1. Overview
- 12.2.8.2. Products
- 12.2.8.3. SWOT Analysis
- 12.2.8.4. Recent Developments
- 12.2.8.5. Financials (Based on Availability)
- 12.2.9 Zarc International Inc
- 12.2.9.1. Overview
- 12.2.9.2. Products
- 12.2.9.3. SWOT Analysis
- 12.2.9.4. Recent Developments
- 12.2.9.5. Financials (Based on Availability)
- 12.2.10 Axon Enterprise Inc
- 12.2.10.1. Overview
- 12.2.10.2. Products
- 12.2.10.3. SWOT Analysis
- 12.2.10.4. Recent Developments
- 12.2.10.5. Financials (Based on Availability)
- 12.2.11 Armament Systems & Procedures Inc
- 12.2.11.1. Overview
- 12.2.11.2. Products
- 12.2.11.3. SWOT Analysis
- 12.2.11.4. Recent Developments
- 12.2.11.5. Financials (Based on Availability)
- 12.2.12 PACEM Solutions International
- 12.2.12.1. Overview
- 12.2.12.2. Products
- 12.2.12.3. SWOT Analysis
- 12.2.12.4. Recent Developments
- 12.2.12.5. Financials (Based on Availability)
- 12.2.13 Combined Systems Inc
- 12.2.13.1. Overview
- 12.2.13.2. Products
- 12.2.13.3. SWOT Analysis
- 12.2.13.4. Recent Developments
- 12.2.13.5. Financials (Based on Availability)
- 12.2.14 Herstal Group
- 12.2.14.1. Overview
- 12.2.14.2. Products
- 12.2.14.3. SWOT Analysis
- 12.2.14.4. Recent Developments
- 12.2.14.5. Financials (Based on Availability)
- 12.2.15 Bruzer Less Lethal
- 12.2.15.1. Overview
- 12.2.15.2. Products
- 12.2.15.3. SWOT Analysis
- 12.2.15.4. Recent Developments
- 12.2.15.5. Financials (Based on Availability)
- 12.2.16 Safariland LLC
- 12.2.16.1. Overview
- 12.2.16.2. Products
- 12.2.16.3. SWOT Analysis
- 12.2.16.4. Recent Developments
- 12.2.16.5. Financials (Based on Availability)
- 12.2.1 Lamperd Less Lethal Inc
List of Figures
- Figure 1: Non-lethal Weapons Market in North America Revenue Breakdown (Million, %) by Product 2024 & 2032
- Figure 2: Non-lethal Weapons Market in North America Share (%) by Company 2024
List of Tables
- Table 1: Non-lethal Weapons Market in North America Revenue Million Forecast, by Region 2019 & 2032
- Table 2: Non-lethal Weapons Market in North America Revenue Million Forecast, by Type 2019 & 2032
- Table 3: Non-lethal Weapons Market in North America Revenue Million Forecast, by Application 2019 & 2032
- Table 4: Non-lethal Weapons Market in North America Revenue Million Forecast, by Geography 2019 & 2032
- Table 5: Non-lethal Weapons Market in North America Revenue Million Forecast, by Region 2019 & 2032
- Table 6: Non-lethal Weapons Market in North America Revenue Million Forecast, by Country 2019 & 2032
- Table 7: United States Non-lethal Weapons Market in North America Revenue (Million) Forecast, by Application 2019 & 2032
- Table 8: Canada Non-lethal Weapons Market in North America Revenue (Million) Forecast, by Application 2019 & 2032
- Table 9: Mexico Non-lethal Weapons Market in North America Revenue (Million) Forecast, by Application 2019 & 2032
- Table 10: Rest of North America Non-lethal Weapons Market in North America Revenue (Million) Forecast, by Application 2019 & 2032
- Table 11: Non-lethal Weapons Market in North America Revenue Million Forecast, by Type 2019 & 2032
- Table 12: Non-lethal Weapons Market in North America Revenue Million Forecast, by Application 2019 & 2032
- Table 13: Non-lethal Weapons Market in North America Revenue Million Forecast, by Geography 2019 & 2032
- Table 14: Non-lethal Weapons Market in North America Revenue Million Forecast, by Country 2019 & 2032
- Table 15: Non-lethal Weapons Market in North America Revenue Million Forecast, by Type 2019 & 2032
- Table 16: Non-lethal Weapons Market in North America Revenue Million Forecast, by Application 2019 & 2032
- Table 17: Non-lethal Weapons Market in North America Revenue Million Forecast, by Geography 2019 & 2032
- Table 18: Non-lethal Weapons Market in North America Revenue Million Forecast, by Country 2019 & 2032
Frequently Asked Questions
1. What is the projected Compound Annual Growth Rate (CAGR) of the Non-lethal Weapons Market in North America?
The projected CAGR is approximately 4.78%.
2. Which companies are prominent players in the Non-lethal Weapons Market in North America?
Key companies in the market include Lamperd Less Lethal Inc, ISPRA by EL Ltd, Rheinmetall AG, Mace Security International Inc, Byrna Technologies Inc, Condor Non-Lethal Technologies, Pepperball Technologies Inc (UTS United Tactical Systems LLC), NonLethal Technologies Inc, Zarc International Inc, Axon Enterprise Inc, Armament Systems & Procedures Inc, PACEM Solutions International, Combined Systems Inc, Herstal Group, Bruzer Less Lethal, Safariland LLC.
3. What are the main segments of the Non-lethal Weapons Market in North America?
The market segments include Type, Application, Geography.
4. Can you provide details about the market size?
The market size is estimated to be USD 2.48 Million as of 2022.
5. What are some drivers contributing to market growth?
N/A
6. What are the notable trends driving market growth?
Ammunition Segment to Register the Highest CAGR During the Forecast Period.
7. Are there any restraints impacting market growth?
N/A
8. Can you provide examples of recent developments in the market?
August 2023: Byrna Technologies announced the launch of its non-lethal firearm modeled after a traditional firearm and can shoot pepper projectiles. In addition, Byrna Technologies has developed a non-lethal shotgun shell, which can be used in any shotgun in combination with regular lethal shotgun shells.
9. What pricing options are available for accessing the report?
Pricing options include single-user, multi-user, and enterprise licenses priced at USD 4750, USD 5250, and USD 8750 respectively.
10. Is the market size provided in terms of value or volume?
The market size is provided in terms of value, measured in Million.
11. Are there any specific market keywords associated with the report?
Yes, the market keyword associated with the report is "Non-lethal Weapons Market in North America," which aids in identifying and referencing the specific market segment covered.
12. How do I determine which pricing option suits my needs best?
The pricing options vary based on user requirements and access needs. Individual users may opt for single-user licenses, while businesses requiring broader access may choose multi-user or enterprise licenses for cost-effective access to the report.
13. Are there any additional resources or data provided in the Non-lethal Weapons Market in North America report?
While the report offers comprehensive insights, it's advisable to review the specific contents or supplementary materials provided to ascertain if additional resources or data are available.
14. How can I stay updated on further developments or reports in the Non-lethal Weapons Market in North America?
To stay informed about further developments, trends, and reports in the Non-lethal Weapons Market in North America, consider subscribing to industry newsletters, following relevant companies and organizations, or regularly checking reputable industry news sources and publications.
Methodology
Step 1 - Identification of Relevant Samples Size from Population Database


Step 2 - Approaches for Defining Global Market Size (Value, Volume* & Price*)

Note*: In applicable scenarios
Step 3 - Data Sources
Primary Research
- Web Analytics
- Survey Reports
- Research Institute
- Latest Research Reports
- Opinion Leaders
Secondary Research
- Annual Reports
- White Paper
- Latest Press Release
- Industry Association
- Paid Database
- Investor Presentations

Step 4 - Data Triangulation
Involves using different sources of information in order to increase the validity of a study
These sources are likely to be stakeholders in a program - participants, other researchers, program staff, other community members, and so on.
Then we put all data in single framework & apply various statistical tools to find out the dynamic on the market.
During the analysis stage, feedback from the stakeholder groups would be compared to determine areas of agreement as well as areas of divergence
