

Key Insights
The global oranges market is poised for robust growth, projected to reach a significant $55.3 billion in 2025, with an estimated compound annual growth rate (CAGR) of 3.4% from 2019 to 2033. This expansion is primarily fueled by increasing consumer demand for healthy and natural food products, with a particular emphasis on citrus fruits due to their rich vitamin C content and antioxidant properties. The growing popularity of fresh juices and functional beverages, coupled with the versatility of orange products in culinary applications, further propels market expansion. Key applications such as juice and concentrate are expected to witness sustained demand, while the powdered form is gaining traction for its convenience and longer shelf life, especially in the food and beverage industry. Innovations in processing technologies and the development of new product formulations are also contributing to market dynamics.
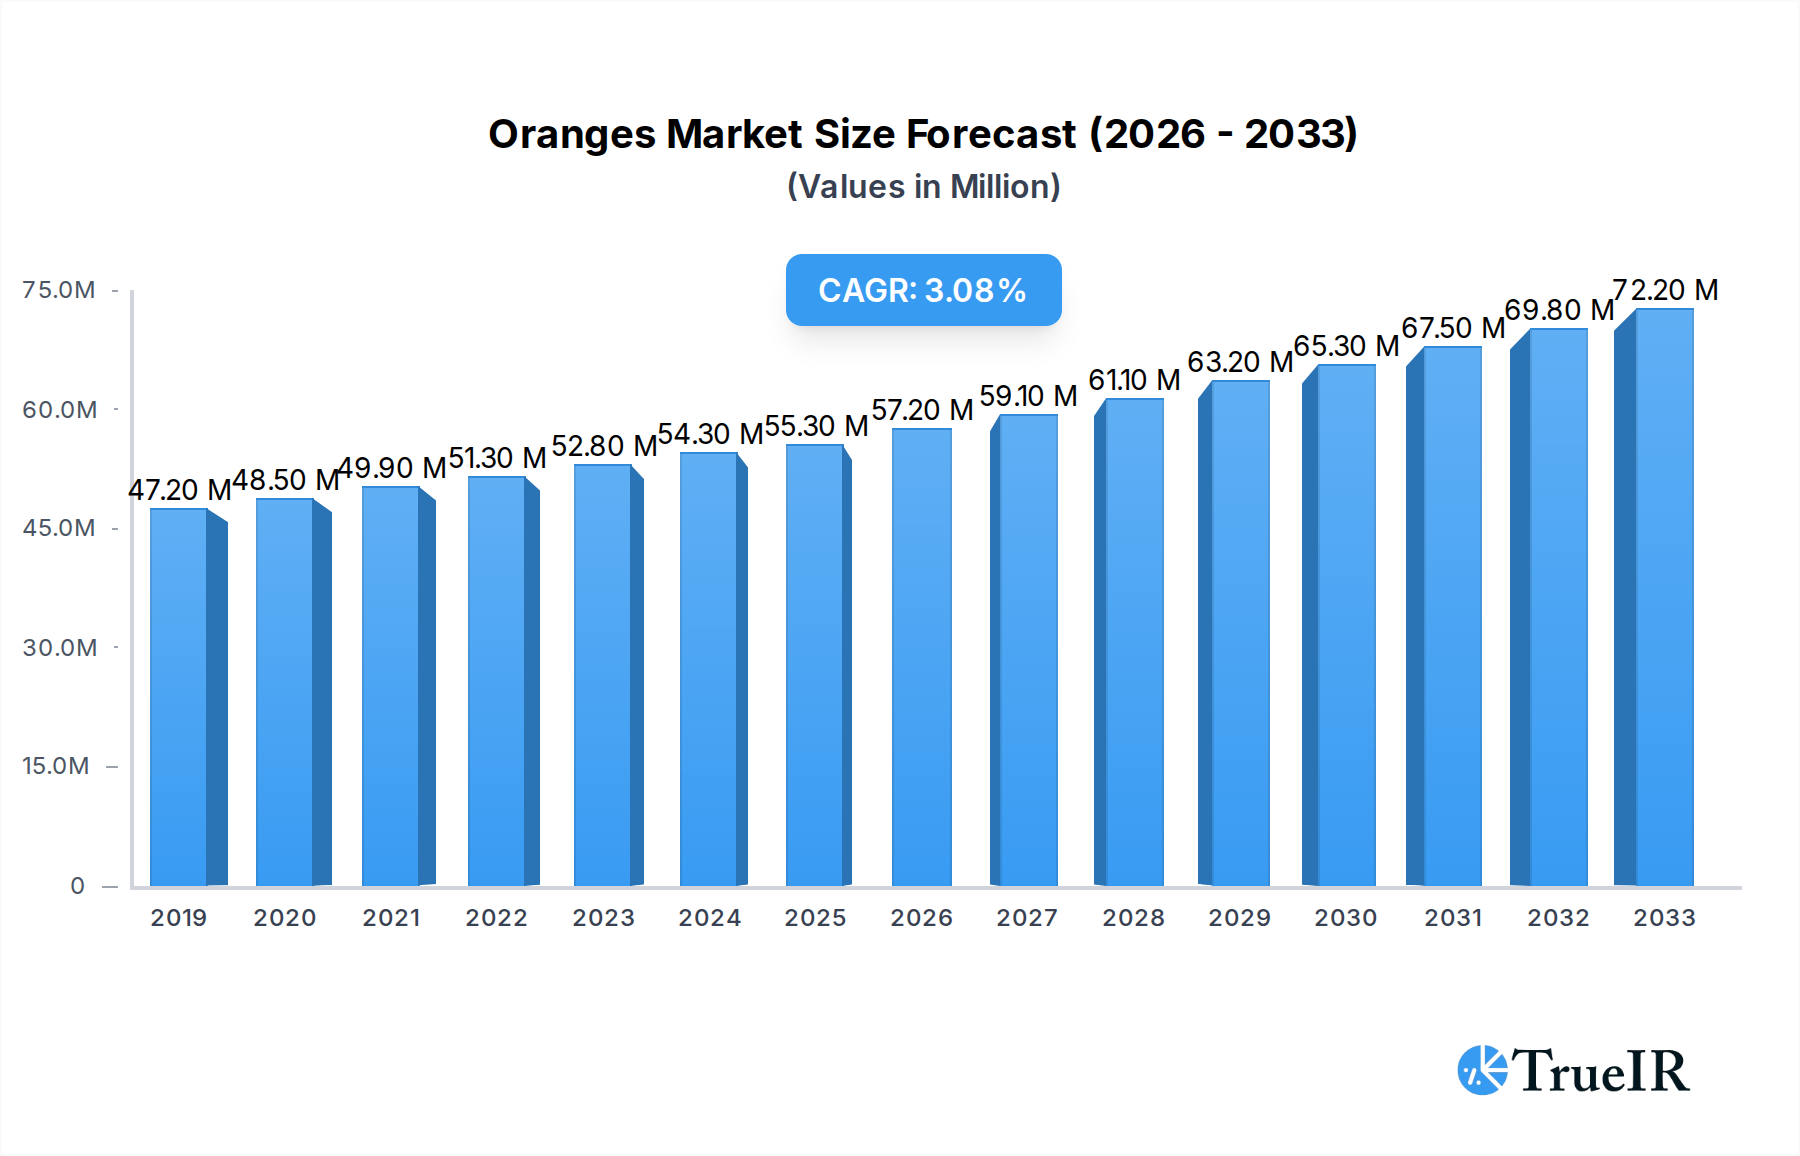
Oranges Market Size (In Million)
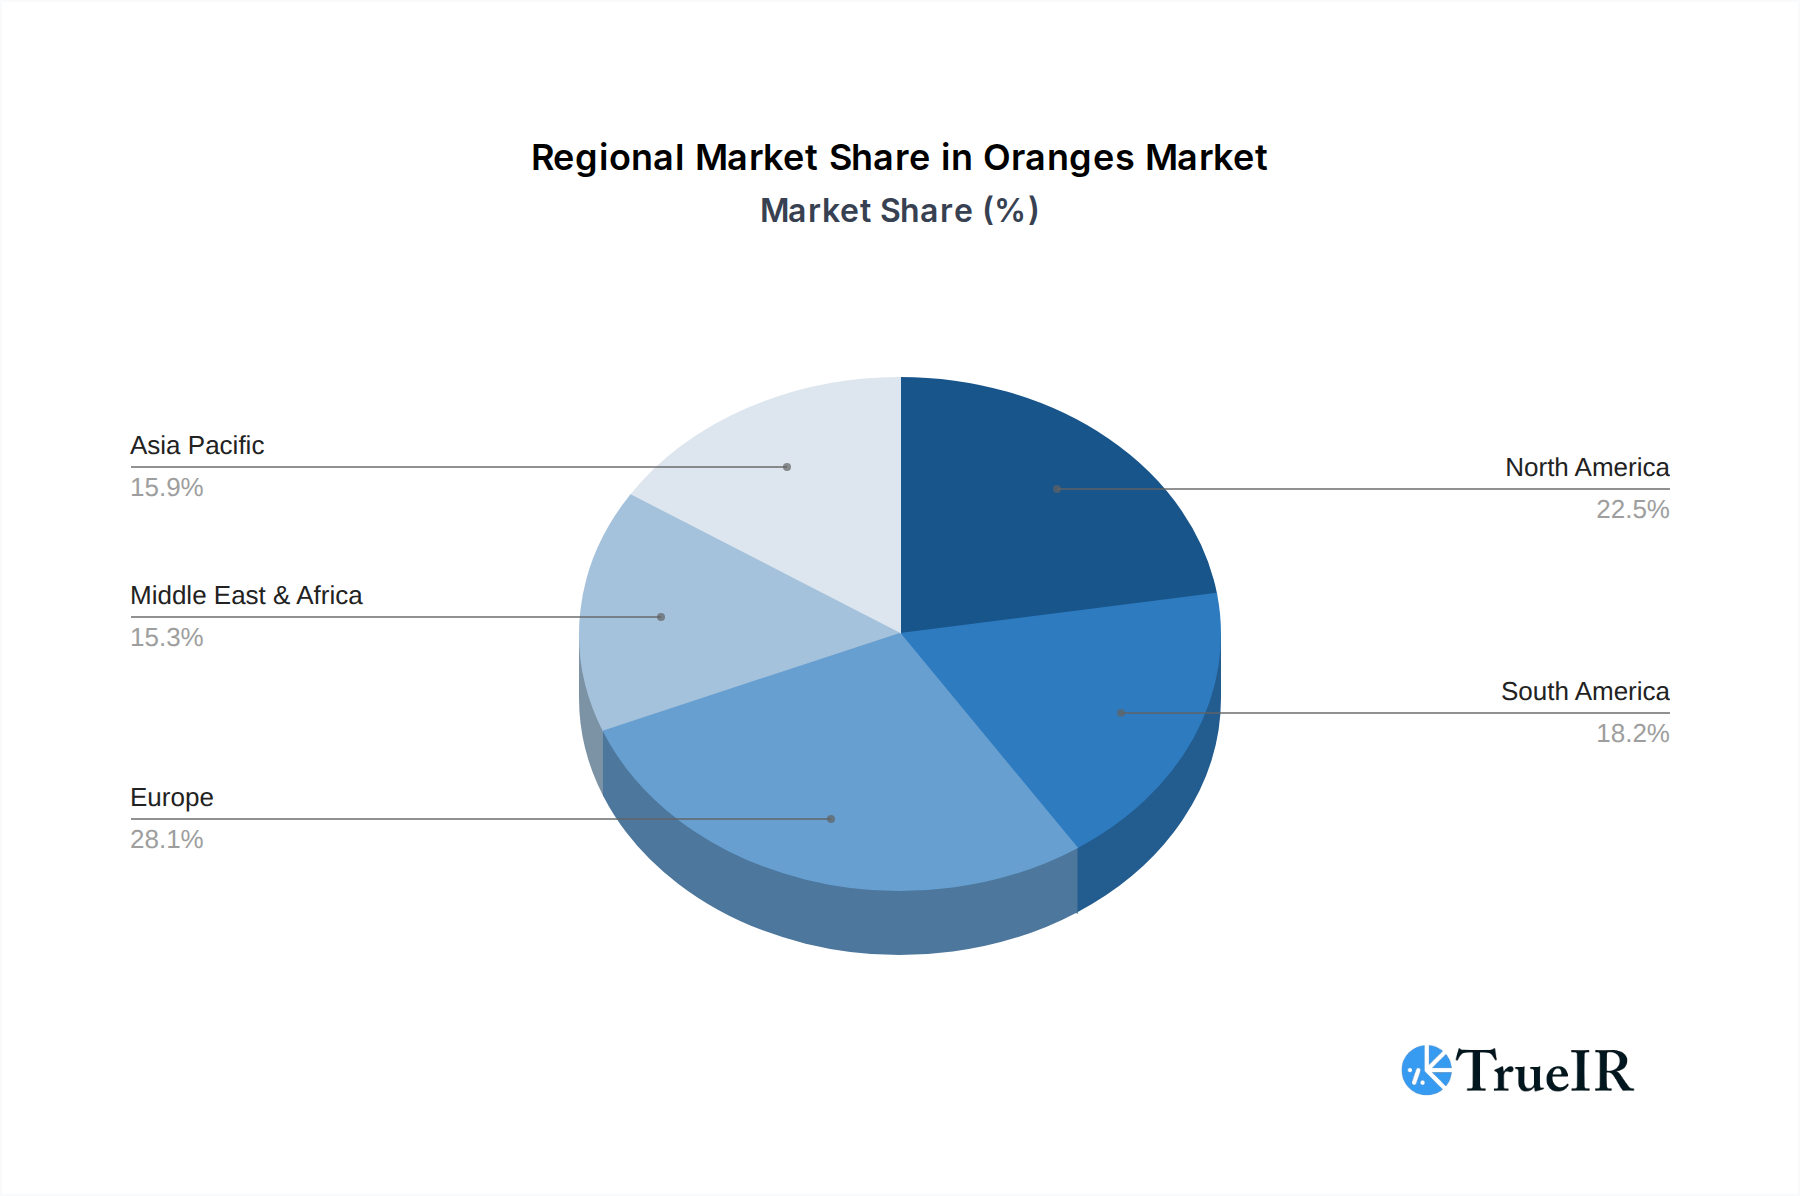
The market is characterized by diverse orange varieties, including sweet, navel, and blood oranges, each catering to specific consumer preferences and industrial uses. Geographically, the Asia Pacific region, led by China and India, is emerging as a significant growth engine due to its large population, rising disposable incomes, and increasing health consciousness. North America and Europe remain mature markets with consistent demand, driven by established consumption patterns and a strong focus on healthy living. However, the market faces certain restraints, including volatile raw material prices, crop-related challenges such as diseases and adverse weather conditions, and stringent regulatory compliances for food products. Emerging economies in South America and the Middle East & Africa present substantial untapped potential, with increasing investments in citrus cultivation and processing infrastructure expected to drive future growth.

Oranges Company Market Share
Oranges Market: Comprehensive Analysis and Future Projections (2019-2033)
This in-depth report provides a comprehensive analysis of the global oranges market, offering critical insights into its structure, trends, opportunities, and future trajectory. Covering the period from 2019 to 2033, with a base year of 2025 and a forecast period extending to 2033, this report is an indispensable resource for stakeholders seeking to understand and capitalize on the evolving oranges industry.
Oranges Market Structure & Competitive Landscape
The global oranges market exhibits a moderately concentrated structure, with a few dominant players controlling a significant portion of the market share. Innovation drivers are primarily focused on enhancing yield, disease resistance, and shelf-life, alongside the development of value-added orange products. Regulatory impacts, particularly concerning food safety standards and international trade policies, play a crucial role in shaping market dynamics. Product substitutes, such as other citrus fruits and juices, exert competitive pressure, necessitating continuous innovation and cost-effectiveness from orange producers. End-user segmentation reveals strong demand from the beverage industry, followed by food processing and nutraceuticals. Mergers and acquisitions (M&A) are a notable trend, with an estimated X billion worth of M&A deals occurring in the historical period, indicating consolidation efforts and strategic expansion by key companies like Fruit Royal and World Fruit Center. For instance, a recent acquisition in 2023, valued at approximately Y billion, saw a major player integrate a new processing technology, boosting its concentrate production capabilities. The concentration ratio among the top 5 players is estimated to be around 65%.
Oranges Market Trends & Opportunities
The global oranges market is poised for significant expansion, driven by a confluence of evolving consumer preferences, technological advancements, and expanding application areas. The market size is projected to grow at a Compound Annual Growth Rate (CAGR) of X%, reaching an estimated A billion by 2033. This growth is underpinned by increasing global demand for natural and healthy food products, with oranges, rich in Vitamin C and antioxidants, perfectly aligning with these trends. Technological shifts are revolutionizing cultivation practices, from precision agriculture and genetically modified (GM) varieties offering enhanced yield and pest resistance to advanced processing techniques for longer shelf life and improved nutritional content in concentrates and powders. Consumer preferences are leaning towards convenience and health benefits, fueling demand for fresh oranges, juices, and fortified products. The competitive landscape is characterized by intense rivalry, with companies like Capespan and Salix Fruit investing heavily in R&D and supply chain optimization. Market penetration rates for orange-derived products in emerging economies are still in their nascent stages, presenting substantial untapped opportunities. The development of novel applications for orange by-products, such as pectin and essential oils, further diversifies revenue streams and enhances market value, projected to contribute an additional B billion to the market by 2030. The growing adoption of sustainable farming practices is also becoming a key differentiator, with an increasing consumer base willing to pay a premium for ethically sourced and environmentally friendly orange products. The rise of e-commerce platforms for fresh produce and specialized food ingredients is also expanding market reach and facilitating direct-to-consumer sales.
Dominant Markets & Segments in Oranges
The Asia-Pacific region is emerging as the dominant market for oranges, propelled by a rapidly growing population, increasing disposable incomes, and a rising awareness of the health benefits associated with citrus fruits. Within this region, China and India stand out as key consumption hubs, exhibiting robust growth in both fresh orange consumption and demand for processed products like juice and concentrate. The Juice segment, valued at approximately C billion in the base year 2025, continues to lead in terms of market share due to its widespread popularity as a refreshing and healthy beverage.
- Key Growth Drivers in Asia-Pacific:
- Infrastructure Development: Significant investments in cold chain logistics and transportation networks are improving the availability and reducing spoilage of fresh oranges.
- Favorable Government Policies: Initiatives promoting agricultural productivity and food processing are creating a conducive environment for market expansion.
- Rising Health Consciousness: A growing middle class is increasingly prioritizing healthy diets, leading to higher consumption of vitamin-rich fruits like oranges.
- Urbanization: The shift towards urban living often correlates with increased access to supermarkets and a greater demand for processed food and beverage products.
Among the orange types, the Sweet orange segment holds the largest market share, estimated at D billion in 2025, owing to its widespread cultivation and versatility in various applications. However, Navel oranges are experiencing significant growth due to their seedless nature and appealing texture, making them a favorite for fresh consumption. Blood oranges and Red oranges are gaining traction in niche markets, driven by their unique visual appeal and distinct flavor profiles, increasingly being used in premium juices, desserts, and culinary applications. The Concentrate segment is projected to witness a CAGR of E% during the forecast period, driven by its extensive use in the food and beverage industry for fortification and flavoring.
Oranges Product Analysis
Product innovations in the oranges market are centered on enhancing nutritional value, extending shelf-life, and developing novel applications. Advanced processing techniques are enabling the creation of highly concentrated orange juices, stable orange powders for functional foods, and enriched orange extracts with potent antioxidant properties. Companies are also focusing on developing disease-resistant and climate-resilient orange varieties through advanced breeding and genetic modification, ensuring consistent supply and improved yield. Competitive advantages are being built on sustainable sourcing, stringent quality control, and the ability to cater to specific industry requirements, from food-grade ingredients to pharmaceutical applications.
Key Drivers, Barriers & Challenges in Oranges
The oranges market is propelled by several key drivers. Technologically, advancements in agricultural practices, including precision farming and improved irrigation techniques, are boosting yields and reducing input costs. Economically, rising global disposable incomes and a growing middle class in emerging economies are increasing consumer purchasing power for fruits and fruit-based products. Policy-driven factors, such as government support for agriculture and favorable trade agreements, further stimulate market growth. For example, subsidies for citrus cultivation in countries like Brazil have significantly impacted global supply.
Key challenges and restraints impacting the oranges market include the susceptibility of orange crops to various diseases and pests, such as citrus greening, which can lead to substantial yield losses estimated at F billion annually. Regulatory hurdles related to pesticide residues and import/export restrictions in different countries can also impede market access. Competitive pressures from other fruit varieties and the volatility of commodity prices further challenge profitability. Supply chain disruptions, particularly those caused by extreme weather events or global pandemics, can significantly impact the availability and cost of oranges.
Growth Drivers in the Oranges Market
The growth drivers in the oranges market are multifaceted, encompassing technological, economic, and regulatory influences. Technological advancements in breeding programs are leading to the development of higher-yielding and disease-resistant orange varieties, directly impacting supply and cost-effectiveness. Economically, the increasing global demand for natural ingredients and functional foods, driven by a heightened consumer focus on health and wellness, is a significant catalyst. Regulatory support for organic farming and sustainable agricultural practices is also fostering market expansion by appealing to environmentally conscious consumers and opening new market segments. Furthermore, the expansion of the processed food and beverage industry, particularly in emerging markets, is creating sustained demand for orange derivatives like juice and concentrate.
Challenges Impacting Oranges Growth
The oranges market faces several significant barriers and restraints that can impede growth. Supply chain vulnerabilities, exacerbated by climate change and its impact on weather patterns, pose a substantial risk, leading to unpredictable yields and price volatility. Regulatory complexities, including stringent food safety regulations and differing import/export requirements across countries, can create significant compliance costs and market access challenges. Competitive pressures from alternative fruits and the increasing availability of synthetic flavorings also present a threat to market share. For instance, the economic impact of citrus greening disease alone has been estimated to cost the industry over G billion in lost revenue over the past decade.
Key Players Shaping the Oranges Market
- Fruit Royal
- World Fruit Center
- Capespan
- Salix Fruit
Significant Oranges Industry Milestones
- 2019: Introduction of advanced disease-resistant sweet orange varieties by leading research institutions, boosting potential yields.
- 2020: Increased demand for Vitamin C-rich products due to global health concerns, leading to a surge in orange juice consumption.
- 2021: Significant investment in precision agriculture technologies for orange cultivation, aiming to optimize water and nutrient usage.
- 2022: Development of novel orange powder formulations for functional food and beverage applications, expanding market reach.
- 2023: Major acquisition in the concentrate processing sector, indicating consolidation and strategic growth in the industry, valued at H billion.
- 2024: Growing consumer preference for organic and sustainably grown oranges, leading to increased market opportunities for certified producers.
Future Outlook for Oranges Market
The future outlook for the oranges market is exceptionally bright, driven by sustained demand for healthy and natural products, coupled with ongoing technological advancements. Strategic opportunities lie in expanding the reach of value-added products like orange powder and concentrates into new geographic markets and developing innovative applications for orange by-products. The market potential is further amplified by the growing trend of functional foods and beverages, where the inherent health benefits of oranges can be leveraged. Continued investment in R&D for disease resistance and sustainable cultivation practices will be crucial for ensuring a stable and growing supply to meet projected market expansion, estimated to reach I billion by 2033.
Oranges Segmentation
-
1. Application
- 1.1. Juice
- 1.2. Concentrate
- 1.3. Powder
-
2. Types
- 2.1. Sweet orange
- 2.2. Navel orange
- 2.3. Blood orange
- 2.4. Red orange
Oranges Segmentation By Geography
-
1. North America
- 1.1. United States
- 1.2. Canada
- 1.3. Mexico
-
2. South America
- 2.1. Brazil
- 2.2. Argentina
- 2.3. Rest of South America
-
3. Europe
- 3.1. United Kingdom
- 3.2. Germany
- 3.3. France
- 3.4. Italy
- 3.5. Spain
- 3.6. Russia
- 3.7. Benelux
- 3.8. Nordics
- 3.9. Rest of Europe
-
4. Middle East & Africa
- 4.1. Turkey
- 4.2. Israel
- 4.3. GCC
- 4.4. North Africa
- 4.5. South Africa
- 4.6. Rest of Middle East & Africa
-
5. Asia Pacific
- 5.1. China
- 5.2. India
- 5.3. Japan
- 5.4. South Korea
- 5.5. ASEAN
- 5.6. Oceania
- 5.7. Rest of Asia Pacific
Oranges Regional Market Share
Geographic Coverage of Oranges
Oranges REPORT HIGHLIGHTS
| Aspects | Details |
|---|---|
| Study Period | 2020-2034 |
| Base Year | 2025 |
| Estimated Year | 2026 |
| Forecast Period | 2026-2034 |
| Historical Period | 2020-2025 |
| Growth Rate | CAGR of 3.4% from 2020-2034 |
| Segmentation |
|
Table of Contents
- 1. Introduction
- 1.1. Research Scope
- 1.2. Market Segmentation
- 1.3. Research Methodology
- 1.4. Definitions and Assumptions
- 2. Executive Summary
- 2.1. Introduction
- 3. Market Dynamics
- 3.1. Introduction
- 3.2. Market Drivers
- 3.3. Market Restrains
- 3.4. Market Trends
- 4. Market Factor Analysis
- 4.1. Porters Five Forces
- 4.2. Supply/Value Chain
- 4.3. PESTEL analysis
- 4.4. Market Entropy
- 4.5. Patent/Trademark Analysis
- 5. Global Oranges Analysis, Insights and Forecast, 2020-2032
- 5.1. Market Analysis, Insights and Forecast - by Application
- 5.1.1. Juice
- 5.1.2. Concentrate
- 5.1.3. Powder
- 5.2. Market Analysis, Insights and Forecast - by Types
- 5.2.1. Sweet orange
- 5.2.2. Navel orange
- 5.2.3. Blood orange
- 5.2.4. Red orange
- 5.3. Market Analysis, Insights and Forecast - by Region
- 5.3.1. North America
- 5.3.2. South America
- 5.3.3. Europe
- 5.3.4. Middle East & Africa
- 5.3.5. Asia Pacific
- 5.1. Market Analysis, Insights and Forecast - by Application
- 6. North America Oranges Analysis, Insights and Forecast, 2020-2032
- 6.1. Market Analysis, Insights and Forecast - by Application
- 6.1.1. Juice
- 6.1.2. Concentrate
- 6.1.3. Powder
- 6.2. Market Analysis, Insights and Forecast - by Types
- 6.2.1. Sweet orange
- 6.2.2. Navel orange
- 6.2.3. Blood orange
- 6.2.4. Red orange
- 6.1. Market Analysis, Insights and Forecast - by Application
- 7. South America Oranges Analysis, Insights and Forecast, 2020-2032
- 7.1. Market Analysis, Insights and Forecast - by Application
- 7.1.1. Juice
- 7.1.2. Concentrate
- 7.1.3. Powder
- 7.2. Market Analysis, Insights and Forecast - by Types
- 7.2.1. Sweet orange
- 7.2.2. Navel orange
- 7.2.3. Blood orange
- 7.2.4. Red orange
- 7.1. Market Analysis, Insights and Forecast - by Application
- 8. Europe Oranges Analysis, Insights and Forecast, 2020-2032
- 8.1. Market Analysis, Insights and Forecast - by Application
- 8.1.1. Juice
- 8.1.2. Concentrate
- 8.1.3. Powder
- 8.2. Market Analysis, Insights and Forecast - by Types
- 8.2.1. Sweet orange
- 8.2.2. Navel orange
- 8.2.3. Blood orange
- 8.2.4. Red orange
- 8.1. Market Analysis, Insights and Forecast - by Application
- 9. Middle East & Africa Oranges Analysis, Insights and Forecast, 2020-2032
- 9.1. Market Analysis, Insights and Forecast - by Application
- 9.1.1. Juice
- 9.1.2. Concentrate
- 9.1.3. Powder
- 9.2. Market Analysis, Insights and Forecast - by Types
- 9.2.1. Sweet orange
- 9.2.2. Navel orange
- 9.2.3. Blood orange
- 9.2.4. Red orange
- 9.1. Market Analysis, Insights and Forecast - by Application
- 10. Asia Pacific Oranges Analysis, Insights and Forecast, 2020-2032
- 10.1. Market Analysis, Insights and Forecast - by Application
- 10.1.1. Juice
- 10.1.2. Concentrate
- 10.1.3. Powder
- 10.2. Market Analysis, Insights and Forecast - by Types
- 10.2.1. Sweet orange
- 10.2.2. Navel orange
- 10.2.3. Blood orange
- 10.2.4. Red orange
- 10.1. Market Analysis, Insights and Forecast - by Application
- 11. Competitive Analysis
- 11.1. Global Market Share Analysis 2025
- 11.2. Company Profiles
- 11.2.1 Fruit Royal
- 11.2.1.1. Overview
- 11.2.1.2. Products
- 11.2.1.3. SWOT Analysis
- 11.2.1.4. Recent Developments
- 11.2.1.5. Financials (Based on Availability)
- 11.2.2 World fruit center
- 11.2.2.1. Overview
- 11.2.2.2. Products
- 11.2.2.3. SWOT Analysis
- 11.2.2.4. Recent Developments
- 11.2.2.5. Financials (Based on Availability)
- 11.2.3 Capespan
- 11.2.3.1. Overview
- 11.2.3.2. Products
- 11.2.3.3. SWOT Analysis
- 11.2.3.4. Recent Developments
- 11.2.3.5. Financials (Based on Availability)
- 11.2.4 Salix Fruit
- 11.2.4.1. Overview
- 11.2.4.2. Products
- 11.2.4.3. SWOT Analysis
- 11.2.4.4. Recent Developments
- 11.2.4.5. Financials (Based on Availability)
- 11.2.1 Fruit Royal
List of Figures
- Figure 1: Global Oranges Revenue Breakdown (billion, %) by Region 2025 & 2033
- Figure 2: North America Oranges Revenue (billion), by Application 2025 & 2033
- Figure 3: North America Oranges Revenue Share (%), by Application 2025 & 2033
- Figure 4: North America Oranges Revenue (billion), by Types 2025 & 2033
- Figure 5: North America Oranges Revenue Share (%), by Types 2025 & 2033
- Figure 6: North America Oranges Revenue (billion), by Country 2025 & 2033
- Figure 7: North America Oranges Revenue Share (%), by Country 2025 & 2033
- Figure 8: South America Oranges Revenue (billion), by Application 2025 & 2033
- Figure 9: South America Oranges Revenue Share (%), by Application 2025 & 2033
- Figure 10: South America Oranges Revenue (billion), by Types 2025 & 2033
- Figure 11: South America Oranges Revenue Share (%), by Types 2025 & 2033
- Figure 12: South America Oranges Revenue (billion), by Country 2025 & 2033
- Figure 13: South America Oranges Revenue Share (%), by Country 2025 & 2033
- Figure 14: Europe Oranges Revenue (billion), by Application 2025 & 2033
- Figure 15: Europe Oranges Revenue Share (%), by Application 2025 & 2033
- Figure 16: Europe Oranges Revenue (billion), by Types 2025 & 2033
- Figure 17: Europe Oranges Revenue Share (%), by Types 2025 & 2033
- Figure 18: Europe Oranges Revenue (billion), by Country 2025 & 2033
- Figure 19: Europe Oranges Revenue Share (%), by Country 2025 & 2033
- Figure 20: Middle East & Africa Oranges Revenue (billion), by Application 2025 & 2033
- Figure 21: Middle East & Africa Oranges Revenue Share (%), by Application 2025 & 2033
- Figure 22: Middle East & Africa Oranges Revenue (billion), by Types 2025 & 2033
- Figure 23: Middle East & Africa Oranges Revenue Share (%), by Types 2025 & 2033
- Figure 24: Middle East & Africa Oranges Revenue (billion), by Country 2025 & 2033
- Figure 25: Middle East & Africa Oranges Revenue Share (%), by Country 2025 & 2033
- Figure 26: Asia Pacific Oranges Revenue (billion), by Application 2025 & 2033
- Figure 27: Asia Pacific Oranges Revenue Share (%), by Application 2025 & 2033
- Figure 28: Asia Pacific Oranges Revenue (billion), by Types 2025 & 2033
- Figure 29: Asia Pacific Oranges Revenue Share (%), by Types 2025 & 2033
- Figure 30: Asia Pacific Oranges Revenue (billion), by Country 2025 & 2033
- Figure 31: Asia Pacific Oranges Revenue Share (%), by Country 2025 & 2033
List of Tables
- Table 1: Global Oranges Revenue billion Forecast, by Application 2020 & 2033
- Table 2: Global Oranges Revenue billion Forecast, by Types 2020 & 2033
- Table 3: Global Oranges Revenue billion Forecast, by Region 2020 & 2033
- Table 4: Global Oranges Revenue billion Forecast, by Application 2020 & 2033
- Table 5: Global Oranges Revenue billion Forecast, by Types 2020 & 2033
- Table 6: Global Oranges Revenue billion Forecast, by Country 2020 & 2033
- Table 7: United States Oranges Revenue (billion) Forecast, by Application 2020 & 2033
- Table 8: Canada Oranges Revenue (billion) Forecast, by Application 2020 & 2033
- Table 9: Mexico Oranges Revenue (billion) Forecast, by Application 2020 & 2033
- Table 10: Global Oranges Revenue billion Forecast, by Application 2020 & 2033
- Table 11: Global Oranges Revenue billion Forecast, by Types 2020 & 2033
- Table 12: Global Oranges Revenue billion Forecast, by Country 2020 & 2033
- Table 13: Brazil Oranges Revenue (billion) Forecast, by Application 2020 & 2033
- Table 14: Argentina Oranges Revenue (billion) Forecast, by Application 2020 & 2033
- Table 15: Rest of South America Oranges Revenue (billion) Forecast, by Application 2020 & 2033
- Table 16: Global Oranges Revenue billion Forecast, by Application 2020 & 2033
- Table 17: Global Oranges Revenue billion Forecast, by Types 2020 & 2033
- Table 18: Global Oranges Revenue billion Forecast, by Country 2020 & 2033
- Table 19: United Kingdom Oranges Revenue (billion) Forecast, by Application 2020 & 2033
- Table 20: Germany Oranges Revenue (billion) Forecast, by Application 2020 & 2033
- Table 21: France Oranges Revenue (billion) Forecast, by Application 2020 & 2033
- Table 22: Italy Oranges Revenue (billion) Forecast, by Application 2020 & 2033
- Table 23: Spain Oranges Revenue (billion) Forecast, by Application 2020 & 2033
- Table 24: Russia Oranges Revenue (billion) Forecast, by Application 2020 & 2033
- Table 25: Benelux Oranges Revenue (billion) Forecast, by Application 2020 & 2033
- Table 26: Nordics Oranges Revenue (billion) Forecast, by Application 2020 & 2033
- Table 27: Rest of Europe Oranges Revenue (billion) Forecast, by Application 2020 & 2033
- Table 28: Global Oranges Revenue billion Forecast, by Application 2020 & 2033
- Table 29: Global Oranges Revenue billion Forecast, by Types 2020 & 2033
- Table 30: Global Oranges Revenue billion Forecast, by Country 2020 & 2033
- Table 31: Turkey Oranges Revenue (billion) Forecast, by Application 2020 & 2033
- Table 32: Israel Oranges Revenue (billion) Forecast, by Application 2020 & 2033
- Table 33: GCC Oranges Revenue (billion) Forecast, by Application 2020 & 2033
- Table 34: North Africa Oranges Revenue (billion) Forecast, by Application 2020 & 2033
- Table 35: South Africa Oranges Revenue (billion) Forecast, by Application 2020 & 2033
- Table 36: Rest of Middle East & Africa Oranges Revenue (billion) Forecast, by Application 2020 & 2033
- Table 37: Global Oranges Revenue billion Forecast, by Application 2020 & 2033
- Table 38: Global Oranges Revenue billion Forecast, by Types 2020 & 2033
- Table 39: Global Oranges Revenue billion Forecast, by Country 2020 & 2033
- Table 40: China Oranges Revenue (billion) Forecast, by Application 2020 & 2033
- Table 41: India Oranges Revenue (billion) Forecast, by Application 2020 & 2033
- Table 42: Japan Oranges Revenue (billion) Forecast, by Application 2020 & 2033
- Table 43: South Korea Oranges Revenue (billion) Forecast, by Application 2020 & 2033
- Table 44: ASEAN Oranges Revenue (billion) Forecast, by Application 2020 & 2033
- Table 45: Oceania Oranges Revenue (billion) Forecast, by Application 2020 & 2033
- Table 46: Rest of Asia Pacific Oranges Revenue (billion) Forecast, by Application 2020 & 2033
Frequently Asked Questions
1. What is the projected Compound Annual Growth Rate (CAGR) of the Oranges?
The projected CAGR is approximately 3.4%.
2. Which companies are prominent players in the Oranges?
Key companies in the market include Fruit Royal, World fruit center, Capespan, Salix Fruit.
3. What are the main segments of the Oranges?
The market segments include Application, Types.
4. Can you provide details about the market size?
The market size is estimated to be USD 55.3 billion as of 2022.
5. What are some drivers contributing to market growth?
N/A
6. What are the notable trends driving market growth?
N/A
7. Are there any restraints impacting market growth?
N/A
8. Can you provide examples of recent developments in the market?
N/A
9. What pricing options are available for accessing the report?
Pricing options include single-user, multi-user, and enterprise licenses priced at USD 4900.00, USD 7350.00, and USD 9800.00 respectively.
10. Is the market size provided in terms of value or volume?
The market size is provided in terms of value, measured in billion.
11. Are there any specific market keywords associated with the report?
Yes, the market keyword associated with the report is "Oranges," which aids in identifying and referencing the specific market segment covered.
12. How do I determine which pricing option suits my needs best?
The pricing options vary based on user requirements and access needs. Individual users may opt for single-user licenses, while businesses requiring broader access may choose multi-user or enterprise licenses for cost-effective access to the report.
13. Are there any additional resources or data provided in the Oranges report?
While the report offers comprehensive insights, it's advisable to review the specific contents or supplementary materials provided to ascertain if additional resources or data are available.
14. How can I stay updated on further developments or reports in the Oranges?
To stay informed about further developments, trends, and reports in the Oranges, consider subscribing to industry newsletters, following relevant companies and organizations, or regularly checking reputable industry news sources and publications.
Methodology
Step 1 - Identification of Relevant Samples Size from Population Database


Step 2 - Approaches for Defining Global Market Size (Value, Volume* & Price*)

Note*: In applicable scenarios
Step 3 - Data Sources
Primary Research
- Web Analytics
- Survey Reports
- Research Institute
- Latest Research Reports
- Opinion Leaders
Secondary Research
- Annual Reports
- White Paper
- Latest Press Release
- Industry Association
- Paid Database
- Investor Presentations

Step 4 - Data Triangulation
Involves using different sources of information in order to increase the validity of a study
These sources are likely to be stakeholders in a program - participants, other researchers, program staff, other community members, and so on.
Then we put all data in single framework & apply various statistical tools to find out the dynamic on the market.
During the analysis stage, feedback from the stakeholder groups would be compared to determine areas of agreement as well as areas of divergence