

Key Insights
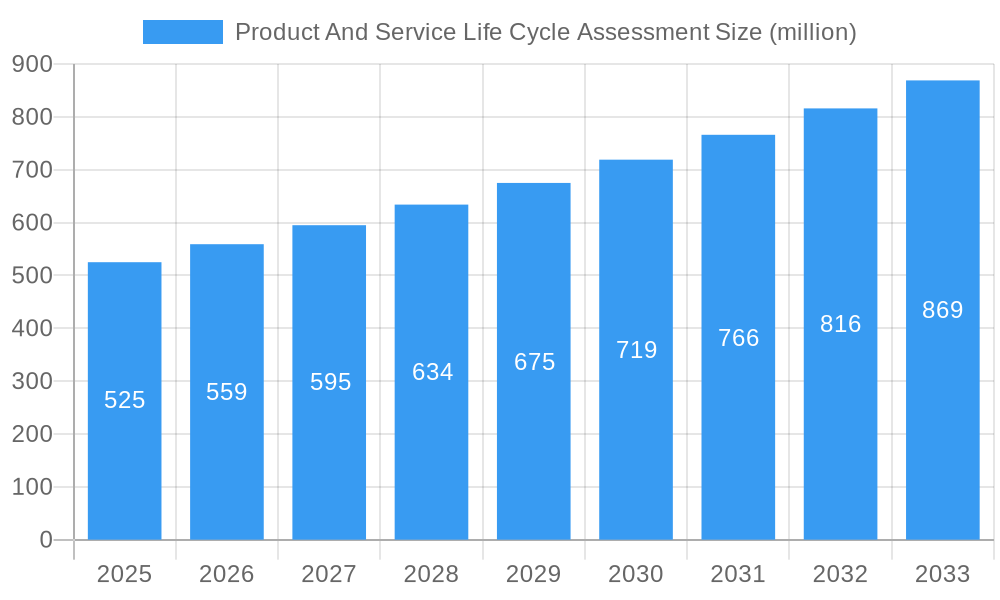
The global Product and Service Life Cycle Assessment (LCA) market is poised for significant expansion, projected to reach an estimated $525 million by 2025, with a robust Compound Annual Growth Rate (CAGR) of 6.7% from 2019 to 2033. This growth is fueled by an increasing global emphasis on sustainability, environmental regulations, and corporate social responsibility. Industries are actively seeking ways to minimize their environmental footprint across the entire lifecycle of their products and services, from raw material extraction to end-of-life disposal. This surge in demand is driven by key factors such as heightened consumer awareness regarding eco-friendly products, stringent government policies promoting sustainable practices, and the growing recognition among businesses that LCA can offer competitive advantages through resource efficiency and risk mitigation. The market is segmented by application into Building Materials, Textiles, Food and Agriculture, Consumer Goods, and Others, with each sector increasingly adopting LCA methodologies to meet evolving market expectations and regulatory demands.
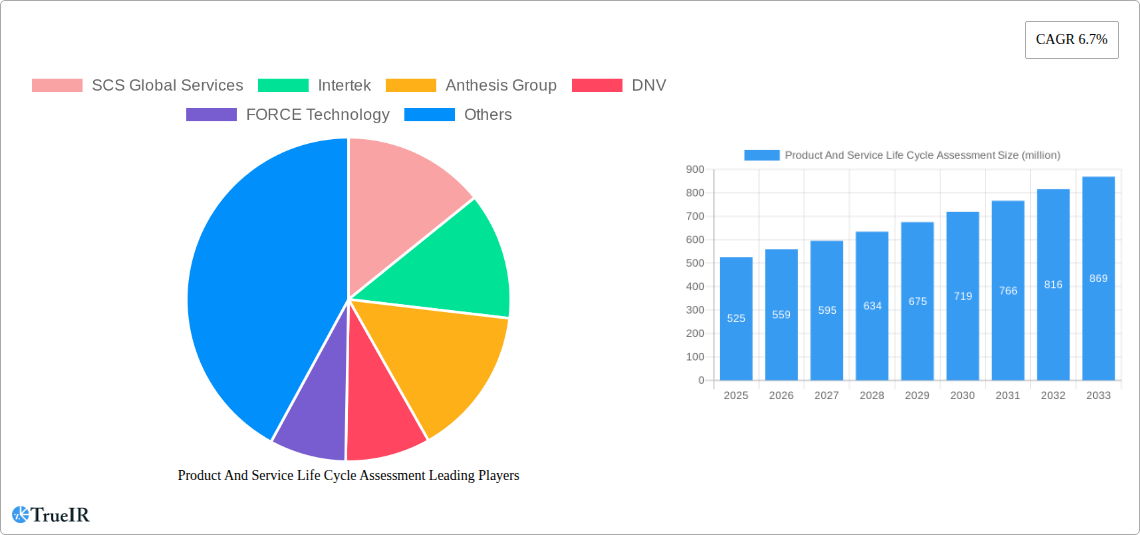
Product And Service Life Cycle Assessment Market Size (In Million)
The LCA market's dynamism is also shaped by prevailing trends like the integration of LCA with other sustainability frameworks, advancements in software tools for more efficient and accurate assessments, and a growing demand for both Attributional LCA (ALCA) and Consequential LCA (CLCA) to address different decision-making needs. While the market presents substantial opportunities, it also faces certain restraints. These include the complexity and cost associated with conducting comprehensive LCAs, the need for specialized expertise and data, and challenges in standardizing methodologies across diverse industries and regions. Despite these hurdles, the market is expected to witness continued innovation and adoption, with key players such as SCS Global Services, Intertek, and Anthesis Group driving advancements and expanding service offerings. The Asia Pacific region, particularly China and India, is emerging as a high-growth area due to rapid industrialization and increasing environmental consciousness.
Product And Service Life Cycle Assessment Company Market Share
Uncover the pivotal trends, competitive strategies, and growth drivers shaping the global Product and Service Life Cycle Assessment (LCA) market. This comprehensive report provides an in-depth analysis of market dynamics, technological innovations, and regulatory influences from 2019–2033, with a detailed forecast period of 2025–2033.
Product And Service Life Cycle Assessment Market Structure & Competitive Landscape
The Product and Service Life Cycle Assessment (LCA) market exhibits a moderately concentrated structure, driven by a blend of established global consultancies and emerging specialized firms. Innovation is primarily fueled by the increasing demand for robust environmental performance data across various industries, driven by corporate sustainability goals and investor pressure. Regulatory impacts, such as evolving eco-design directives and carbon reporting mandates, are significant market shapers. Product substitutes, while nascent, include simplified eco-labeling schemes and internal corporate assessment tools, though their comprehensiveness is often limited compared to full LCA. End-user segmentation reveals strong demand from Building Materials, Textiles, and Consumer Goods sectors, with Food and Agriculture also showing significant growth potential. Mergers and acquisitions (M&A) activity, though not at a million-dollar volume annually, is present as larger entities acquire niche expertise to broaden their service offerings. Key players like SCS Global Services and Intertek are strategically expanding their LCA capabilities to capture a larger market share.
Product And Service Life Cycle Assessment Market Trends & Opportunities
The Product and Service Life Cycle Assessment (LCA) market is experiencing substantial growth, projected to reach multi-million dollar valuations, driven by a confluence of escalating environmental consciousness, stringent regulatory frameworks, and evolving consumer preferences. The Compound Annual Growth Rate (CAGR) is estimated to be over 10% during the forecast period of 2025–2033. Technological shifts, including advancements in data analytics, AI-powered impact assessment, and cloud-based LCA platforms, are streamlining the process, making it more accessible and efficient for businesses of all sizes. Consumer preferences are increasingly leaning towards sustainably produced goods, compelling manufacturers to demonstrate the environmental footprint of their products and services through credible LCA studies. This demand is particularly pronounced in sectors like Consumer Goods, where brand reputation is directly tied to environmental stewardship. The competitive landscape is characterized by a dynamic interplay between established consulting giants and agile, specialized firms, each vying to offer comprehensive and customized LCA solutions. Opportunities abound for service providers who can offer integrated solutions, incorporating both Attributional LCA (ALCA) and Consequential LCA (CLCA) methodologies, to cater to diverse business needs, from static impact assessments to strategic decision-making support. The penetration rate of LCA services is steadily increasing across industries, indicating a growing recognition of its strategic importance in achieving sustainability targets and mitigating environmental risks. The report will delve into these trends, providing detailed insights into market size, technological adoption, and the evolving needs of end-users.
Dominant Markets & Segments in Product And Service Life Cycle Assessment
The Building Materials segment is emerging as a dominant market within the Product and Service Life Cycle Assessment (LCA) landscape, propelled by significant infrastructure development projects and a growing emphasis on sustainable construction practices globally. Government policies mandating the use of eco-friendly materials and stringent building codes are key growth drivers in this sector. The forecast indicates substantial investments in green building certifications, directly increasing the demand for LCA studies for concrete, steel, wood, and other construction components. Furthermore, the Textiles industry is witnessing a robust expansion of LCA adoption, driven by consumer awareness regarding the environmental impact of fast fashion and a surge in demand for ethically sourced and produced apparel. Regulatory pressures to reduce water consumption, chemical usage, and waste generation in textile manufacturing are also accelerating this trend.
- Leading Region: North America and Europe currently lead in LCA adoption due to well-established regulatory frameworks and a mature sustainability consciousness. However, Asia-Pacific is projected to exhibit the highest growth rate due to rapid industrialization and increasing environmental regulations.
- Dominant Application Segment:
- Building Materials: Driven by green building initiatives, infrastructure spending, and material innovation for reduced environmental impact.
- Textiles: Fueled by consumer demand for ethical and sustainable fashion, and regulations on chemical usage and waste.
- Consumer Goods: Growing demand for transparency in product life cycles and a focus on circular economy principles.
- Dominant Type Segment:
- Attributional LCA (ALCA): Remains the most widely adopted type for understanding the environmental burdens associated with the production and use of specific products or services. Its application in reporting and compliance is extensive.
- Consequential LCA (CLCA): Gaining traction for strategic decision-making, policy analysis, and understanding the broader environmental implications of market shifts. Its adoption is expected to grow as businesses move beyond compliance to proactive sustainability management.
Product And Service Life Cycle Assessment Product Analysis
Product innovations in Product and Service Life Cycle Assessment are focused on enhancing data accuracy, streamlining workflows, and improving the user-friendliness of LCA software. Advanced modeling techniques are being developed to capture a wider range of environmental impacts, including biodiversity loss and water scarcity. Competitive advantages are being gained by companies offering integrated platforms that combine data management, impact assessment, and reporting functionalities, catering to a diverse range of applications from Building Materials to Consumer Goods. The market fit is strengthened by customized solutions addressing specific industry challenges and regulatory requirements, enabling businesses to make informed sustainability decisions.
Key Drivers, Barriers & Challenges in Product And Service Life Cycle Assessment
Key Drivers: The Product and Service Life Cycle Assessment (LCA) market is propelled by several critical drivers. Increasingly stringent environmental regulations worldwide, such as the EU's Green Deal and various carbon pricing mechanisms, mandate comprehensive environmental performance assessments. Growing corporate social responsibility (CSR) initiatives and investor pressure for Environmental, Social, and Governance (ESG) reporting are compelling companies to conduct LCAs to demonstrate their commitment to sustainability. Technological advancements in data collection, AI-driven analysis, and cloud-based LCA platforms are making the process more efficient and accessible. Furthermore, heightened consumer demand for eco-friendly products is driving manufacturers to seek credible evidence of their environmental claims through LCA studies.
Barriers & Challenges: Despite the growth, several barriers and challenges impact the Product and Service Life Cycle Assessment market. The complexity and data-intensive nature of LCA studies can lead to high implementation costs, which can be a deterrent for small and medium-sized enterprises (SMEs). A lack of standardized methodologies and inconsistent data availability across different regions and industries create challenges in achieving comparable results. Regulatory hurdles and evolving standards require continuous adaptation and expertise. Supply chain complexities, particularly for global operations, pose significant data collection challenges. Competitive pressures from simpler environmental assessment tools and the need for specialized expertise also present ongoing obstacles.
Growth Drivers in the Product And Service Life Cycle Assessment Market
Key growth drivers in the Product and Service Life Cycle Assessment (LCA) market are multifaceted. Technological advancements, including AI and machine learning, are enhancing the efficiency and accuracy of LCA software, making it more accessible and cost-effective. Economic factors, such as the rising cost of carbon emissions and the increasing investor focus on ESG performance, are incentivizing businesses to invest in LCA to identify cost-saving opportunities and manage risks. Policy-driven factors, like the implementation of eco-design directives and circular economy initiatives across various regions, are mandating LCA as a fundamental tool for compliance and product development. The growing consumer demand for transparency and sustainability is also a significant catalyst, pushing companies to proactively assess and communicate their environmental footprint.
Challenges Impacting Product And Service Life Cycle Assessment Growth
Challenges impacting Product and Service Life Cycle Assessment (LCA) growth include the inherent complexity and data-intensive nature of the process, leading to high implementation costs and requiring specialized expertise. Regulatory complexities, with evolving standards and varying requirements across different jurisdictions, create hurdles for global businesses. Supply chain issues, particularly the difficulty in obtaining accurate and consistent data from all tiers of a supply chain, remain a significant impediment. Competitive pressures from simplified environmental marketing claims and the ongoing need to educate stakeholders about the value and rigor of LCA studies also contribute to growth restraints.
Key Players Shaping the Product And Service Life Cycle Assessment Market
- SCS Global Services
- Intertek
- Anthesis Group
- DNV
- FORCE Technology
- EcoAct
- TÜV Rheinland
- WAP Sustainability Consulting
- Eurofins
- SGS
- DEKRA
- Valpak Limited
- Yordas Group
- BRE Group
- RINA
Significant Product And Service Life Cycle Assessment Industry Milestones
- 2019: Increased adoption of ISO 14040/14044 standards by major corporations for product environmental footprint declarations.
- 2020: Launch of enhanced LCA software platforms integrating AI for faster data analysis and impact assessment.
- 2021: Growing regulatory focus on Scope 3 emissions, driving demand for comprehensive supply chain LCAs.
- 2022: Emergence of industry-specific LCA databases and tools, improving data quality and comparability.
- 2023: Increased integration of LCA into product design and R&D processes, moving beyond compliance.
- 2024: Expansion of LCA services to emerging economies driven by global sustainability initiatives.
Future Outlook for Product And Service Life Cycle Assessment Market
The future outlook for the Product and Service Life Cycle Assessment (LCA) market is exceptionally positive, poised for sustained growth driven by an intensifying global commitment to sustainability. Strategic opportunities lie in the continued integration of LCA into corporate strategy, decision-making, and supply chain management. Market potential will be further unlocked by advancements in digital technologies, such as blockchain for data integrity and IoT for real-time environmental monitoring, which will enhance the accuracy and accessibility of LCA. The increasing demand for circular economy solutions and climate-resilient products will necessitate robust LCA frameworks. Companies that can offer agile, data-driven, and integrated LCA services will be well-positioned to capitalize on this expanding market.
Product And Service Life Cycle Assessment Segmentation
-
1. Application
- 1.1. Building Materials
- 1.2. Textiles
- 1.3. Food and Agriculture
- 1.4. Consumer Goods
- 1.5. Others
-
2. Type
- 2.1. Attributional LCA
- 2.2. Consequential LCA
Product And Service Life Cycle Assessment Segmentation By Geography
-
1. North America
- 1.1. United States
- 1.2. Canada
- 1.3. Mexico
-
2. South America
- 2.1. Brazil
- 2.2. Argentina
- 2.3. Rest of South America
-
3. Europe
- 3.1. United Kingdom
- 3.2. Germany
- 3.3. France
- 3.4. Italy
- 3.5. Spain
- 3.6. Russia
- 3.7. Benelux
- 3.8. Nordics
- 3.9. Rest of Europe
-
4. Middle East & Africa
- 4.1. Turkey
- 4.2. Israel
- 4.3. GCC
- 4.4. North Africa
- 4.5. South Africa
- 4.6. Rest of Middle East & Africa
-
5. Asia Pacific
- 5.1. China
- 5.2. India
- 5.3. Japan
- 5.4. South Korea
- 5.5. ASEAN
- 5.6. Oceania
- 5.7. Rest of Asia Pacific
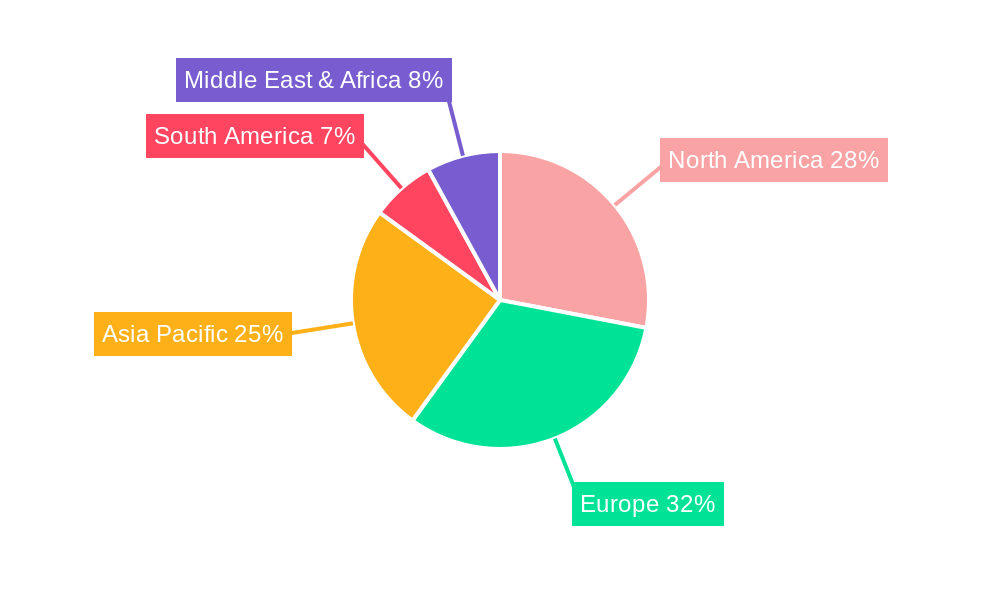
Product And Service Life Cycle Assessment Regional Market Share
Geographic Coverage of Product And Service Life Cycle Assessment
Product And Service Life Cycle Assessment REPORT HIGHLIGHTS
| Aspects | Details |
|---|---|
| Study Period | 2020-2034 |
| Base Year | 2025 |
| Estimated Year | 2026 |
| Forecast Period | 2026-2034 |
| Historical Period | 2020-2025 |
| Growth Rate | CAGR of 6.7% from 2020-2034 |
| Segmentation |
|
Table of Contents
- 1. Introduction
- 1.1. Research Scope
- 1.2. Market Segmentation
- 1.3. Research Methodology
- 1.4. Definitions and Assumptions
- 2. Executive Summary
- 2.1. Introduction
- 3. Market Dynamics
- 3.1. Introduction
- 3.2. Market Drivers
- 3.3. Market Restrains
- 3.4. Market Trends
- 4. Market Factor Analysis
- 4.1. Porters Five Forces
- 4.2. Supply/Value Chain
- 4.3. PESTEL analysis
- 4.4. Market Entropy
- 4.5. Patent/Trademark Analysis
- 5. Global Product And Service Life Cycle Assessment Analysis, Insights and Forecast, 2020-2032
- 5.1. Market Analysis, Insights and Forecast - by Application
- 5.1.1. Building Materials
- 5.1.2. Textiles
- 5.1.3. Food and Agriculture
- 5.1.4. Consumer Goods
- 5.1.5. Others
- 5.2. Market Analysis, Insights and Forecast - by Type
- 5.2.1. Attributional LCA
- 5.2.2. Consequential LCA
- 5.3. Market Analysis, Insights and Forecast - by Region
- 5.3.1. North America
- 5.3.2. South America
- 5.3.3. Europe
- 5.3.4. Middle East & Africa
- 5.3.5. Asia Pacific
- 5.1. Market Analysis, Insights and Forecast - by Application
- 6. North America Product And Service Life Cycle Assessment Analysis, Insights and Forecast, 2020-2032
- 6.1. Market Analysis, Insights and Forecast - by Application
- 6.1.1. Building Materials
- 6.1.2. Textiles
- 6.1.3. Food and Agriculture
- 6.1.4. Consumer Goods
- 6.1.5. Others
- 6.2. Market Analysis, Insights and Forecast - by Type
- 6.2.1. Attributional LCA
- 6.2.2. Consequential LCA
- 6.1. Market Analysis, Insights and Forecast - by Application
- 7. South America Product And Service Life Cycle Assessment Analysis, Insights and Forecast, 2020-2032
- 7.1. Market Analysis, Insights and Forecast - by Application
- 7.1.1. Building Materials
- 7.1.2. Textiles
- 7.1.3. Food and Agriculture
- 7.1.4. Consumer Goods
- 7.1.5. Others
- 7.2. Market Analysis, Insights and Forecast - by Type
- 7.2.1. Attributional LCA
- 7.2.2. Consequential LCA
- 7.1. Market Analysis, Insights and Forecast - by Application
- 8. Europe Product And Service Life Cycle Assessment Analysis, Insights and Forecast, 2020-2032
- 8.1. Market Analysis, Insights and Forecast - by Application
- 8.1.1. Building Materials
- 8.1.2. Textiles
- 8.1.3. Food and Agriculture
- 8.1.4. Consumer Goods
- 8.1.5. Others
- 8.2. Market Analysis, Insights and Forecast - by Type
- 8.2.1. Attributional LCA
- 8.2.2. Consequential LCA
- 8.1. Market Analysis, Insights and Forecast - by Application
- 9. Middle East & Africa Product And Service Life Cycle Assessment Analysis, Insights and Forecast, 2020-2032
- 9.1. Market Analysis, Insights and Forecast - by Application
- 9.1.1. Building Materials
- 9.1.2. Textiles
- 9.1.3. Food and Agriculture
- 9.1.4. Consumer Goods
- 9.1.5. Others
- 9.2. Market Analysis, Insights and Forecast - by Type
- 9.2.1. Attributional LCA
- 9.2.2. Consequential LCA
- 9.1. Market Analysis, Insights and Forecast - by Application
- 10. Asia Pacific Product And Service Life Cycle Assessment Analysis, Insights and Forecast, 2020-2032
- 10.1. Market Analysis, Insights and Forecast - by Application
- 10.1.1. Building Materials
- 10.1.2. Textiles
- 10.1.3. Food and Agriculture
- 10.1.4. Consumer Goods
- 10.1.5. Others
- 10.2. Market Analysis, Insights and Forecast - by Type
- 10.2.1. Attributional LCA
- 10.2.2. Consequential LCA
- 10.1. Market Analysis, Insights and Forecast - by Application
- 11. Competitive Analysis
- 11.1. Global Market Share Analysis 2025
- 11.2. Company Profiles
- 11.2.1 SCS Global Services
- 11.2.1.1. Overview
- 11.2.1.2. Products
- 11.2.1.3. SWOT Analysis
- 11.2.1.4. Recent Developments
- 11.2.1.5. Financials (Based on Availability)
- 11.2.2 Intertek
- 11.2.2.1. Overview
- 11.2.2.2. Products
- 11.2.2.3. SWOT Analysis
- 11.2.2.4. Recent Developments
- 11.2.2.5. Financials (Based on Availability)
- 11.2.3 Anthesis Group
- 11.2.3.1. Overview
- 11.2.3.2. Products
- 11.2.3.3. SWOT Analysis
- 11.2.3.4. Recent Developments
- 11.2.3.5. Financials (Based on Availability)
- 11.2.4 DNV
- 11.2.4.1. Overview
- 11.2.4.2. Products
- 11.2.4.3. SWOT Analysis
- 11.2.4.4. Recent Developments
- 11.2.4.5. Financials (Based on Availability)
- 11.2.5 FORCE Technology
- 11.2.5.1. Overview
- 11.2.5.2. Products
- 11.2.5.3. SWOT Analysis
- 11.2.5.4. Recent Developments
- 11.2.5.5. Financials (Based on Availability)
- 11.2.6 EcoAct
- 11.2.6.1. Overview
- 11.2.6.2. Products
- 11.2.6.3. SWOT Analysis
- 11.2.6.4. Recent Developments
- 11.2.6.5. Financials (Based on Availability)
- 11.2.7 TÜV Rheinland
- 11.2.7.1. Overview
- 11.2.7.2. Products
- 11.2.7.3. SWOT Analysis
- 11.2.7.4. Recent Developments
- 11.2.7.5. Financials (Based on Availability)
- 11.2.8 WAP Sustainability Consulting
- 11.2.8.1. Overview
- 11.2.8.2. Products
- 11.2.8.3. SWOT Analysis
- 11.2.8.4. Recent Developments
- 11.2.8.5. Financials (Based on Availability)
- 11.2.9 Eurofins
- 11.2.9.1. Overview
- 11.2.9.2. Products
- 11.2.9.3. SWOT Analysis
- 11.2.9.4. Recent Developments
- 11.2.9.5. Financials (Based on Availability)
- 11.2.10 SGS
- 11.2.10.1. Overview
- 11.2.10.2. Products
- 11.2.10.3. SWOT Analysis
- 11.2.10.4. Recent Developments
- 11.2.10.5. Financials (Based on Availability)
- 11.2.11 DEKRA
- 11.2.11.1. Overview
- 11.2.11.2. Products
- 11.2.11.3. SWOT Analysis
- 11.2.11.4. Recent Developments
- 11.2.11.5. Financials (Based on Availability)
- 11.2.12 Valpak Limited
- 11.2.12.1. Overview
- 11.2.12.2. Products
- 11.2.12.3. SWOT Analysis
- 11.2.12.4. Recent Developments
- 11.2.12.5. Financials (Based on Availability)
- 11.2.13 Yordas Group
- 11.2.13.1. Overview
- 11.2.13.2. Products
- 11.2.13.3. SWOT Analysis
- 11.2.13.4. Recent Developments
- 11.2.13.5. Financials (Based on Availability)
- 11.2.14 BRE Group
- 11.2.14.1. Overview
- 11.2.14.2. Products
- 11.2.14.3. SWOT Analysis
- 11.2.14.4. Recent Developments
- 11.2.14.5. Financials (Based on Availability)
- 11.2.15 RINA
- 11.2.15.1. Overview
- 11.2.15.2. Products
- 11.2.15.3. SWOT Analysis
- 11.2.15.4. Recent Developments
- 11.2.15.5. Financials (Based on Availability)
- 11.2.1 SCS Global Services
List of Figures
- Figure 1: Global Product And Service Life Cycle Assessment Revenue Breakdown (million, %) by Region 2025 & 2033
- Figure 2: North America Product And Service Life Cycle Assessment Revenue (million), by Application 2025 & 2033
- Figure 3: North America Product And Service Life Cycle Assessment Revenue Share (%), by Application 2025 & 2033
- Figure 4: North America Product And Service Life Cycle Assessment Revenue (million), by Type 2025 & 2033
- Figure 5: North America Product And Service Life Cycle Assessment Revenue Share (%), by Type 2025 & 2033
- Figure 6: North America Product And Service Life Cycle Assessment Revenue (million), by Country 2025 & 2033
- Figure 7: North America Product And Service Life Cycle Assessment Revenue Share (%), by Country 2025 & 2033
- Figure 8: South America Product And Service Life Cycle Assessment Revenue (million), by Application 2025 & 2033
- Figure 9: South America Product And Service Life Cycle Assessment Revenue Share (%), by Application 2025 & 2033
- Figure 10: South America Product And Service Life Cycle Assessment Revenue (million), by Type 2025 & 2033
- Figure 11: South America Product And Service Life Cycle Assessment Revenue Share (%), by Type 2025 & 2033
- Figure 12: South America Product And Service Life Cycle Assessment Revenue (million), by Country 2025 & 2033
- Figure 13: South America Product And Service Life Cycle Assessment Revenue Share (%), by Country 2025 & 2033
- Figure 14: Europe Product And Service Life Cycle Assessment Revenue (million), by Application 2025 & 2033
- Figure 15: Europe Product And Service Life Cycle Assessment Revenue Share (%), by Application 2025 & 2033
- Figure 16: Europe Product And Service Life Cycle Assessment Revenue (million), by Type 2025 & 2033
- Figure 17: Europe Product And Service Life Cycle Assessment Revenue Share (%), by Type 2025 & 2033
- Figure 18: Europe Product And Service Life Cycle Assessment Revenue (million), by Country 2025 & 2033
- Figure 19: Europe Product And Service Life Cycle Assessment Revenue Share (%), by Country 2025 & 2033
- Figure 20: Middle East & Africa Product And Service Life Cycle Assessment Revenue (million), by Application 2025 & 2033
- Figure 21: Middle East & Africa Product And Service Life Cycle Assessment Revenue Share (%), by Application 2025 & 2033
- Figure 22: Middle East & Africa Product And Service Life Cycle Assessment Revenue (million), by Type 2025 & 2033
- Figure 23: Middle East & Africa Product And Service Life Cycle Assessment Revenue Share (%), by Type 2025 & 2033
- Figure 24: Middle East & Africa Product And Service Life Cycle Assessment Revenue (million), by Country 2025 & 2033
- Figure 25: Middle East & Africa Product And Service Life Cycle Assessment Revenue Share (%), by Country 2025 & 2033
- Figure 26: Asia Pacific Product And Service Life Cycle Assessment Revenue (million), by Application 2025 & 2033
- Figure 27: Asia Pacific Product And Service Life Cycle Assessment Revenue Share (%), by Application 2025 & 2033
- Figure 28: Asia Pacific Product And Service Life Cycle Assessment Revenue (million), by Type 2025 & 2033
- Figure 29: Asia Pacific Product And Service Life Cycle Assessment Revenue Share (%), by Type 2025 & 2033
- Figure 30: Asia Pacific Product And Service Life Cycle Assessment Revenue (million), by Country 2025 & 2033
- Figure 31: Asia Pacific Product And Service Life Cycle Assessment Revenue Share (%), by Country 2025 & 2033
List of Tables
- Table 1: Global Product And Service Life Cycle Assessment Revenue million Forecast, by Application 2020 & 2033
- Table 2: Global Product And Service Life Cycle Assessment Revenue million Forecast, by Type 2020 & 2033
- Table 3: Global Product And Service Life Cycle Assessment Revenue million Forecast, by Region 2020 & 2033
- Table 4: Global Product And Service Life Cycle Assessment Revenue million Forecast, by Application 2020 & 2033
- Table 5: Global Product And Service Life Cycle Assessment Revenue million Forecast, by Type 2020 & 2033
- Table 6: Global Product And Service Life Cycle Assessment Revenue million Forecast, by Country 2020 & 2033
- Table 7: United States Product And Service Life Cycle Assessment Revenue (million) Forecast, by Application 2020 & 2033
- Table 8: Canada Product And Service Life Cycle Assessment Revenue (million) Forecast, by Application 2020 & 2033
- Table 9: Mexico Product And Service Life Cycle Assessment Revenue (million) Forecast, by Application 2020 & 2033
- Table 10: Global Product And Service Life Cycle Assessment Revenue million Forecast, by Application 2020 & 2033
- Table 11: Global Product And Service Life Cycle Assessment Revenue million Forecast, by Type 2020 & 2033
- Table 12: Global Product And Service Life Cycle Assessment Revenue million Forecast, by Country 2020 & 2033
- Table 13: Brazil Product And Service Life Cycle Assessment Revenue (million) Forecast, by Application 2020 & 2033
- Table 14: Argentina Product And Service Life Cycle Assessment Revenue (million) Forecast, by Application 2020 & 2033
- Table 15: Rest of South America Product And Service Life Cycle Assessment Revenue (million) Forecast, by Application 2020 & 2033
- Table 16: Global Product And Service Life Cycle Assessment Revenue million Forecast, by Application 2020 & 2033
- Table 17: Global Product And Service Life Cycle Assessment Revenue million Forecast, by Type 2020 & 2033
- Table 18: Global Product And Service Life Cycle Assessment Revenue million Forecast, by Country 2020 & 2033
- Table 19: United Kingdom Product And Service Life Cycle Assessment Revenue (million) Forecast, by Application 2020 & 2033
- Table 20: Germany Product And Service Life Cycle Assessment Revenue (million) Forecast, by Application 2020 & 2033
- Table 21: France Product And Service Life Cycle Assessment Revenue (million) Forecast, by Application 2020 & 2033
- Table 22: Italy Product And Service Life Cycle Assessment Revenue (million) Forecast, by Application 2020 & 2033
- Table 23: Spain Product And Service Life Cycle Assessment Revenue (million) Forecast, by Application 2020 & 2033
- Table 24: Russia Product And Service Life Cycle Assessment Revenue (million) Forecast, by Application 2020 & 2033
- Table 25: Benelux Product And Service Life Cycle Assessment Revenue (million) Forecast, by Application 2020 & 2033
- Table 26: Nordics Product And Service Life Cycle Assessment Revenue (million) Forecast, by Application 2020 & 2033
- Table 27: Rest of Europe Product And Service Life Cycle Assessment Revenue (million) Forecast, by Application 2020 & 2033
- Table 28: Global Product And Service Life Cycle Assessment Revenue million Forecast, by Application 2020 & 2033
- Table 29: Global Product And Service Life Cycle Assessment Revenue million Forecast, by Type 2020 & 2033
- Table 30: Global Product And Service Life Cycle Assessment Revenue million Forecast, by Country 2020 & 2033
- Table 31: Turkey Product And Service Life Cycle Assessment Revenue (million) Forecast, by Application 2020 & 2033
- Table 32: Israel Product And Service Life Cycle Assessment Revenue (million) Forecast, by Application 2020 & 2033
- Table 33: GCC Product And Service Life Cycle Assessment Revenue (million) Forecast, by Application 2020 & 2033
- Table 34: North Africa Product And Service Life Cycle Assessment Revenue (million) Forecast, by Application 2020 & 2033
- Table 35: South Africa Product And Service Life Cycle Assessment Revenue (million) Forecast, by Application 2020 & 2033
- Table 36: Rest of Middle East & Africa Product And Service Life Cycle Assessment Revenue (million) Forecast, by Application 2020 & 2033
- Table 37: Global Product And Service Life Cycle Assessment Revenue million Forecast, by Application 2020 & 2033
- Table 38: Global Product And Service Life Cycle Assessment Revenue million Forecast, by Type 2020 & 2033
- Table 39: Global Product And Service Life Cycle Assessment Revenue million Forecast, by Country 2020 & 2033
- Table 40: China Product And Service Life Cycle Assessment Revenue (million) Forecast, by Application 2020 & 2033
- Table 41: India Product And Service Life Cycle Assessment Revenue (million) Forecast, by Application 2020 & 2033
- Table 42: Japan Product And Service Life Cycle Assessment Revenue (million) Forecast, by Application 2020 & 2033
- Table 43: South Korea Product And Service Life Cycle Assessment Revenue (million) Forecast, by Application 2020 & 2033
- Table 44: ASEAN Product And Service Life Cycle Assessment Revenue (million) Forecast, by Application 2020 & 2033
- Table 45: Oceania Product And Service Life Cycle Assessment Revenue (million) Forecast, by Application 2020 & 2033
- Table 46: Rest of Asia Pacific Product And Service Life Cycle Assessment Revenue (million) Forecast, by Application 2020 & 2033
Frequently Asked Questions
1. What is the projected Compound Annual Growth Rate (CAGR) of the Product And Service Life Cycle Assessment?
The projected CAGR is approximately 6.7%.
2. Which companies are prominent players in the Product And Service Life Cycle Assessment?
Key companies in the market include SCS Global Services, Intertek, Anthesis Group, DNV, FORCE Technology, EcoAct, TÜV Rheinland, WAP Sustainability Consulting, Eurofins, SGS, DEKRA, Valpak Limited, Yordas Group, BRE Group, RINA.
3. What are the main segments of the Product And Service Life Cycle Assessment?
The market segments include Application, Type.
4. Can you provide details about the market size?
The market size is estimated to be USD 2500 million as of 2022.
5. What are some drivers contributing to market growth?
N/A
6. What are the notable trends driving market growth?
N/A
7. Are there any restraints impacting market growth?
N/A
8. Can you provide examples of recent developments in the market?
N/A
9. What pricing options are available for accessing the report?
Pricing options include single-user, multi-user, and enterprise licenses priced at USD 2900.00, USD 4350.00, and USD 5800.00 respectively.
10. Is the market size provided in terms of value or volume?
The market size is provided in terms of value, measured in million.
11. Are there any specific market keywords associated with the report?
Yes, the market keyword associated with the report is "Product And Service Life Cycle Assessment," which aids in identifying and referencing the specific market segment covered.
12. How do I determine which pricing option suits my needs best?
The pricing options vary based on user requirements and access needs. Individual users may opt for single-user licenses, while businesses requiring broader access may choose multi-user or enterprise licenses for cost-effective access to the report.
13. Are there any additional resources or data provided in the Product And Service Life Cycle Assessment report?
While the report offers comprehensive insights, it's advisable to review the specific contents or supplementary materials provided to ascertain if additional resources or data are available.
14. How can I stay updated on further developments or reports in the Product And Service Life Cycle Assessment?
To stay informed about further developments, trends, and reports in the Product And Service Life Cycle Assessment, consider subscribing to industry newsletters, following relevant companies and organizations, or regularly checking reputable industry news sources and publications.
Methodology
Step 1 - Identification of Relevant Samples Size from Population Database


Step 2 - Approaches for Defining Global Market Size (Value, Volume* & Price*)

Note*: In applicable scenarios
Step 3 - Data Sources
Primary Research
- Web Analytics
- Survey Reports
- Research Institute
- Latest Research Reports
- Opinion Leaders
Secondary Research
- Annual Reports
- White Paper
- Latest Press Release
- Industry Association
- Paid Database
- Investor Presentations

Step 4 - Data Triangulation
Involves using different sources of information in order to increase the validity of a study
These sources are likely to be stakeholders in a program - participants, other researchers, program staff, other community members, and so on.
Then we put all data in single framework & apply various statistical tools to find out the dynamic on the market.
During the analysis stage, feedback from the stakeholder groups would be compared to determine areas of agreement as well as areas of divergence