

Key Insights
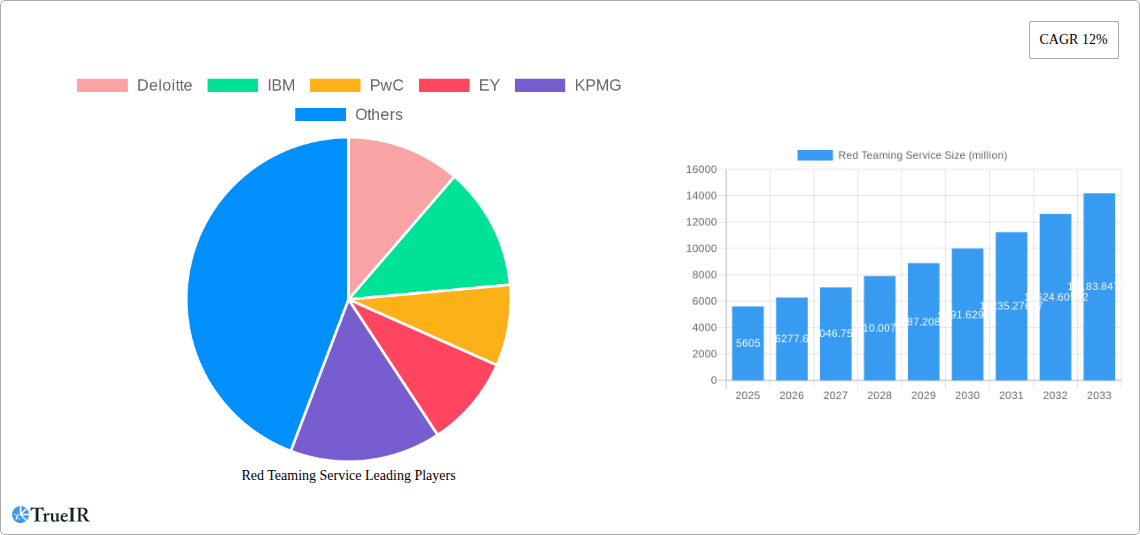
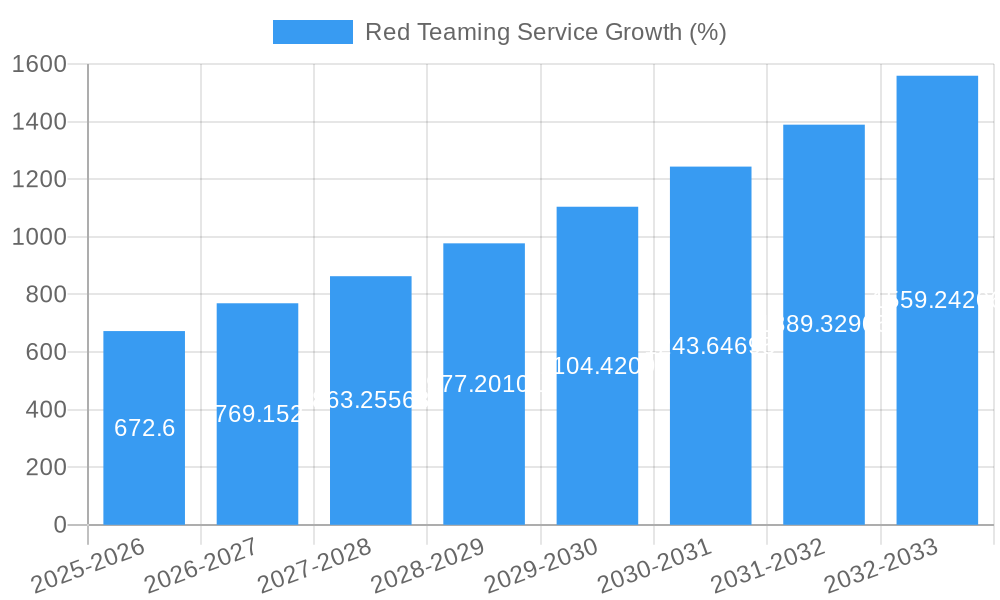
The global red teaming services market, valued at approximately $5.605 billion in 2025, is experiencing robust growth, projected to maintain a Compound Annual Growth Rate (CAGR) of 12% from 2025 to 2033. This expansion is fueled by the escalating sophistication of cyber threats and the increasing regulatory pressure on organizations to bolster their cybersecurity posture. Companies across various sectors are recognizing the critical need for proactive security assessments that go beyond traditional penetration testing, leading to a surge in demand for red teaming services. The rise of cloud computing and the expanding attack surface associated with it are further contributing to market growth. Major players like Deloitte, IBM, PwC, and EY, alongside specialized cybersecurity firms such as CrowdStrike and Mandiant, are driving innovation and competition within the market. The market is segmented by service type (e.g., network, application, physical), deployment model (cloud-based, on-premises), organization size (SMB, enterprise), and industry vertical (finance, healthcare, etc.). While data on specific regional breakdowns is unavailable, it is reasonable to assume that North America and Europe currently hold significant market share, given the concentration of cybersecurity expertise and regulatory stringency in these regions. The continued development of AI and automation in threat detection is expected to influence the market in the coming years, while potential restraints include the high cost of services and a shortage of skilled red team professionals.
The forecast period of 2025-2033 will likely see further market consolidation as larger firms acquire smaller specialized companies. This will increase the breadth and depth of services offered, potentially leading to more comprehensive and integrated security solutions for clients. The increasing adoption of managed security service provider (MSSP) models is also expected to significantly impact the market, enabling organizations to outsource their red teaming needs efficiently. The continued focus on regulatory compliance, particularly within sectors like finance and healthcare, will further contribute to market expansion. Moreover, the growing awareness among organizations of the value of proactive security measures in mitigating potential financial and reputational damage will drive long-term market growth.
Red Teaming Service Market Report: A Comprehensive Analysis (2019-2033)
This dynamic report provides a comprehensive analysis of the global Red Teaming Service market, offering invaluable insights for businesses, investors, and policymakers. With a study period spanning 2019-2033, a base year of 2025, and an estimated and forecast period of 2025-2033, this report leverages rigorous research and data analysis to forecast a market exceeding $XX million by 2033. The report covers historical data (2019-2024) and projects future trends with a focus on key players, market segments, and growth drivers.
Red Teaming Service Market Structure & Competitive Landscape
The global Red Teaming Service market is characterized by a moderately consolidated structure, with a few major players holding significant market share. Deloitte, IBM, PwC, EY, and KPMG are among the leading global providers, commanding a combined market share estimated at xx%. However, the market also features a substantial number of smaller, specialized firms offering niche services. This competitive landscape is further shaped by ongoing mergers and acquisitions (M&A) activity, with an estimated $XX million in M&A deals recorded between 2019 and 2024. Innovation is a crucial driver, with continuous advancements in penetration testing methodologies, automation tools, and threat intelligence impacting market dynamics. Regulatory changes, particularly concerning data privacy and cybersecurity compliance, significantly influence market growth and demand. Product substitution is limited, as the specialized nature of red teaming services necessitates expertise beyond general cybersecurity solutions. The end-user segmentation is diverse, encompassing various industries including finance, healthcare, government, and technology, each with specific needs and priorities.
- Market Concentration: High concentration among major players (Deloitte, IBM, PwC, etc.) but significant fragmentation in the smaller firms segment.
- Innovation Drivers: AI-powered penetration testing, advanced threat simulation, and integration of threat intelligence platforms.
- Regulatory Impacts: GDPR, CCPA, and other data privacy regulations drive demand for robust security assessments.
- Product Substitutes: Limited substitutes due to the highly specialized nature of red teaming.
- End-User Segmentation: Finance, Healthcare, Government, Technology, and other key sectors.
- M&A Trends: A growing number of acquisitions of smaller specialized firms by larger players, consolidating market share and capabilities.
Red Teaming Service Market Trends & Opportunities
The global Red Teaming Service market is experiencing robust growth, projected to reach $XX million by 2033, exhibiting a Compound Annual Growth Rate (CAGR) of xx% during the forecast period. This growth is fueled by several key trends. Increasing cyber threats across all industries are driving greater adoption of proactive security measures. The shift towards cloud computing and remote work environments has expanded the attack surface and increased the need for sophisticated security assessments. Organizations are increasingly recognizing the value of red teaming in identifying critical vulnerabilities before attackers exploit them. This is further enhanced by increased awareness of regulatory compliance mandates. The market penetration rate is projected to increase from xx% in 2025 to xx% by 2033. Competitive dynamics are shaped by innovation, pricing strategies, and service differentiation, with a growing focus on advanced threat modeling, AI-driven analytics, and managed security service offerings.
Dominant Markets & Segments in Red Teaming Service
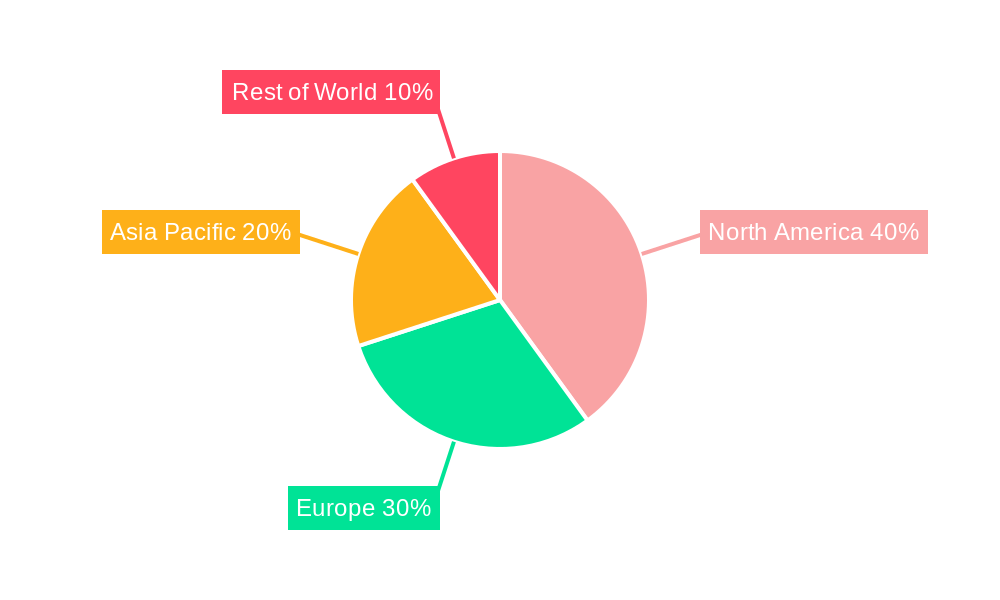
The North American market currently dominates the global Red Teaming Service landscape, holding the largest market share due to factors such as high cybersecurity awareness, stringent regulatory compliance requirements, and a mature IT infrastructure. The region's robust economy and significant investment in cybersecurity solutions are significant drivers. Europe and Asia-Pacific are also experiencing substantial growth, although at a slightly slower pace.
- Key Growth Drivers in North America:
- Stringent regulatory environment (e.g., HIPAA, NIST Cybersecurity Framework).
- High concentration of financial institutions and tech companies.
- Extensive investment in cybersecurity infrastructure and talent.
- Key Growth Drivers in Europe: GDPR compliance driving demand for robust security assessments.
- Key Growth Drivers in Asia-Pacific: Increasing cyberattacks and growing adoption of cloud-based services.
The financial services sector currently leads market segmentation due to the high value of data assets and the significant regulatory scrutiny faced by financial institutions. However, growth across other sectors, such as healthcare and government, is expected to increase significantly over the forecast period.
Red Teaming Service Product Analysis
Red Teaming Service offerings are evolving rapidly, incorporating cutting-edge technologies to enhance their effectiveness. The integration of artificial intelligence and machine learning is improving threat modeling, vulnerability identification, and the automation of penetration testing processes. Advanced simulation techniques enable the creation of more realistic and complex attack scenarios, helping organizations better prepare for advanced persistent threats. The competitive advantage is achieved through unique methodologies, specialized expertise, and the ability to deliver high-value insights, moving beyond simple vulnerability reporting to provide actionable threat mitigation recommendations.
Key Drivers, Barriers & Challenges in Red Teaming Service
Key Drivers: Rising cyber threats, increased regulatory pressure, growing adoption of cloud computing and IoT, and the need for proactive security measures are propelling market growth. The increasing sophistication of cyberattacks demands more advanced penetration testing and red teaming services.
Challenges: A shortage of skilled cybersecurity professionals, high service costs, and the complexities of integrating red teaming services within existing security frameworks pose major challenges. Supply chain vulnerabilities impacting the delivery of specialized tools and software pose a secondary challenge, with potential delays and increased costs. Competition from established players and new entrants also puts pressure on pricing and innovation. The regulatory landscape is constantly evolving, creating ongoing compliance requirements for service providers and their clients.
Growth Drivers in the Red Teaming Service Market
The market's growth is fueled by technological advancements (AI-driven penetration testing), increasing cyber threats, expanding regulatory requirements, and heightened awareness of cybersecurity risks across various industry sectors. Economic growth and increased digital transformation also play a crucial role.
Challenges Impacting Red Teaming Service Growth
Key challenges include a shortage of skilled professionals, increasing costs, integration complexity within existing security systems, and the ever-evolving regulatory landscape. Supply chain disruptions can also impact the availability of essential technologies and tools.
Key Players Shaping the Red Teaming Service Market
- Deloitte
- IBM
- PwC
- EY
- KPMG
- Google Cloud (Mandiant)
- Orange Cyberdefense
- CyberArk
- Dell Technologies (Secureworks)
- Check Point Software
- Fortra (Core Security)
- BlackBerry
- CrowdStrike
- Bishop Fox
- Group-IB
- Astra
- SISA
- MindPoint Group
- Kroll
- Black Duck Software, Inc.
- GuidePoint Security
- DataArt
- Cymulate
- West Advanced Technologies Inc
- NSEIT (Aujas)
- Thales (Tesserent)
- Redbot Security
- Rootshell Security
Significant Red Teaming Service Industry Milestones
- 2020: Increased adoption of cloud-based red teaming platforms.
- 2021: Significant investments in AI and ML for enhanced threat modeling.
- 2022: Rise of managed security service providers (MSSPs) integrating red teaming capabilities.
- 2023: Growing focus on DevSecOps and integrating red teaming into the software development lifecycle.
Future Outlook for Red Teaming Service Market
The Red Teaming Service market is poised for continued growth, driven by increasing cyber threats, the expanding attack surface, and stricter regulatory compliance mandates. Strategic opportunities lie in developing AI-powered solutions, expanding into emerging markets, and forging strategic partnerships to deliver comprehensive cybersecurity solutions. The market's future potential is significant, with projections indicating substantial growth over the next decade.
Red Teaming Service Segmentation
-
1. Application
- 1.1. SMEs
- 1.2. Large Enterprise
-
2. Types
- 2.1. External Red Teaming Service
- 2.2. Internal Red Teaming Service
Red Teaming Service Segmentation By Geography
-
1. North America
- 1.1. United States
- 1.2. Canada
- 1.3. Mexico
-
2. South America
- 2.1. Brazil
- 2.2. Argentina
- 2.3. Rest of South America
-
3. Europe
- 3.1. United Kingdom
- 3.2. Germany
- 3.3. France
- 3.4. Italy
- 3.5. Spain
- 3.6. Russia
- 3.7. Benelux
- 3.8. Nordics
- 3.9. Rest of Europe
-
4. Middle East & Africa
- 4.1. Turkey
- 4.2. Israel
- 4.3. GCC
- 4.4. North Africa
- 4.5. South Africa
- 4.6. Rest of Middle East & Africa
-
5. Asia Pacific
- 5.1. China
- 5.2. India
- 5.3. Japan
- 5.4. South Korea
- 5.5. ASEAN
- 5.6. Oceania
- 5.7. Rest of Asia Pacific
Red Teaming Service REPORT HIGHLIGHTS
| Aspects | Details |
|---|---|
| Study Period | 2019-2033 |
| Base Year | 2024 |
| Estimated Year | 2025 |
| Forecast Period | 2025-2033 |
| Historical Period | 2019-2024 |
| Growth Rate | CAGR of 12% from 2019-2033 |
| Segmentation |
|
Table of Contents
- 1. Introduction
- 1.1. Research Scope
- 1.2. Market Segmentation
- 1.3. Research Methodology
- 1.4. Definitions and Assumptions
- 2. Executive Summary
- 2.1. Introduction
- 3. Market Dynamics
- 3.1. Introduction
- 3.2. Market Drivers
- 3.3. Market Restrains
- 3.4. Market Trends
- 4. Market Factor Analysis
- 4.1. Porters Five Forces
- 4.2. Supply/Value Chain
- 4.3. PESTEL analysis
- 4.4. Market Entropy
- 4.5. Patent/Trademark Analysis
- 5. Global Red Teaming Service Analysis, Insights and Forecast, 2019-2031
- 5.1. Market Analysis, Insights and Forecast - by Application
- 5.1.1. SMEs
- 5.1.2. Large Enterprise
- 5.2. Market Analysis, Insights and Forecast - by Types
- 5.2.1. External Red Teaming Service
- 5.2.2. Internal Red Teaming Service
- 5.3. Market Analysis, Insights and Forecast - by Region
- 5.3.1. North America
- 5.3.2. South America
- 5.3.3. Europe
- 5.3.4. Middle East & Africa
- 5.3.5. Asia Pacific
- 5.1. Market Analysis, Insights and Forecast - by Application
- 6. North America Red Teaming Service Analysis, Insights and Forecast, 2019-2031
- 6.1. Market Analysis, Insights and Forecast - by Application
- 6.1.1. SMEs
- 6.1.2. Large Enterprise
- 6.2. Market Analysis, Insights and Forecast - by Types
- 6.2.1. External Red Teaming Service
- 6.2.2. Internal Red Teaming Service
- 6.1. Market Analysis, Insights and Forecast - by Application
- 7. South America Red Teaming Service Analysis, Insights and Forecast, 2019-2031
- 7.1. Market Analysis, Insights and Forecast - by Application
- 7.1.1. SMEs
- 7.1.2. Large Enterprise
- 7.2. Market Analysis, Insights and Forecast - by Types
- 7.2.1. External Red Teaming Service
- 7.2.2. Internal Red Teaming Service
- 7.1. Market Analysis, Insights and Forecast - by Application
- 8. Europe Red Teaming Service Analysis, Insights and Forecast, 2019-2031
- 8.1. Market Analysis, Insights and Forecast - by Application
- 8.1.1. SMEs
- 8.1.2. Large Enterprise
- 8.2. Market Analysis, Insights and Forecast - by Types
- 8.2.1. External Red Teaming Service
- 8.2.2. Internal Red Teaming Service
- 8.1. Market Analysis, Insights and Forecast - by Application
- 9. Middle East & Africa Red Teaming Service Analysis, Insights and Forecast, 2019-2031
- 9.1. Market Analysis, Insights and Forecast - by Application
- 9.1.1. SMEs
- 9.1.2. Large Enterprise
- 9.2. Market Analysis, Insights and Forecast - by Types
- 9.2.1. External Red Teaming Service
- 9.2.2. Internal Red Teaming Service
- 9.1. Market Analysis, Insights and Forecast - by Application
- 10. Asia Pacific Red Teaming Service Analysis, Insights and Forecast, 2019-2031
- 10.1. Market Analysis, Insights and Forecast - by Application
- 10.1.1. SMEs
- 10.1.2. Large Enterprise
- 10.2. Market Analysis, Insights and Forecast - by Types
- 10.2.1. External Red Teaming Service
- 10.2.2. Internal Red Teaming Service
- 10.1. Market Analysis, Insights and Forecast - by Application
- 11. Competitive Analysis
- 11.1. Global Market Share Analysis 2024
- 11.2. Company Profiles
- 11.2.1 Deloitte
- 11.2.1.1. Overview
- 11.2.1.2. Products
- 11.2.1.3. SWOT Analysis
- 11.2.1.4. Recent Developments
- 11.2.1.5. Financials (Based on Availability)
- 11.2.2 IBM
- 11.2.2.1. Overview
- 11.2.2.2. Products
- 11.2.2.3. SWOT Analysis
- 11.2.2.4. Recent Developments
- 11.2.2.5. Financials (Based on Availability)
- 11.2.3 PwC
- 11.2.3.1. Overview
- 11.2.3.2. Products
- 11.2.3.3. SWOT Analysis
- 11.2.3.4. Recent Developments
- 11.2.3.5. Financials (Based on Availability)
- 11.2.4 EY
- 11.2.4.1. Overview
- 11.2.4.2. Products
- 11.2.4.3. SWOT Analysis
- 11.2.4.4. Recent Developments
- 11.2.4.5. Financials (Based on Availability)
- 11.2.5 KPMG
- 11.2.5.1. Overview
- 11.2.5.2. Products
- 11.2.5.3. SWOT Analysis
- 11.2.5.4. Recent Developments
- 11.2.5.5. Financials (Based on Availability)
- 11.2.6 Google Cloud (Mandiant)
- 11.2.6.1. Overview
- 11.2.6.2. Products
- 11.2.6.3. SWOT Analysis
- 11.2.6.4. Recent Developments
- 11.2.6.5. Financials (Based on Availability)
- 11.2.7 Orange Cyberdefense
- 11.2.7.1. Overview
- 11.2.7.2. Products
- 11.2.7.3. SWOT Analysis
- 11.2.7.4. Recent Developments
- 11.2.7.5. Financials (Based on Availability)
- 11.2.8 CyberArk
- 11.2.8.1. Overview
- 11.2.8.2. Products
- 11.2.8.3. SWOT Analysis
- 11.2.8.4. Recent Developments
- 11.2.8.5. Financials (Based on Availability)
- 11.2.9 Dell Technologies (Secureworks)
- 11.2.9.1. Overview
- 11.2.9.2. Products
- 11.2.9.3. SWOT Analysis
- 11.2.9.4. Recent Developments
- 11.2.9.5. Financials (Based on Availability)
- 11.2.10 Check Point Software
- 11.2.10.1. Overview
- 11.2.10.2. Products
- 11.2.10.3. SWOT Analysis
- 11.2.10.4. Recent Developments
- 11.2.10.5. Financials (Based on Availability)
- 11.2.11 Fortra (Core Security)
- 11.2.11.1. Overview
- 11.2.11.2. Products
- 11.2.11.3. SWOT Analysis
- 11.2.11.4. Recent Developments
- 11.2.11.5. Financials (Based on Availability)
- 11.2.12 BlackBerry
- 11.2.12.1. Overview
- 11.2.12.2. Products
- 11.2.12.3. SWOT Analysis
- 11.2.12.4. Recent Developments
- 11.2.12.5. Financials (Based on Availability)
- 11.2.13 CrowdStrike
- 11.2.13.1. Overview
- 11.2.13.2. Products
- 11.2.13.3. SWOT Analysis
- 11.2.13.4. Recent Developments
- 11.2.13.5. Financials (Based on Availability)
- 11.2.14 Bishop Fox
- 11.2.14.1. Overview
- 11.2.14.2. Products
- 11.2.14.3. SWOT Analysis
- 11.2.14.4. Recent Developments
- 11.2.14.5. Financials (Based on Availability)
- 11.2.15 Group-IB
- 11.2.15.1. Overview
- 11.2.15.2. Products
- 11.2.15.3. SWOT Analysis
- 11.2.15.4. Recent Developments
- 11.2.15.5. Financials (Based on Availability)
- 11.2.16 Astra
- 11.2.16.1. Overview
- 11.2.16.2. Products
- 11.2.16.3. SWOT Analysis
- 11.2.16.4. Recent Developments
- 11.2.16.5. Financials (Based on Availability)
- 11.2.17 SISA
- 11.2.17.1. Overview
- 11.2.17.2. Products
- 11.2.17.3. SWOT Analysis
- 11.2.17.4. Recent Developments
- 11.2.17.5. Financials (Based on Availability)
- 11.2.18 MindPoint Group
- 11.2.18.1. Overview
- 11.2.18.2. Products
- 11.2.18.3. SWOT Analysis
- 11.2.18.4. Recent Developments
- 11.2.18.5. Financials (Based on Availability)
- 11.2.19 Kroll
- 11.2.19.1. Overview
- 11.2.19.2. Products
- 11.2.19.3. SWOT Analysis
- 11.2.19.4. Recent Developments
- 11.2.19.5. Financials (Based on Availability)
- 11.2.20 Black Duck Software
- 11.2.20.1. Overview
- 11.2.20.2. Products
- 11.2.20.3. SWOT Analysis
- 11.2.20.4. Recent Developments
- 11.2.20.5. Financials (Based on Availability)
- 11.2.21 Inc.
- 11.2.21.1. Overview
- 11.2.21.2. Products
- 11.2.21.3. SWOT Analysis
- 11.2.21.4. Recent Developments
- 11.2.21.5. Financials (Based on Availability)
- 11.2.22 GuidePoint Security
- 11.2.22.1. Overview
- 11.2.22.2. Products
- 11.2.22.3. SWOT Analysis
- 11.2.22.4. Recent Developments
- 11.2.22.5. Financials (Based on Availability)
- 11.2.23 DataArt
- 11.2.23.1. Overview
- 11.2.23.2. Products
- 11.2.23.3. SWOT Analysis
- 11.2.23.4. Recent Developments
- 11.2.23.5. Financials (Based on Availability)
- 11.2.24 Cymulate
- 11.2.24.1. Overview
- 11.2.24.2. Products
- 11.2.24.3. SWOT Analysis
- 11.2.24.4. Recent Developments
- 11.2.24.5. Financials (Based on Availability)
- 11.2.25 West Advanced Technologies Inc
- 11.2.25.1. Overview
- 11.2.25.2. Products
- 11.2.25.3. SWOT Analysis
- 11.2.25.4. Recent Developments
- 11.2.25.5. Financials (Based on Availability)
- 11.2.26 NSEIT (Aujas)
- 11.2.26.1. Overview
- 11.2.26.2. Products
- 11.2.26.3. SWOT Analysis
- 11.2.26.4. Recent Developments
- 11.2.26.5. Financials (Based on Availability)
- 11.2.27 Thales (Tesserent)
- 11.2.27.1. Overview
- 11.2.27.2. Products
- 11.2.27.3. SWOT Analysis
- 11.2.27.4. Recent Developments
- 11.2.27.5. Financials (Based on Availability)
- 11.2.28 Redbot Security
- 11.2.28.1. Overview
- 11.2.28.2. Products
- 11.2.28.3. SWOT Analysis
- 11.2.28.4. Recent Developments
- 11.2.28.5. Financials (Based on Availability)
- 11.2.29 Rootshell Security
- 11.2.29.1. Overview
- 11.2.29.2. Products
- 11.2.29.3. SWOT Analysis
- 11.2.29.4. Recent Developments
- 11.2.29.5. Financials (Based on Availability)
- 11.2.1 Deloitte
List of Figures
- Figure 1: Global Red Teaming Service Revenue Breakdown (million, %) by Region 2024 & 2032
- Figure 2: North America Red Teaming Service Revenue (million), by Application 2024 & 2032
- Figure 3: North America Red Teaming Service Revenue Share (%), by Application 2024 & 2032
- Figure 4: North America Red Teaming Service Revenue (million), by Types 2024 & 2032
- Figure 5: North America Red Teaming Service Revenue Share (%), by Types 2024 & 2032
- Figure 6: North America Red Teaming Service Revenue (million), by Country 2024 & 2032
- Figure 7: North America Red Teaming Service Revenue Share (%), by Country 2024 & 2032
- Figure 8: South America Red Teaming Service Revenue (million), by Application 2024 & 2032
- Figure 9: South America Red Teaming Service Revenue Share (%), by Application 2024 & 2032
- Figure 10: South America Red Teaming Service Revenue (million), by Types 2024 & 2032
- Figure 11: South America Red Teaming Service Revenue Share (%), by Types 2024 & 2032
- Figure 12: South America Red Teaming Service Revenue (million), by Country 2024 & 2032
- Figure 13: South America Red Teaming Service Revenue Share (%), by Country 2024 & 2032
- Figure 14: Europe Red Teaming Service Revenue (million), by Application 2024 & 2032
- Figure 15: Europe Red Teaming Service Revenue Share (%), by Application 2024 & 2032
- Figure 16: Europe Red Teaming Service Revenue (million), by Types 2024 & 2032
- Figure 17: Europe Red Teaming Service Revenue Share (%), by Types 2024 & 2032
- Figure 18: Europe Red Teaming Service Revenue (million), by Country 2024 & 2032
- Figure 19: Europe Red Teaming Service Revenue Share (%), by Country 2024 & 2032
- Figure 20: Middle East & Africa Red Teaming Service Revenue (million), by Application 2024 & 2032
- Figure 21: Middle East & Africa Red Teaming Service Revenue Share (%), by Application 2024 & 2032
- Figure 22: Middle East & Africa Red Teaming Service Revenue (million), by Types 2024 & 2032
- Figure 23: Middle East & Africa Red Teaming Service Revenue Share (%), by Types 2024 & 2032
- Figure 24: Middle East & Africa Red Teaming Service Revenue (million), by Country 2024 & 2032
- Figure 25: Middle East & Africa Red Teaming Service Revenue Share (%), by Country 2024 & 2032
- Figure 26: Asia Pacific Red Teaming Service Revenue (million), by Application 2024 & 2032
- Figure 27: Asia Pacific Red Teaming Service Revenue Share (%), by Application 2024 & 2032
- Figure 28: Asia Pacific Red Teaming Service Revenue (million), by Types 2024 & 2032
- Figure 29: Asia Pacific Red Teaming Service Revenue Share (%), by Types 2024 & 2032
- Figure 30: Asia Pacific Red Teaming Service Revenue (million), by Country 2024 & 2032
- Figure 31: Asia Pacific Red Teaming Service Revenue Share (%), by Country 2024 & 2032
List of Tables
- Table 1: Global Red Teaming Service Revenue million Forecast, by Region 2019 & 2032
- Table 2: Global Red Teaming Service Revenue million Forecast, by Application 2019 & 2032
- Table 3: Global Red Teaming Service Revenue million Forecast, by Types 2019 & 2032
- Table 4: Global Red Teaming Service Revenue million Forecast, by Region 2019 & 2032
- Table 5: Global Red Teaming Service Revenue million Forecast, by Application 2019 & 2032
- Table 6: Global Red Teaming Service Revenue million Forecast, by Types 2019 & 2032
- Table 7: Global Red Teaming Service Revenue million Forecast, by Country 2019 & 2032
- Table 8: United States Red Teaming Service Revenue (million) Forecast, by Application 2019 & 2032
- Table 9: Canada Red Teaming Service Revenue (million) Forecast, by Application 2019 & 2032
- Table 10: Mexico Red Teaming Service Revenue (million) Forecast, by Application 2019 & 2032
- Table 11: Global Red Teaming Service Revenue million Forecast, by Application 2019 & 2032
- Table 12: Global Red Teaming Service Revenue million Forecast, by Types 2019 & 2032
- Table 13: Global Red Teaming Service Revenue million Forecast, by Country 2019 & 2032
- Table 14: Brazil Red Teaming Service Revenue (million) Forecast, by Application 2019 & 2032
- Table 15: Argentina Red Teaming Service Revenue (million) Forecast, by Application 2019 & 2032
- Table 16: Rest of South America Red Teaming Service Revenue (million) Forecast, by Application 2019 & 2032
- Table 17: Global Red Teaming Service Revenue million Forecast, by Application 2019 & 2032
- Table 18: Global Red Teaming Service Revenue million Forecast, by Types 2019 & 2032
- Table 19: Global Red Teaming Service Revenue million Forecast, by Country 2019 & 2032
- Table 20: United Kingdom Red Teaming Service Revenue (million) Forecast, by Application 2019 & 2032
- Table 21: Germany Red Teaming Service Revenue (million) Forecast, by Application 2019 & 2032
- Table 22: France Red Teaming Service Revenue (million) Forecast, by Application 2019 & 2032
- Table 23: Italy Red Teaming Service Revenue (million) Forecast, by Application 2019 & 2032
- Table 24: Spain Red Teaming Service Revenue (million) Forecast, by Application 2019 & 2032
- Table 25: Russia Red Teaming Service Revenue (million) Forecast, by Application 2019 & 2032
- Table 26: Benelux Red Teaming Service Revenue (million) Forecast, by Application 2019 & 2032
- Table 27: Nordics Red Teaming Service Revenue (million) Forecast, by Application 2019 & 2032
- Table 28: Rest of Europe Red Teaming Service Revenue (million) Forecast, by Application 2019 & 2032
- Table 29: Global Red Teaming Service Revenue million Forecast, by Application 2019 & 2032
- Table 30: Global Red Teaming Service Revenue million Forecast, by Types 2019 & 2032
- Table 31: Global Red Teaming Service Revenue million Forecast, by Country 2019 & 2032
- Table 32: Turkey Red Teaming Service Revenue (million) Forecast, by Application 2019 & 2032
- Table 33: Israel Red Teaming Service Revenue (million) Forecast, by Application 2019 & 2032
- Table 34: GCC Red Teaming Service Revenue (million) Forecast, by Application 2019 & 2032
- Table 35: North Africa Red Teaming Service Revenue (million) Forecast, by Application 2019 & 2032
- Table 36: South Africa Red Teaming Service Revenue (million) Forecast, by Application 2019 & 2032
- Table 37: Rest of Middle East & Africa Red Teaming Service Revenue (million) Forecast, by Application 2019 & 2032
- Table 38: Global Red Teaming Service Revenue million Forecast, by Application 2019 & 2032
- Table 39: Global Red Teaming Service Revenue million Forecast, by Types 2019 & 2032
- Table 40: Global Red Teaming Service Revenue million Forecast, by Country 2019 & 2032
- Table 41: China Red Teaming Service Revenue (million) Forecast, by Application 2019 & 2032
- Table 42: India Red Teaming Service Revenue (million) Forecast, by Application 2019 & 2032
- Table 43: Japan Red Teaming Service Revenue (million) Forecast, by Application 2019 & 2032
- Table 44: South Korea Red Teaming Service Revenue (million) Forecast, by Application 2019 & 2032
- Table 45: ASEAN Red Teaming Service Revenue (million) Forecast, by Application 2019 & 2032
- Table 46: Oceania Red Teaming Service Revenue (million) Forecast, by Application 2019 & 2032
- Table 47: Rest of Asia Pacific Red Teaming Service Revenue (million) Forecast, by Application 2019 & 2032
Frequently Asked Questions
1. What is the projected Compound Annual Growth Rate (CAGR) of the Red Teaming Service?
The projected CAGR is approximately 12%.
2. Which companies are prominent players in the Red Teaming Service?
Key companies in the market include Deloitte, IBM, PwC, EY, KPMG, Google Cloud (Mandiant), Orange Cyberdefense, CyberArk, Dell Technologies (Secureworks), Check Point Software, Fortra (Core Security), BlackBerry, CrowdStrike, Bishop Fox, Group-IB, Astra, SISA, MindPoint Group, Kroll, Black Duck Software, Inc., GuidePoint Security, DataArt, Cymulate, West Advanced Technologies Inc, NSEIT (Aujas), Thales (Tesserent), Redbot Security, Rootshell Security.
3. What are the main segments of the Red Teaming Service?
The market segments include Application, Types.
4. Can you provide details about the market size?
The market size is estimated to be USD 5605 million as of 2022.
5. What are some drivers contributing to market growth?
N/A
6. What are the notable trends driving market growth?
N/A
7. Are there any restraints impacting market growth?
N/A
8. Can you provide examples of recent developments in the market?
N/A
9. What pricing options are available for accessing the report?
Pricing options include single-user, multi-user, and enterprise licenses priced at USD 2900.00, USD 4350.00, and USD 5800.00 respectively.
10. Is the market size provided in terms of value or volume?
The market size is provided in terms of value, measured in million.
11. Are there any specific market keywords associated with the report?
Yes, the market keyword associated with the report is "Red Teaming Service," which aids in identifying and referencing the specific market segment covered.
12. How do I determine which pricing option suits my needs best?
The pricing options vary based on user requirements and access needs. Individual users may opt for single-user licenses, while businesses requiring broader access may choose multi-user or enterprise licenses for cost-effective access to the report.
13. Are there any additional resources or data provided in the Red Teaming Service report?
While the report offers comprehensive insights, it's advisable to review the specific contents or supplementary materials provided to ascertain if additional resources or data are available.
14. How can I stay updated on further developments or reports in the Red Teaming Service?
To stay informed about further developments, trends, and reports in the Red Teaming Service, consider subscribing to industry newsletters, following relevant companies and organizations, or regularly checking reputable industry news sources and publications.
Methodology
Step 1 - Identification of Relevant Samples Size from Population Database


Step 2 - Approaches for Defining Global Market Size (Value, Volume* & Price*)

Note*: In applicable scenarios
Step 3 - Data Sources
Primary Research
- Web Analytics
- Survey Reports
- Research Institute
- Latest Research Reports
- Opinion Leaders
Secondary Research
- Annual Reports
- White Paper
- Latest Press Release
- Industry Association
- Paid Database
- Investor Presentations

Step 4 - Data Triangulation
Involves using different sources of information in order to increase the validity of a study
These sources are likely to be stakeholders in a program - participants, other researchers, program staff, other community members, and so on.
Then we put all data in single framework & apply various statistical tools to find out the dynamic on the market.
During the analysis stage, feedback from the stakeholder groups would be compared to determine areas of agreement as well as areas of divergence
