

Key Insights
The global Fiber Optic Components market is projected for significant expansion, expected to reach a market size of 30.11 billion by 2025, with a projected CAGR of 9.3% from 2025 to 2033. This growth is driven by escalating demand for high-speed data transmission across telecommunications, data centers, and enterprise networks. Key catalysts include the expansion of 5G technology, cloud computing infrastructure, and Fiber-to-the-Home (FTTH) deployments. The increasing integration of optical components in analytical, medical equipment, and advanced lighting systems further bolsters market growth. The Asia Pacific region is anticipated to be a major growth contributor due to substantial digital infrastructure investments and a burgeoning internet user base.
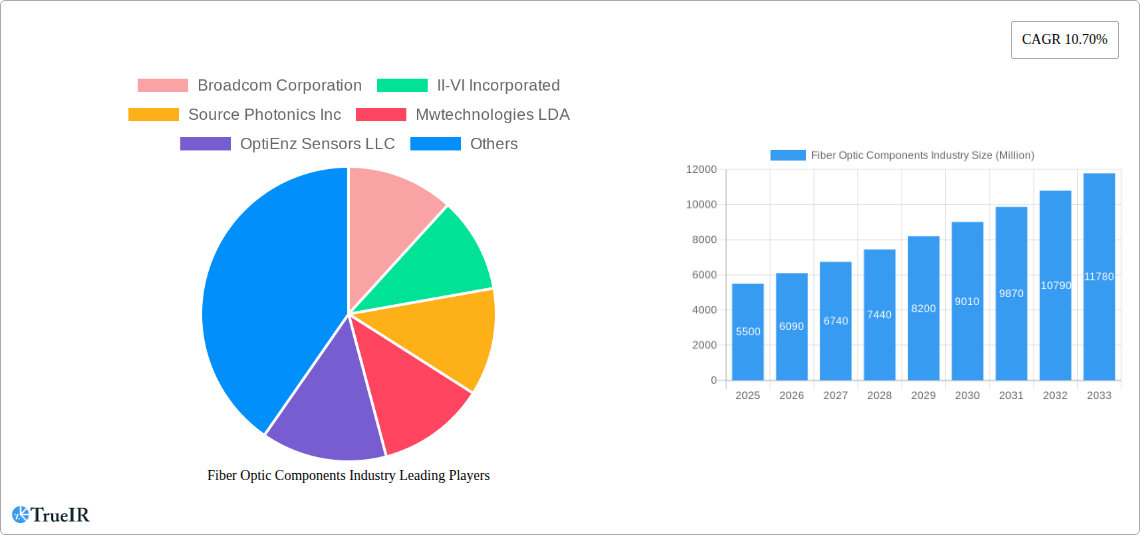
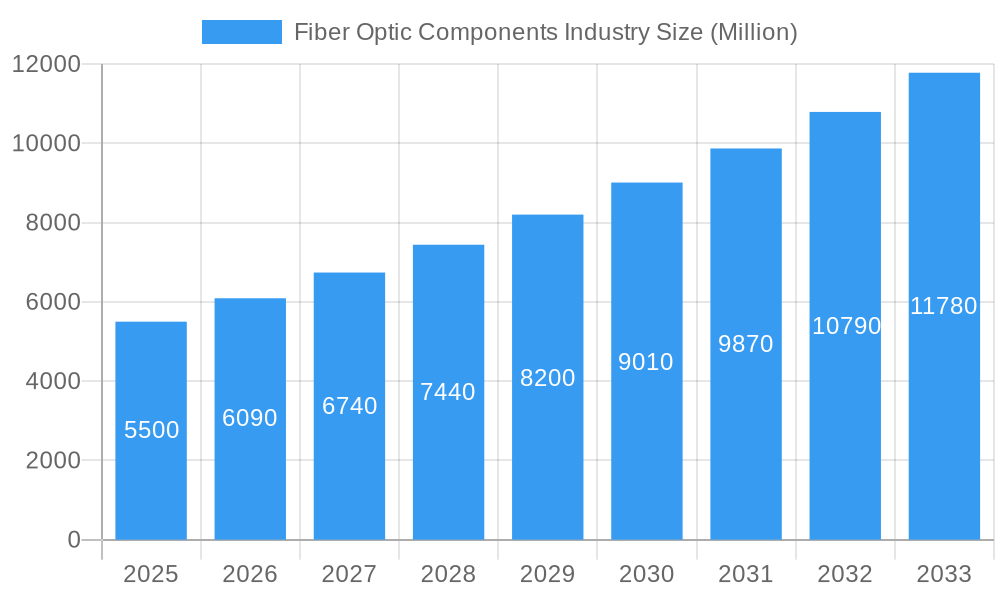
Fiber Optic Components Industry Market Size (In Billion)
The Fiber Optic Components market is characterized by dynamic innovation and intense competition from key players like Broadcom Corporation, II-VI Incorporated, and Lumentum Operations LLC. The market encompasses product segments such as Cables, Amplifiers, Active Optical Cables, Splitters, Connectors, and Transceivers, serving applications including Distributed Sensing, Communications, Analytical and Medical Equipment, and Lighting. While high deployment costs and the need for skilled labor present challenges, ongoing technological advancements, component miniaturization, and cost reduction efforts are expected to mitigate these restraints, ensuring sustained market expansion. Companies are prioritizing product differentiation, strategic collaborations, and global footprint expansion to secure market share.
Fiber Optic Components Industry Company Market Share
Explore the dynamic Fiber Optic Components Industry with our comprehensive market analysis, covering market size, growth, and future forecasts.
Fiber Optic Components Industry Market Structure & Competitive Landscape
The global fiber optic components market is characterized by a moderately concentrated structure, with a handful of major players dominating significant market share. The competitive landscape is heavily influenced by continuous innovation in fiber optic cables, transceivers, and amplifiers, driven by the escalating demand for higher bandwidth and faster data transmission speeds. Key companies like Broadcom Corporation, II-VI Incorporated, and Lumentum Operations LLC are at the forefront of this innovation, investing heavily in research and development for next-generation optical communication components. Regulatory frameworks, particularly those focused on data privacy and infrastructure development, play a crucial role in shaping market entry and expansion strategies. The threat of product substitutes, while present in some niche applications, remains limited due to the superior performance characteristics of fiber optics in high-speed networking. End-user segmentation highlights the dominance of the communications sector, followed by analytical and medical equipment and distributed sensing. Mergers and acquisitions (M&A) activity has been a significant trend, with companies acquiring smaller innovators to expand their product portfolios and market reach. For instance, the market has witnessed an average of 15 M&A deals annually over the past five years, with an estimated aggregate deal value exceeding $5,000 million. Concentration ratios for the top 5 players are estimated to be around 65% in key product segments like high-speed transceivers.
Fiber Optic Components Industry Market Trends & Opportunities
The fiber optic components industry is poised for substantial growth, projected to reach an estimated market size of $150,000 million by 2033, exhibiting a robust Compound Annual Growth Rate (CAGR) of 12.5% from its base year valuation of $65,000 million in 2025. This upward trajectory is underpinned by several transformative trends. The insatiable global demand for high-speed internet connectivity, fueled by the proliferation of cloud computing, 5G deployment, and the Internet of Things (IoT), is a primary market driver. This has led to a significant increase in the deployment of fiber optic networks, directly boosting the demand for essential fiber optic components such as cables, connectors, and transceivers. Technological advancements are revolutionizing the industry, with innovations in areas like silicon photonics, advanced modulation techniques, and Wavelength Division Multiplexing (WDM) enabling higher data capacities and reduced costs. The market penetration of advanced active optical cables for data centers and enterprise networks is expanding rapidly. Consumer preferences are increasingly shifting towards seamless, high-bandwidth experiences, making reliable and fast fiber optic infrastructure a non-negotiable requirement for both residential and commercial users. Competitive dynamics are intensifying, with established players focusing on product differentiation, cost optimization, and strategic partnerships to maintain their market share. Emerging opportunities lie in the development of specialized fiber optic components for new applications, such as advanced distributed sensing systems for infrastructure monitoring and enhanced analytical and medical equipment. The continuous evolution of standards and protocols within the telecommunications industry further necessitates regular upgrades and replacements of existing fiber optic infrastructure, creating a sustained demand for a wide array of components. The burgeoning growth in data centers globally, requiring increasingly sophisticated and high-performance fiber optic transceivers and cables, presents a colossal opportunity for market expansion.
Dominant Markets & Segments in Fiber Optic Components Industry
The fiber optic components industry is witnessing significant dominance in specific regions and product segments. Geographically, North America and Asia-Pacific are leading the market, driven by extensive infrastructure investments and rapid technological adoption. Within Asia-Pacific, countries like China, with its massive telecommunications network expansion and manufacturing capabilities, are pivotal to market growth, accounting for an estimated 40% of the global market revenue.
Segment-wise Analysis:
Type:
- Transceivers: This segment is currently the largest and fastest-growing, driven by the demand for high-speed data transmission in data centers, telecommunications networks, and enterprise environments. The market for 100G, 400G, and 800G transceivers is experiencing exponential growth.
- Cables: Fiber optic cables remain a foundational component, with increasing demand for high-density and specialized fiber types to support next-generation networks. The global fiber optic cable market is projected to reach $25,000 million by 2028.
- Connectors: Essential for reliable connectivity, the demand for high-performance and miniaturized fiber optic connectors is on the rise, particularly in compact networking equipment.
- Amplifiers: Optical amplifiers, such as EDFA and Raman amplifiers, are critical for signal boosting in long-haul and high-speed networks, with steady growth expected.
- Active Optical Cables (AOCs): These are gaining traction for their ease of use and performance in data center interconnects and high-performance computing.
Application:
- Communications: This is by far the largest application segment, encompassing telecommunications, data centers, internet service providers, and enterprise networking. The ongoing 5G rollout and the expansion of broadband infrastructure are significant growth catalysts.
- Distributed Sensing: Growing adoption in industries like oil and gas, infrastructure monitoring, and environmental sensing for its precision and real-time data capabilities. The market is expected to grow at a CAGR of 10% over the forecast period.
- Analytical and Medical Equipment: The use of fiber optics in medical imaging, diagnostics, and laboratory equipment is expanding due to its ability to transmit light without electrical interference.
- Lighting: While a smaller segment, specialized fiber optic lighting solutions are finding applications in architectural, automotive, and industrial lighting.
Key growth drivers across these segments include government initiatives for digital infrastructure development, the increasing demand for bandwidth-intensive services, and the continuous pursuit of higher network speeds and lower latency.
Fiber Optic Components Industry Product Analysis
The fiber optic components industry is characterized by relentless product innovation aimed at enhancing data transmission capacity, reducing signal loss, and improving cost-efficiency. Key advancements include the development of higher-speed transceivers (e.g., 400GbE and 800GbE), miniaturized and robust connectors, and advanced fiber optic cables with specialized coatings for harsh environments. The integration of silicon photonics is enabling more compact and cost-effective optical modules. Competitive advantages are being gained through improved performance metrics like lower power consumption, extended reach, and enhanced reliability, catering to the demanding requirements of modern communications networks and emerging applications in distributed sensing.
Key Drivers, Barriers & Challenges in Fiber Optic Components Industry
Key Drivers: The primary forces propelling the fiber optic components industry are the escalating global demand for high-speed data and telecommunications infrastructure, driven by cloud computing, 5G deployment, and the proliferation of IoT devices. Technological advancements, including the development of next-generation transceivers and higher-capacity fiber optic cables, are crucial. Government initiatives promoting digital transformation and broadband expansion also play a significant role. Economic growth and increased consumer reliance on digital services are further accelerating market expansion.
Barriers & Challenges: Key challenges impacting fiber optic components industry growth include intense price competition among manufacturers, leading to pressure on profit margins. Supply chain disruptions, particularly concerning specialized raw materials and semiconductor components, can lead to production delays and increased costs, with potential impact on revenue estimated at 5-10% during periods of significant disruption. Regulatory hurdles and complex import/export procedures in certain regions can also pose obstacles. Furthermore, the high initial investment required for deploying fiber optic infrastructure can be a restraint for smaller enterprises and developing regions.
Growth Drivers in the Fiber Optic Components Industry Market
The fiber optic components industry market is experiencing robust growth driven by several key factors. The relentless expansion of global data traffic, propelled by cloud computing, streaming services, and the burgeoning Internet of Things (IoT), necessitates continuous upgrades and deployment of advanced fiber optic infrastructure. The ongoing global rollout of 5G networks represents a significant catalyst, demanding high-performance fiber optic transceivers, cables, and amplifiers to support increased bandwidth and lower latency. Government initiatives worldwide aimed at bridging the digital divide and promoting broadband penetration are creating substantial opportunities. Furthermore, technological advancements in areas like silicon photonics and advanced modulation techniques are enabling the development of more efficient and cost-effective optical components, driving adoption across various applications.
Challenges Impacting Fiber Optic Components Industry Growth
Several challenges can impact the growth trajectory of the fiber optic components industry. Intense competition among a large number of manufacturers leads to significant price pressures, potentially squeezing profit margins and hindering R&D investment. Supply chain volatility, particularly for critical raw materials and specialized semiconductor chips, can result in production delays and increased operational costs, potentially impacting revenue by up to 7% in affected quarters. Evolving international trade policies and tariffs can also introduce complexities and increase costs for global supply chains. The high capital expenditure required for large-scale fiber optic network deployment can also be a barrier, especially in regions with limited financial resources.
Key Players Shaping the Fiber Optic Components Industry Market
- Broadcom Corporation
- II-VI Incorporated
- Source Photonics Inc
- Mwtechnologies LDA
- OptiEnz Sensors LLC
- Furukawa Electric Co Ltd
- Acacia Communications Inc
- Reflex Photonics Inc
- NeoPhotonics Corporation
- Fiber Mountain Inc
- Lumentum Operations LLC
- Shenzhen Nokoxin Technology Co Ltd
- O-Net Tech Group
- Accelink Technologies Corporation
- EMCORE Corporation
- Oclaro Inc
- Sumitomo Electric Industries Ltd
- Fujitsu Optical Components Limited
Significant Fiber Optic Components Industry Industry Milestones
- 2019 October: Release of next-generation 400G ZR transceivers by several key players, enabling cost-effective, high-density data center interconnects.
- 2020 March: Launch of advanced passive optical components with enhanced durability and performance for industrial and harsh environment applications.
- 2021 July: Significant investment by major telecommunications companies in expanding fiber-to-the-home (FTTH) networks, boosting demand for fiber optic cables and connectors.
- 2022 February: Breakthroughs in silicon photonics integration, promising smaller, more power-efficient optical modules for data centers.
- 2023 April: Increased focus on sustainable manufacturing practices within the fiber optic components industry, with companies adopting eco-friendly materials and processes.
- 2024 January: Advancements in optical switching technology, leading to more agile and efficient network architectures.
Future Outlook for Fiber Optic Components Industry Market
The future outlook for the fiber optic components industry is exceptionally bright, driven by the relentless global demand for ever-increasing data speeds and connectivity. The continued expansion of 5G networks, the rise of data-intensive applications like AI and virtual reality, and the ongoing development of smart cities and autonomous systems will act as significant growth catalysts. Strategic opportunities lie in the development of highly integrated optical modules, cost-effective solutions for extended reach deployments, and specialized components for niche applications like quantum computing and advanced medical diagnostics. The industry is expected to witness further consolidation and innovation, with a strong emphasis on energy efficiency and advanced materials.
Fiber Optic Components Industry Segmentation
-
1. Type**
- 1.1. Cables
- 1.2. Amplifiers
- 1.3. Active Optical Cables
- 1.4. Splitters
- 1.5. Connectors
- 1.6. Transceivers
- 1.7. Other Types
-
2. Application
- 2.1. Distributed Sensing
- 2.2. Communications
- 2.3. Analytical and Medical Equipment
- 2.4. Lighting
Fiber Optic Components Industry Segmentation By Geography
-
1. North America
- 1.1. United States
- 1.2. Canada
-
2. Europe
- 2.1. United Kingdom
- 2.2. Germany
- 2.3. France
- 2.4. Rest of Europe
-
3. Asia Pacific
- 3.1. China
- 3.2. Japan
- 3.3. India
- 3.4. Rest of Asia Pacific
- 4. Rest of the World
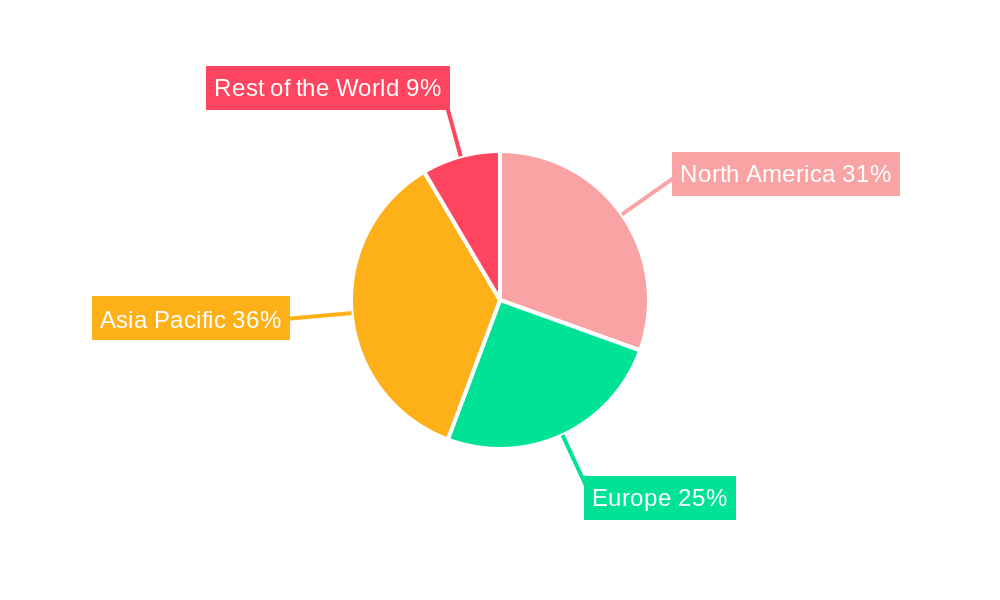
Fiber Optic Components Industry Regional Market Share
Geographic Coverage of Fiber Optic Components Industry
Fiber Optic Components Industry REPORT HIGHLIGHTS
| Aspects | Details |
|---|---|
| Study Period | 2020-2034 |
| Base Year | 2025 |
| Estimated Year | 2026 |
| Forecast Period | 2026-2034 |
| Historical Period | 2020-2025 |
| Growth Rate | CAGR of 9.3% from 2020-2034 |
| Segmentation |
|
Table of Contents
- 1. Introduction
- 1.1. Research Scope
- 1.2. Market Segmentation
- 1.3. Research Objective
- 1.4. Definitions and Assumptions
- 2. Executive Summary
- 2.1. Market Snapshot
- 3. Market Dynamics
- 3.1. Market Drivers
- 3.2. Market Restrains
- 3.3. Market Trends
- 3.4. Market Opportunities
- 4. Market Factor Analysis
- 4.1. Porters Five Forces
- 4.1.1. Bargaining Power of Suppliers
- 4.1.2. Bargaining Power of Buyers
- 4.1.3. Threat of New Entrants
- 4.1.4. Threat of Substitutes
- 4.1.5. Competitive Rivalry
- 4.2. PESTEL analysis
- 4.3. BCG Analysis
- 4.3.1. Stars (High Growth, High Market Share)
- 4.3.2. Cash Cows (Low Growth, High Market Share)
- 4.3.3. Question Mark (High Growth, Low Market Share)
- 4.3.4. Dogs (Low Growth, Low Market Share)
- 4.4. Ansoff Matrix Analysis
- 4.5. Supply Chain Analysis
- 4.6. Regulatory Landscape
- 4.7. Current Market Potential and Opportunity Assessment (TAM–SAM–SOM Framework)
- 4.8. TIR Analyst Note
- 4.1. Porters Five Forces
- 5. Market Analysis, Insights and Forecast 2021-2033
- 5.1. Market Analysis, Insights and Forecast - by Type**
- 5.1.1. Cables
- 5.1.2. Amplifiers
- 5.1.3. Active Optical Cables
- 5.1.4. Splitters
- 5.1.5. Connectors
- 5.1.6. Transceivers
- 5.1.7. Other Types
- 5.2. Market Analysis, Insights and Forecast - by Application
- 5.2.1. Distributed Sensing
- 5.2.2. Communications
- 5.2.3. Analytical and Medical Equipment
- 5.2.4. Lighting
- 5.3. Market Analysis, Insights and Forecast - by Region
- 5.3.1. North America
- 5.3.2. Europe
- 5.3.3. Asia Pacific
- 5.3.4. Rest of the World
- 5.1. Market Analysis, Insights and Forecast - by Type**
- 6. Global Fiber Optic Components Industry Analysis, Insights and Forecast, 2021-2033
- 6.1. Market Analysis, Insights and Forecast - by Type**
- 6.1.1. Cables
- 6.1.2. Amplifiers
- 6.1.3. Active Optical Cables
- 6.1.4. Splitters
- 6.1.5. Connectors
- 6.1.6. Transceivers
- 6.1.7. Other Types
- 6.2. Market Analysis, Insights and Forecast - by Application
- 6.2.1. Distributed Sensing
- 6.2.2. Communications
- 6.2.3. Analytical and Medical Equipment
- 6.2.4. Lighting
- 6.1. Market Analysis, Insights and Forecast - by Type**
- 7. North America Fiber Optic Components Industry Analysis, Insights and Forecast, 2020-2032
- 7.1. Market Analysis, Insights and Forecast - by Type**
- 7.1.1. Cables
- 7.1.2. Amplifiers
- 7.1.3. Active Optical Cables
- 7.1.4. Splitters
- 7.1.5. Connectors
- 7.1.6. Transceivers
- 7.1.7. Other Types
- 7.2. Market Analysis, Insights and Forecast - by Application
- 7.2.1. Distributed Sensing
- 7.2.2. Communications
- 7.2.3. Analytical and Medical Equipment
- 7.2.4. Lighting
- 7.1. Market Analysis, Insights and Forecast - by Type**
- 8. Europe Fiber Optic Components Industry Analysis, Insights and Forecast, 2020-2032
- 8.1. Market Analysis, Insights and Forecast - by Type**
- 8.1.1. Cables
- 8.1.2. Amplifiers
- 8.1.3. Active Optical Cables
- 8.1.4. Splitters
- 8.1.5. Connectors
- 8.1.6. Transceivers
- 8.1.7. Other Types
- 8.2. Market Analysis, Insights and Forecast - by Application
- 8.2.1. Distributed Sensing
- 8.2.2. Communications
- 8.2.3. Analytical and Medical Equipment
- 8.2.4. Lighting
- 8.1. Market Analysis, Insights and Forecast - by Type**
- 9. Asia Pacific Fiber Optic Components Industry Analysis, Insights and Forecast, 2020-2032
- 9.1. Market Analysis, Insights and Forecast - by Type**
- 9.1.1. Cables
- 9.1.2. Amplifiers
- 9.1.3. Active Optical Cables
- 9.1.4. Splitters
- 9.1.5. Connectors
- 9.1.6. Transceivers
- 9.1.7. Other Types
- 9.2. Market Analysis, Insights and Forecast - by Application
- 9.2.1. Distributed Sensing
- 9.2.2. Communications
- 9.2.3. Analytical and Medical Equipment
- 9.2.4. Lighting
- 9.1. Market Analysis, Insights and Forecast - by Type**
- 10. Rest of the World Fiber Optic Components Industry Analysis, Insights and Forecast, 2020-2032
- 10.1. Market Analysis, Insights and Forecast - by Type**
- 10.1.1. Cables
- 10.1.2. Amplifiers
- 10.1.3. Active Optical Cables
- 10.1.4. Splitters
- 10.1.5. Connectors
- 10.1.6. Transceivers
- 10.1.7. Other Types
- 10.2. Market Analysis, Insights and Forecast - by Application
- 10.2.1. Distributed Sensing
- 10.2.2. Communications
- 10.2.3. Analytical and Medical Equipment
- 10.2.4. Lighting
- 10.1. Market Analysis, Insights and Forecast - by Type**
- 11. Competitive Analysis
- 11.1. Company Profiles
- 11.1.1 Broadcom Corporation
- 11.1.1.1. Company Overview
- 11.1.1.2. Products
- 11.1.1.3. Company Financials
- 11.1.1.4. SWOT Analysis
- 11.1.2 II-VI Incorporated
- 11.1.2.1. Company Overview
- 11.1.2.2. Products
- 11.1.2.3. Company Financials
- 11.1.2.4. SWOT Analysis
- 11.1.3 Source Photonics Inc
- 11.1.3.1. Company Overview
- 11.1.3.2. Products
- 11.1.3.3. Company Financials
- 11.1.3.4. SWOT Analysis
- 11.1.4 Mwtechnologies LDA
- 11.1.4.1. Company Overview
- 11.1.4.2. Products
- 11.1.4.3. Company Financials
- 11.1.4.4. SWOT Analysis
- 11.1.5 OptiEnz Sensors LLC
- 11.1.5.1. Company Overview
- 11.1.5.2. Products
- 11.1.5.3. Company Financials
- 11.1.5.4. SWOT Analysis
- 11.1.6 Furukawa Electric Co Ltd
- 11.1.6.1. Company Overview
- 11.1.6.2. Products
- 11.1.6.3. Company Financials
- 11.1.6.4. SWOT Analysis
- 11.1.7 Acacia Communications Inc
- 11.1.7.1. Company Overview
- 11.1.7.2. Products
- 11.1.7.3. Company Financials
- 11.1.7.4. SWOT Analysis
- 11.1.8 Reflex Photonics Inc
- 11.1.8.1. Company Overview
- 11.1.8.2. Products
- 11.1.8.3. Company Financials
- 11.1.8.4. SWOT Analysis
- 11.1.9 NeoPhotonics Corporation
- 11.1.9.1. Company Overview
- 11.1.9.2. Products
- 11.1.9.3. Company Financials
- 11.1.9.4. SWOT Analysis
- 11.1.10 Fiber Mountain Inc
- 11.1.10.1. Company Overview
- 11.1.10.2. Products
- 11.1.10.3. Company Financials
- 11.1.10.4. SWOT Analysis
- 11.1.11 Lumentum Operations LLC
- 11.1.11.1. Company Overview
- 11.1.11.2. Products
- 11.1.11.3. Company Financials
- 11.1.11.4. SWOT Analysis
- 11.1.12 Shenzhen Nokoxin Technology Co Ltd
- 11.1.12.1. Company Overview
- 11.1.12.2. Products
- 11.1.12.3. Company Financials
- 11.1.12.4. SWOT Analysis
- 11.1.13 O-Net Tech Group
- 11.1.13.1. Company Overview
- 11.1.13.2. Products
- 11.1.13.3. Company Financials
- 11.1.13.4. SWOT Analysis
- 11.1.14 Accelink Technologies Corporation
- 11.1.14.1. Company Overview
- 11.1.14.2. Products
- 11.1.14.3. Company Financials
- 11.1.14.4. SWOT Analysis
- 11.1.15 EMCORE Corporation
- 11.1.15.1. Company Overview
- 11.1.15.2. Products
- 11.1.15.3. Company Financials
- 11.1.15.4. SWOT Analysis
- 11.1.16 Oclaro Inc
- 11.1.16.1. Company Overview
- 11.1.16.2. Products
- 11.1.16.3. Company Financials
- 11.1.16.4. SWOT Analysis
- 11.1.17 Sumitomo Electric Industries Ltd
- 11.1.17.1. Company Overview
- 11.1.17.2. Products
- 11.1.17.3. Company Financials
- 11.1.17.4. SWOT Analysis
- 11.1.18 Fujitsu Optical Components Limited
- 11.1.18.1. Company Overview
- 11.1.18.2. Products
- 11.1.18.3. Company Financials
- 11.1.18.4. SWOT Analysis
- 11.1.1 Broadcom Corporation
- 11.2. Market Entropy
- 11.2.1 Company's Key Areas Served
- 11.2.2 Recent Developments
- 11.3. Company Market Share Analysis 2025
- 11.3.1 Top 5 Companies Market Share Analysis
- 11.3.2 Top 3 Companies Market Share Analysis
- 11.4. List of Potential Customers
- 12. Research Methodology
List of Figures
- Figure 1: Global Fiber Optic Components Industry Revenue Breakdown (billion, %) by Region 2025 & 2033
- Figure 2: North America Fiber Optic Components Industry Revenue (billion), by Type** 2025 & 2033
- Figure 3: North America Fiber Optic Components Industry Revenue Share (%), by Type** 2025 & 2033
- Figure 4: North America Fiber Optic Components Industry Revenue (billion), by Application 2025 & 2033
- Figure 5: North America Fiber Optic Components Industry Revenue Share (%), by Application 2025 & 2033
- Figure 6: North America Fiber Optic Components Industry Revenue (billion), by Country 2025 & 2033
- Figure 7: North America Fiber Optic Components Industry Revenue Share (%), by Country 2025 & 2033
- Figure 8: Europe Fiber Optic Components Industry Revenue (billion), by Type** 2025 & 2033
- Figure 9: Europe Fiber Optic Components Industry Revenue Share (%), by Type** 2025 & 2033
- Figure 10: Europe Fiber Optic Components Industry Revenue (billion), by Application 2025 & 2033
- Figure 11: Europe Fiber Optic Components Industry Revenue Share (%), by Application 2025 & 2033
- Figure 12: Europe Fiber Optic Components Industry Revenue (billion), by Country 2025 & 2033
- Figure 13: Europe Fiber Optic Components Industry Revenue Share (%), by Country 2025 & 2033
- Figure 14: Asia Pacific Fiber Optic Components Industry Revenue (billion), by Type** 2025 & 2033
- Figure 15: Asia Pacific Fiber Optic Components Industry Revenue Share (%), by Type** 2025 & 2033
- Figure 16: Asia Pacific Fiber Optic Components Industry Revenue (billion), by Application 2025 & 2033
- Figure 17: Asia Pacific Fiber Optic Components Industry Revenue Share (%), by Application 2025 & 2033
- Figure 18: Asia Pacific Fiber Optic Components Industry Revenue (billion), by Country 2025 & 2033
- Figure 19: Asia Pacific Fiber Optic Components Industry Revenue Share (%), by Country 2025 & 2033
- Figure 20: Rest of the World Fiber Optic Components Industry Revenue (billion), by Type** 2025 & 2033
- Figure 21: Rest of the World Fiber Optic Components Industry Revenue Share (%), by Type** 2025 & 2033
- Figure 22: Rest of the World Fiber Optic Components Industry Revenue (billion), by Application 2025 & 2033
- Figure 23: Rest of the World Fiber Optic Components Industry Revenue Share (%), by Application 2025 & 2033
- Figure 24: Rest of the World Fiber Optic Components Industry Revenue (billion), by Country 2025 & 2033
- Figure 25: Rest of the World Fiber Optic Components Industry Revenue Share (%), by Country 2025 & 2033
List of Tables
- Table 1: Global Fiber Optic Components Industry Revenue billion Forecast, by Type** 2020 & 2033
- Table 2: Global Fiber Optic Components Industry Revenue billion Forecast, by Application 2020 & 2033
- Table 3: Global Fiber Optic Components Industry Revenue billion Forecast, by Region 2020 & 2033
- Table 4: Global Fiber Optic Components Industry Revenue billion Forecast, by Type** 2020 & 2033
- Table 5: Global Fiber Optic Components Industry Revenue billion Forecast, by Application 2020 & 2033
- Table 6: Global Fiber Optic Components Industry Revenue billion Forecast, by Country 2020 & 2033
- Table 7: United States Fiber Optic Components Industry Revenue (billion) Forecast, by Application 2020 & 2033
- Table 8: Canada Fiber Optic Components Industry Revenue (billion) Forecast, by Application 2020 & 2033
- Table 9: Global Fiber Optic Components Industry Revenue billion Forecast, by Type** 2020 & 2033
- Table 10: Global Fiber Optic Components Industry Revenue billion Forecast, by Application 2020 & 2033
- Table 11: Global Fiber Optic Components Industry Revenue billion Forecast, by Country 2020 & 2033
- Table 12: United Kingdom Fiber Optic Components Industry Revenue (billion) Forecast, by Application 2020 & 2033
- Table 13: Germany Fiber Optic Components Industry Revenue (billion) Forecast, by Application 2020 & 2033
- Table 14: France Fiber Optic Components Industry Revenue (billion) Forecast, by Application 2020 & 2033
- Table 15: Rest of Europe Fiber Optic Components Industry Revenue (billion) Forecast, by Application 2020 & 2033
- Table 16: Global Fiber Optic Components Industry Revenue billion Forecast, by Type** 2020 & 2033
- Table 17: Global Fiber Optic Components Industry Revenue billion Forecast, by Application 2020 & 2033
- Table 18: Global Fiber Optic Components Industry Revenue billion Forecast, by Country 2020 & 2033
- Table 19: China Fiber Optic Components Industry Revenue (billion) Forecast, by Application 2020 & 2033
- Table 20: Japan Fiber Optic Components Industry Revenue (billion) Forecast, by Application 2020 & 2033
- Table 21: India Fiber Optic Components Industry Revenue (billion) Forecast, by Application 2020 & 2033
- Table 22: Rest of Asia Pacific Fiber Optic Components Industry Revenue (billion) Forecast, by Application 2020 & 2033
- Table 23: Global Fiber Optic Components Industry Revenue billion Forecast, by Type** 2020 & 2033
- Table 24: Global Fiber Optic Components Industry Revenue billion Forecast, by Application 2020 & 2033
- Table 25: Global Fiber Optic Components Industry Revenue billion Forecast, by Country 2020 & 2033
Frequently Asked Questions
1. What is the projected Compound Annual Growth Rate (CAGR) of the Fiber Optic Components Industry?
The projected CAGR is approximately 9.3%.
2. Which companies are prominent players in the Fiber Optic Components Industry?
Key companies in the market include Broadcom Corporation, II-VI Incorporated, Source Photonics Inc, Mwtechnologies LDA, OptiEnz Sensors LLC, Furukawa Electric Co Ltd, Acacia Communications Inc, Reflex Photonics Inc, NeoPhotonics Corporation, Fiber Mountain Inc, Lumentum Operations LLC, Shenzhen Nokoxin Technology Co Ltd, O-Net Tech Group, Accelink Technologies Corporation, EMCORE Corporation, Oclaro Inc, Sumitomo Electric Industries Ltd, Fujitsu Optical Components Limited.
3. What are the main segments of the Fiber Optic Components Industry?
The market segments include Type**, Application.
4. Can you provide details about the market size?
The market size is estimated to be USD 30.11 billion as of 2022.
5. What are some drivers contributing to market growth?
; Growing Deployment of Data Centers; Increasing Internet Penetration and Data Traffic; Intensifying Demand for Bandwidth and Reliability.
6. What are the notable trends driving market growth?
Fiber Optic Cables to Dominate the Market.
7. Are there any restraints impacting market growth?
Complexity in System Design and Function.
8. Can you provide examples of recent developments in the market?
N/A
9. What pricing options are available for accessing the report?
Pricing options include single-user, multi-user, and enterprise licenses priced at USD 4750, USD 5250, and USD 8750 respectively.
10. Is the market size provided in terms of value or volume?
The market size is provided in terms of value, measured in billion.
11. Are there any specific market keywords associated with the report?
Yes, the market keyword associated with the report is "Fiber Optic Components Industry," which aids in identifying and referencing the specific market segment covered.
12. How do I determine which pricing option suits my needs best?
The pricing options vary based on user requirements and access needs. Individual users may opt for single-user licenses, while businesses requiring broader access may choose multi-user or enterprise licenses for cost-effective access to the report.
13. Are there any additional resources or data provided in the Fiber Optic Components Industry report?
While the report offers comprehensive insights, it's advisable to review the specific contents or supplementary materials provided to ascertain if additional resources or data are available.
14. How can I stay updated on further developments or reports in the Fiber Optic Components Industry?
To stay informed about further developments, trends, and reports in the Fiber Optic Components Industry, consider subscribing to industry newsletters, following relevant companies and organizations, or regularly checking reputable industry news sources and publications.
Methodology
Step 1 - Identification of Relevant Samples Size from Population Database


Step 2 - Approaches for Defining Global Market Size (Value, Volume* & Price*)

Note*: In applicable scenarios
Step 3 - Data Sources
Primary Research
- Web Analytics
- Survey Reports
- Research Institute
- Latest Research Reports
- Opinion Leaders
Secondary Research
- Annual Reports
- White Paper
- Latest Press Release
- Industry Association
- Paid Database
- Investor Presentations

Step 4 - Data Triangulation
Involves using different sources of information in order to increase the validity of a study
These sources are likely to be stakeholders in a program - participants, other researchers, program staff, other community members, and so on.
Then we put all data in single framework & apply various statistical tools to find out the dynamic on the market.
During the analysis stage, feedback from the stakeholder groups would be compared to determine areas of agreement as well as areas of divergence