

Key Insights
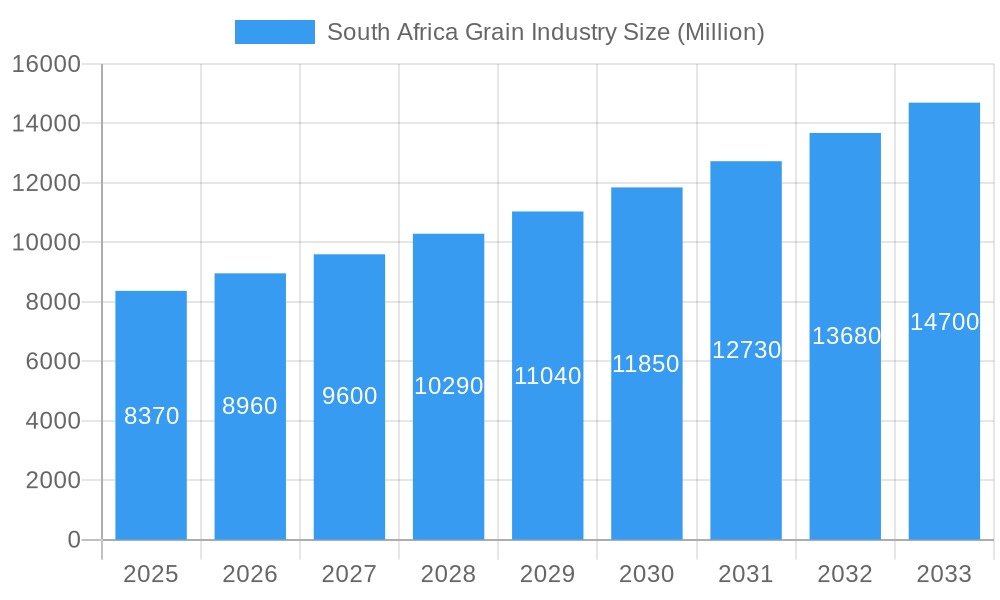
The South African grain industry, valued at $8.37 billion in 2025, is projected to experience robust growth, driven by rising domestic consumption, increasing demand for animal feed, and expanding industrial applications. A Compound Annual Growth Rate (CAGR) of 7% is anticipated from 2025 to 2033, indicating a significant market expansion. Key growth drivers include favorable government policies supporting agricultural production, technological advancements in farming practices leading to higher yields, and increasing urbanization fueling demand for processed food products incorporating grains. The maize segment holds the largest market share due to its widespread use in both human consumption and animal feed. However, growing consumer awareness of health and nutrition is stimulating demand for other grains like oats and sorghum, presenting opportunities for diversification within the industry. Challenges include climate change impacting crop yields, fluctuating global grain prices, and the need for improved infrastructure to facilitate efficient grain transportation and storage. Major players like OVK, Senwes, GWK, AFGRI, Kaap Agri, Grain SA, and BKB Ltd compete within this dynamic landscape, shaping market dynamics through strategic partnerships, investments in technology, and expansion into new markets.
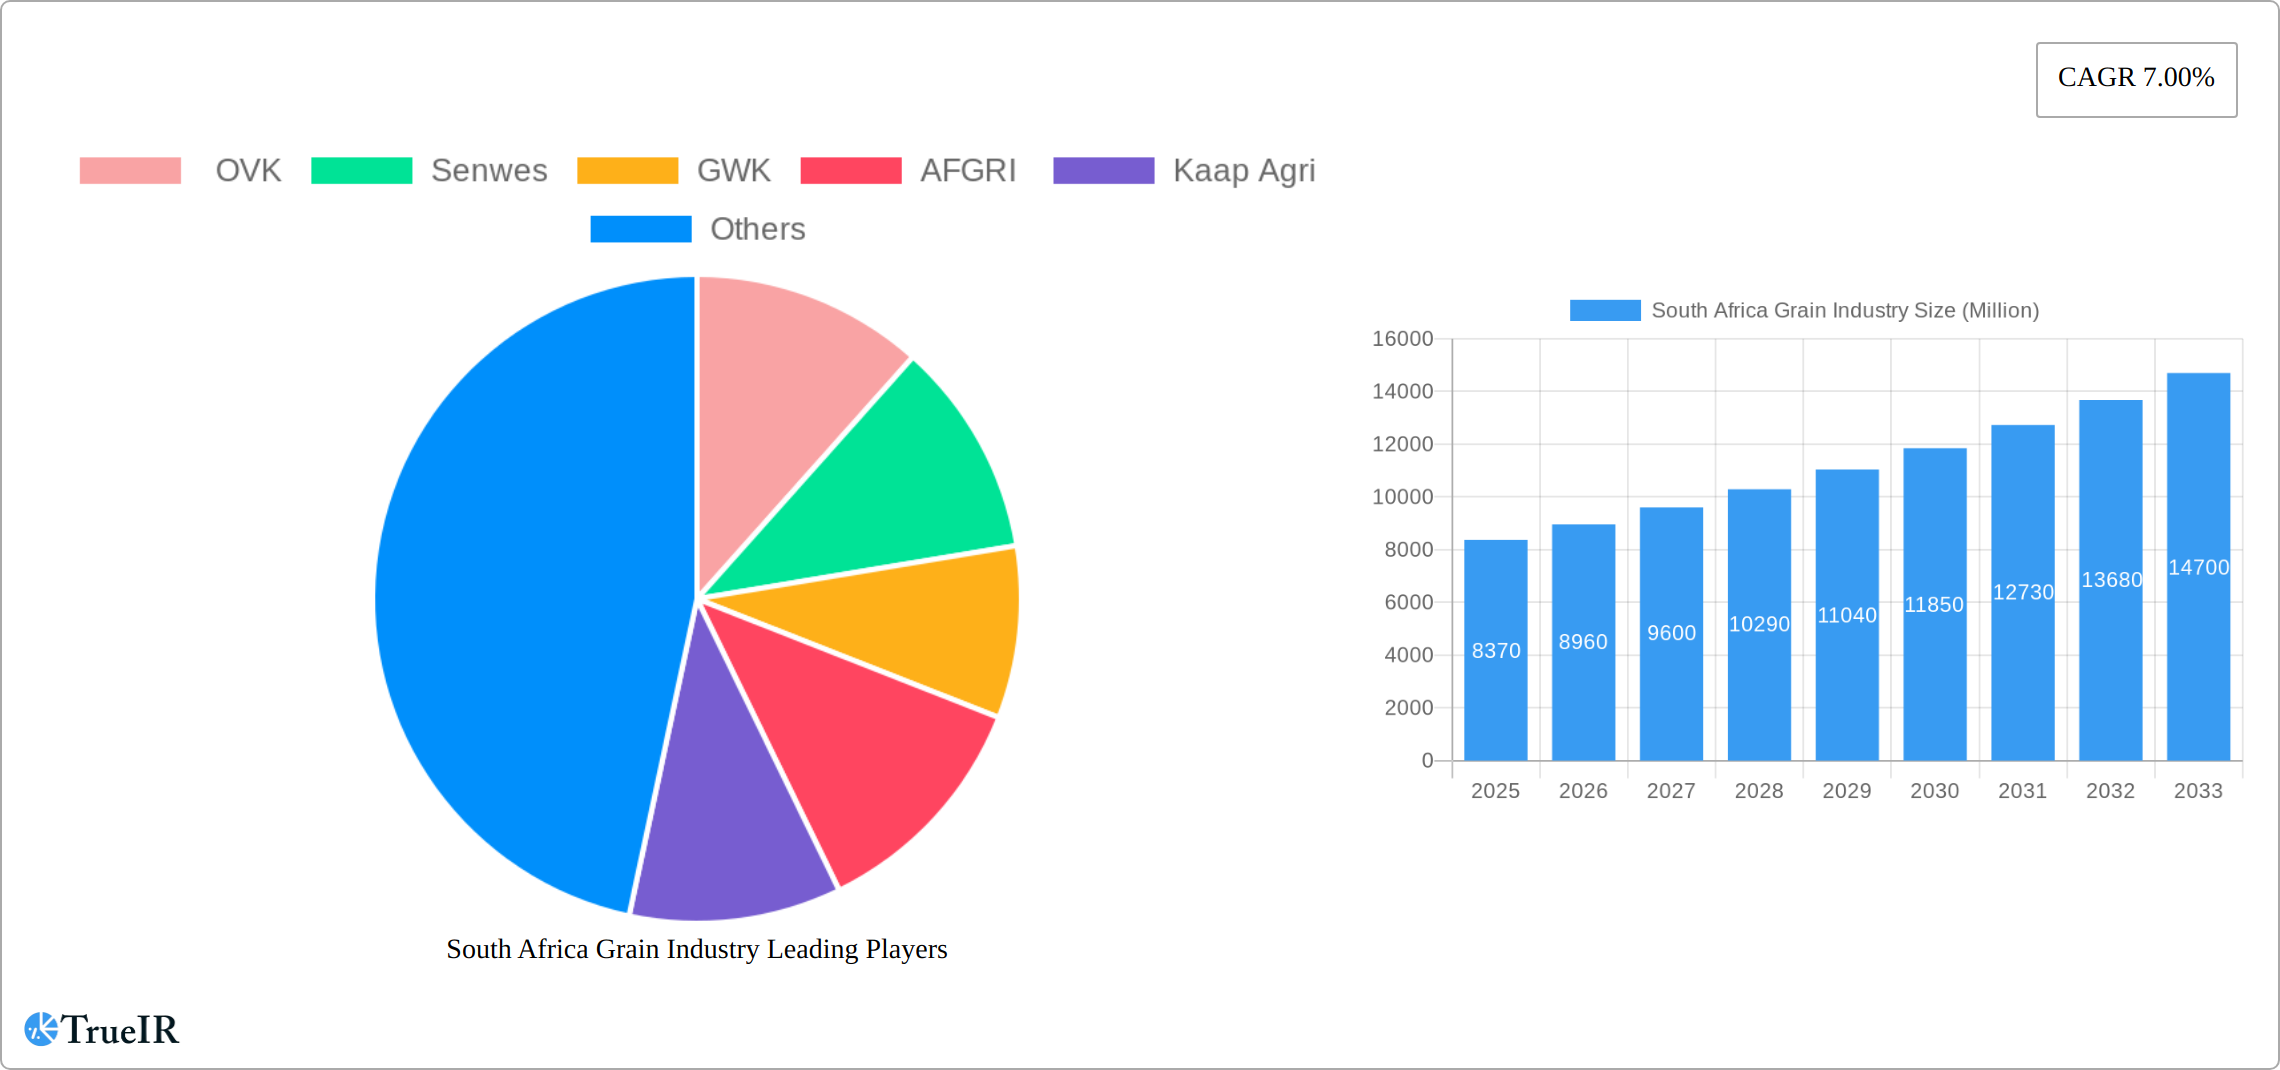
South Africa Grain Industry Market Size (In Billion)
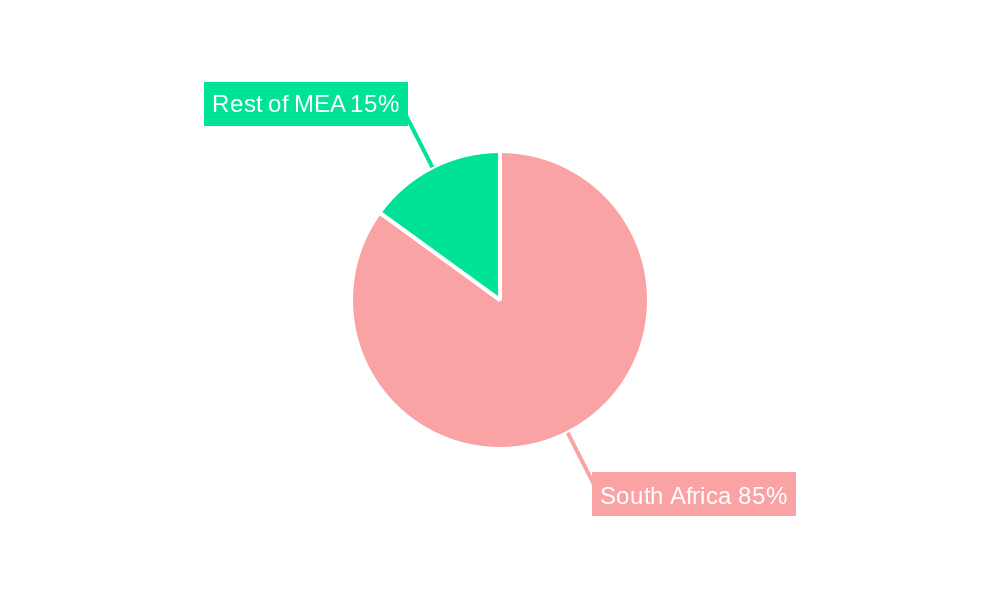
South Africa's strategic location within the Middle East and Africa region positions it as a crucial exporter of grain. Growth within the MEA region will further influence South Africa's grain market. While South Africa is a significant player, the industry faces challenges related to water scarcity, land availability, and competition from international grain producers. The distribution channel analysis shows a blend of direct sales and wholesale/retail channels, with the latter expected to expand as consumer preference shifts toward convenient retail options. Further segmentation by grain type reveals notable growth in alternative grain consumption, reflecting changing dietary preferences and health-conscious trends. The forecast period of 2025-2033 will be crucial to monitor the balance between production capacity and consumer demand, as well as the industry's adaptability to environmental and economic factors.
South Africa Grain Industry Company Market Share
South Africa Grain Industry Market Report: 2019-2033
This comprehensive report provides an in-depth analysis of the South African grain industry, offering invaluable insights for stakeholders seeking to navigate this dynamic market. With a study period spanning 2019-2033, a base year of 2025, and a forecast period of 2025-2033, this report leverages extensive data from the historical period (2019-2024) to paint a clear picture of current trends and future projections. The market size is estimated at xx Million in 2025 and projected to grow at a CAGR of xx% during the forecast period. Key players including OVK, Senwes, GWK, AFGRI, Kaap Agri, Grain SA, and BKB Ltd. are analyzed for their market share, strategies, and competitive positioning. This report is crucial for strategic decision-making within the South African grain sector.
South Africa Grain Industry Market Structure & Competitive Landscape
The South African grain industry exhibits a moderately concentrated market structure. While a few large players such as OVK, Senwes, and AFGRI dominate certain segments, a significant number of smaller players also contribute to the overall market. The industry's concentration ratio (CR4) for maize, for instance, is estimated at xx%, indicating a moderate level of market consolidation. Innovation in the sector is driven by the need for increased efficiency in production, processing, and distribution, as well as the development of drought-resistant and high-yielding crop varieties. Government regulations, particularly those related to food safety and environmental sustainability, significantly impact industry operations. The presence of substitute products, including imported grains, adds competitive pressure. M&A activity within the South African grain industry has been relatively moderate in recent years, with an estimated xx number of transactions recorded between 2019 and 2024. The primary drivers behind these mergers and acquisitions include efforts to achieve economies of scale, expand market reach, and gain access to new technologies.
- Market Concentration: Moderate, with CR4 (Maize) estimated at xx%.
- Innovation Drivers: Efficiency gains, drought-resistant crops, sustainable practices.
- Regulatory Impacts: Food safety standards, environmental regulations.
- Product Substitutes: Imported grains, alternative feed sources.
- End-User Segmentation: Significant portions dedicated to human consumption, animal feed, and industrial uses.
- M&A Trends: Moderate activity, driven by economies of scale and market expansion.
South Africa Grain Industry Market Trends & Opportunities
The South African grain industry is experiencing dynamic growth, propelled by a confluence of factors. A burgeoning population and rising disposable incomes are significantly increasing demand for grain-based food products. Concurrently, the expanding livestock sector fuels robust demand for animal feed, further driving market expansion. Technological advancements in precision agriculture, including GPS-guided machinery, sophisticated data analytics, and the increasing adoption of automation, are substantially enhancing farm productivity and efficiency. Consumer preferences are evolving, with a strong shift towards healthier and more sustainably produced grains, presenting lucrative opportunities for businesses capable of meeting these demands. The competitive landscape is fiercely competitive, demanding strategic investments in innovation, supply chain optimization, efficient logistics, and proactive market diversification strategies. Market projections indicate a substantial growth trajectory, with estimates placing the market size at [Insert Updated Market Size Projection] by 2033. This growth is underpinned by an anticipated increase in export volumes driven by rising global demand and South Africa's competitive pricing in certain grain markets.
Dominant Markets & Segments in South Africa Grain Industry
By Grain Type: Maize dominates the South African grain market, accounting for the largest share of production and consumption. Wheat follows as a significant segment, with barley, sorghum, oats, and other grains contributing to the overall market. Key growth drivers for maize include favorable climatic conditions in certain regions and government support programs. Wheat cultivation benefits from technological advancements in seed varieties and farming techniques.
By End-User: Animal feed constitutes a major end-use segment for grains, reflecting the size of the South African livestock industry. Human consumption, primarily in the form of maize meal and bread, also plays a crucial role. Industrial uses of grains, such as in the brewing and biofuel industries, are experiencing moderate growth.
By Distribution Channel: The distribution of grains involves a mix of direct sales to end-users, wholesale channels supplying retailers and processors, and retail outlets catering to consumers. The wholesale channel dominates the market due to its efficiency in supplying larger quantities of grain to processors and other businesses.
Key growth drivers across all segments include investments in infrastructure, improved storage facilities, and supportive government policies aimed at promoting agricultural productivity.
South Africa Grain Industry Product Analysis
Technological advancements are driving product innovation in the South African grain industry. This includes the development of improved seed varieties with enhanced yield, pest resistance, and nutritional value. Precision agriculture techniques are optimizing resource utilization and minimizing environmental impacts. The focus is shifting toward value-added products, including specialized flours, processed grain products, and animal feed formulations that cater to specific nutritional needs. These innovations are enhancing competitiveness and expanding market opportunities.
Key Drivers, Barriers & Challenges in South Africa Grain Industry
Key Drivers: Favorable climatic conditions in certain regions, rising domestic demand for grains, technological advancements in farming techniques and processing, and supportive government policies to promote agricultural growth. The expanding livestock industry significantly boosts demand for animal feed.
Challenges: Climate change poses a significant risk through unpredictable weather patterns, impacting crop yields. Supply chain inefficiencies, including inadequate storage and transportation infrastructure, lead to post-harvest losses and increased costs. Stringent regulatory compliance and intense competition further add to the challenges faced by industry players.
Growth Drivers in the South Africa Grain Industry Market
The South African grain industry's robust growth is primarily driven by surging domestic demand, fueled by population growth and a corresponding rise in per capita consumption. Technological advancements in farming practices, particularly precision agriculture and the adoption of data-driven decision-making, significantly improve efficiency and yields. Government initiatives aimed at supporting agricultural development, including targeted subsidies, strategic infrastructure investments, and programs promoting sustainable farming practices, play a crucial role in stimulating growth. Furthermore, the continuous expansion of the animal feed industry exerts a significant positive influence on overall grain demand.
Challenges Impacting South Africa Grain Industry Growth
Climate change with its erratic weather patterns is a primary threat, causing production variability and impacting yields. Inadequate infrastructure for storage and transportation leads to significant post-harvest losses. Competition from imported grains and fluctuating international prices affect profitability. Strict regulatory compliance and land reform issues also pose challenges.
Significant South Africa Grain Industry Industry Milestones
- 2020: Government announces a new agricultural support package to improve infrastructure and boost production.
- 2022: Major grain producer, OVK, invests in new processing technology to enhance efficiency.
- 2023: A significant drought impacts maize production, highlighting climate change vulnerability.
- 2024: A new cooperative is formed between several smaller farmers, improving their market access.
Future Outlook for South Africa Grain Industry Market
The South African grain industry is poised for continued, sustainable growth, driven by increasing domestic demand and the potential for significant expansion in export markets. Strategic investments in advanced technologies, the adoption of sustainable farming practices, and robust infrastructure development will be crucial for realizing this potential. Companies demonstrating agility and adaptability to climate change, efficiently optimized supply chains, and the development of innovative value-added products will be exceptionally well-positioned for success in the coming years. Proactively addressing the challenges related to climate change mitigation and adaptation, streamlining supply chain inefficiencies, and navigating regulatory hurdles will be paramount for ensuring sustainable and inclusive growth within the South African grain industry.
South Africa Grain Industry Segmentation
- 1. Maize
- 2. Barley
- 3. Sorghum
- 4. Rice
- 5. Wheat
- 6. Maize
- 7. Barley
- 8. Sorghum
- 9. Rice
- 10. Wheat
South Africa Grain Industry Segmentation By Geography
- 1. South Africa
South Africa Grain Industry Regional Market Share
Geographic Coverage of South Africa Grain Industry
South Africa Grain Industry REPORT HIGHLIGHTS
| Aspects | Details |
|---|---|
| Study Period | 2020-2034 |
| Base Year | 2025 |
| Estimated Year | 2026 |
| Forecast Period | 2026-2034 |
| Historical Period | 2020-2025 |
| Growth Rate | CAGR of 7.00% from 2020-2034 |
| Segmentation |
|
Table of Contents
- 1. Introduction
- 1.1. Research Scope
- 1.2. Market Segmentation
- 1.3. Research Methodology
- 1.4. Definitions and Assumptions
- 2. Executive Summary
- 2.1. Introduction
- 3. Market Dynamics
- 3.1. Introduction
- 3.2. Market Drivers
- 3.2.1. Rising Consumption of Cashew Nuts in the Country; Favorable Government Initiatives
- 3.3. Market Restrains
- 3.3.1. Hazardous Climatic Condition Hinders Cashew Production; Stringent Regulations Related to Food Quality Standards
- 3.4. Market Trends
- 3.4.1. High Regional Trade of Grains is Driving the Market
- 4. Market Factor Analysis
- 4.1. Porters Five Forces
- 4.2. Supply/Value Chain
- 4.3. PESTEL analysis
- 4.4. Market Entropy
- 4.5. Patent/Trademark Analysis
- 5. South Africa Grain Industry Analysis, Insights and Forecast, 2020-2032
- 5.1. Market Analysis, Insights and Forecast - by Maize
- 5.2. Market Analysis, Insights and Forecast - by Barley
- 5.3. Market Analysis, Insights and Forecast - by Sorghum
- 5.4. Market Analysis, Insights and Forecast - by Rice
- 5.5. Market Analysis, Insights and Forecast - by Wheat
- 5.6. Market Analysis, Insights and Forecast - by Maize
- 5.7. Market Analysis, Insights and Forecast - by Barley
- 5.8. Market Analysis, Insights and Forecast - by Sorghum
- 5.9. Market Analysis, Insights and Forecast - by Rice
- 5.10. Market Analysis, Insights and Forecast - by Wheat
- 5.11. Market Analysis, Insights and Forecast - by Region
- 5.11.1. South Africa
- 5.1. Market Analysis, Insights and Forecast - by Maize
- 6. Competitive Analysis
- 6.1. Market Share Analysis 2025
- 6.2. Company Profiles
- 6.2.1 OVK
- 6.2.1.1. Overview
- 6.2.1.2. Products
- 6.2.1.3. SWOT Analysis
- 6.2.1.4. Recent Developments
- 6.2.1.5. Financials (Based on Availability)
- 6.2.2 Senwes
- 6.2.2.1. Overview
- 6.2.2.2. Products
- 6.2.2.3. SWOT Analysis
- 6.2.2.4. Recent Developments
- 6.2.2.5. Financials (Based on Availability)
- 6.2.3 GWK
- 6.2.3.1. Overview
- 6.2.3.2. Products
- 6.2.3.3. SWOT Analysis
- 6.2.3.4. Recent Developments
- 6.2.3.5. Financials (Based on Availability)
- 6.2.4 AFGRI
- 6.2.4.1. Overview
- 6.2.4.2. Products
- 6.2.4.3. SWOT Analysis
- 6.2.4.4. Recent Developments
- 6.2.4.5. Financials (Based on Availability)
- 6.2.5 Kaap Agri
- 6.2.5.1. Overview
- 6.2.5.2. Products
- 6.2.5.3. SWOT Analysis
- 6.2.5.4. Recent Developments
- 6.2.5.5. Financials (Based on Availability)
- 6.2.6 Grain SA
- 6.2.6.1. Overview
- 6.2.6.2. Products
- 6.2.6.3. SWOT Analysis
- 6.2.6.4. Recent Developments
- 6.2.6.5. Financials (Based on Availability)
- 6.2.7 BKB Ltd
- 6.2.7.1. Overview
- 6.2.7.2. Products
- 6.2.7.3. SWOT Analysis
- 6.2.7.4. Recent Developments
- 6.2.7.5. Financials (Based on Availability)
- 6.2.1 OVK
List of Figures
- Figure 1: South Africa Grain Industry Revenue Breakdown (Million, %) by Product 2025 & 2033
- Figure 2: South Africa Grain Industry Share (%) by Company 2025
List of Tables
- Table 1: South Africa Grain Industry Revenue Million Forecast, by Maize 2020 & 2033
- Table 2: South Africa Grain Industry Volume Kiloton Forecast, by Maize 2020 & 2033
- Table 3: South Africa Grain Industry Revenue Million Forecast, by Barley 2020 & 2033
- Table 4: South Africa Grain Industry Volume Kiloton Forecast, by Barley 2020 & 2033
- Table 5: South Africa Grain Industry Revenue Million Forecast, by Sorghum 2020 & 2033
- Table 6: South Africa Grain Industry Volume Kiloton Forecast, by Sorghum 2020 & 2033
- Table 7: South Africa Grain Industry Revenue Million Forecast, by Rice 2020 & 2033
- Table 8: South Africa Grain Industry Volume Kiloton Forecast, by Rice 2020 & 2033
- Table 9: South Africa Grain Industry Revenue Million Forecast, by Wheat 2020 & 2033
- Table 10: South Africa Grain Industry Volume Kiloton Forecast, by Wheat 2020 & 2033
- Table 11: South Africa Grain Industry Revenue Million Forecast, by Maize 2020 & 2033
- Table 12: South Africa Grain Industry Volume Kiloton Forecast, by Maize 2020 & 2033
- Table 13: South Africa Grain Industry Revenue Million Forecast, by Barley 2020 & 2033
- Table 14: South Africa Grain Industry Volume Kiloton Forecast, by Barley 2020 & 2033
- Table 15: South Africa Grain Industry Revenue Million Forecast, by Sorghum 2020 & 2033
- Table 16: South Africa Grain Industry Volume Kiloton Forecast, by Sorghum 2020 & 2033
- Table 17: South Africa Grain Industry Revenue Million Forecast, by Rice 2020 & 2033
- Table 18: South Africa Grain Industry Volume Kiloton Forecast, by Rice 2020 & 2033
- Table 19: South Africa Grain Industry Revenue Million Forecast, by Wheat 2020 & 2033
- Table 20: South Africa Grain Industry Volume Kiloton Forecast, by Wheat 2020 & 2033
- Table 21: South Africa Grain Industry Revenue Million Forecast, by Region 2020 & 2033
- Table 22: South Africa Grain Industry Volume Kiloton Forecast, by Region 2020 & 2033
- Table 23: South Africa Grain Industry Revenue Million Forecast, by Maize 2020 & 2033
- Table 24: South Africa Grain Industry Volume Kiloton Forecast, by Maize 2020 & 2033
- Table 25: South Africa Grain Industry Revenue Million Forecast, by Barley 2020 & 2033
- Table 26: South Africa Grain Industry Volume Kiloton Forecast, by Barley 2020 & 2033
- Table 27: South Africa Grain Industry Revenue Million Forecast, by Sorghum 2020 & 2033
- Table 28: South Africa Grain Industry Volume Kiloton Forecast, by Sorghum 2020 & 2033
- Table 29: South Africa Grain Industry Revenue Million Forecast, by Rice 2020 & 2033
- Table 30: South Africa Grain Industry Volume Kiloton Forecast, by Rice 2020 & 2033
- Table 31: South Africa Grain Industry Revenue Million Forecast, by Wheat 2020 & 2033
- Table 32: South Africa Grain Industry Volume Kiloton Forecast, by Wheat 2020 & 2033
- Table 33: South Africa Grain Industry Revenue Million Forecast, by Maize 2020 & 2033
- Table 34: South Africa Grain Industry Volume Kiloton Forecast, by Maize 2020 & 2033
- Table 35: South Africa Grain Industry Revenue Million Forecast, by Barley 2020 & 2033
- Table 36: South Africa Grain Industry Volume Kiloton Forecast, by Barley 2020 & 2033
- Table 37: South Africa Grain Industry Revenue Million Forecast, by Sorghum 2020 & 2033
- Table 38: South Africa Grain Industry Volume Kiloton Forecast, by Sorghum 2020 & 2033
- Table 39: South Africa Grain Industry Revenue Million Forecast, by Rice 2020 & 2033
- Table 40: South Africa Grain Industry Volume Kiloton Forecast, by Rice 2020 & 2033
- Table 41: South Africa Grain Industry Revenue Million Forecast, by Wheat 2020 & 2033
- Table 42: South Africa Grain Industry Volume Kiloton Forecast, by Wheat 2020 & 2033
- Table 43: South Africa Grain Industry Revenue Million Forecast, by Country 2020 & 2033
- Table 44: South Africa Grain Industry Volume Kiloton Forecast, by Country 2020 & 2033
Frequently Asked Questions
1. What is the projected Compound Annual Growth Rate (CAGR) of the South Africa Grain Industry?
The projected CAGR is approximately 7.00%.
2. Which companies are prominent players in the South Africa Grain Industry?
Key companies in the market include OVK, Senwes, GWK, AFGRI , Kaap Agri, Grain SA , BKB Ltd.
3. What are the main segments of the South Africa Grain Industry?
The market segments include Maize, Barley, Sorghum, Rice, Wheat, Maize, Barley, Sorghum, Rice, Wheat.
4. Can you provide details about the market size?
The market size is estimated to be USD 8.37 Million as of 2022.
5. What are some drivers contributing to market growth?
Rising Consumption of Cashew Nuts in the Country; Favorable Government Initiatives.
6. What are the notable trends driving market growth?
High Regional Trade of Grains is Driving the Market.
7. Are there any restraints impacting market growth?
Hazardous Climatic Condition Hinders Cashew Production; Stringent Regulations Related to Food Quality Standards.
8. Can you provide examples of recent developments in the market?
N/A
9. What pricing options are available for accessing the report?
Pricing options include single-user, multi-user, and enterprise licenses priced at USD 3800, USD 4500, and USD 5800 respectively.
10. Is the market size provided in terms of value or volume?
The market size is provided in terms of value, measured in Million and volume, measured in Kiloton.
11. Are there any specific market keywords associated with the report?
Yes, the market keyword associated with the report is "South Africa Grain Industry," which aids in identifying and referencing the specific market segment covered.
12. How do I determine which pricing option suits my needs best?
The pricing options vary based on user requirements and access needs. Individual users may opt for single-user licenses, while businesses requiring broader access may choose multi-user or enterprise licenses for cost-effective access to the report.
13. Are there any additional resources or data provided in the South Africa Grain Industry report?
While the report offers comprehensive insights, it's advisable to review the specific contents or supplementary materials provided to ascertain if additional resources or data are available.
14. How can I stay updated on further developments or reports in the South Africa Grain Industry?
To stay informed about further developments, trends, and reports in the South Africa Grain Industry, consider subscribing to industry newsletters, following relevant companies and organizations, or regularly checking reputable industry news sources and publications.
Methodology
Step 1 - Identification of Relevant Samples Size from Population Database


Step 2 - Approaches for Defining Global Market Size (Value, Volume* & Price*)

Note*: In applicable scenarios
Step 3 - Data Sources
Primary Research
- Web Analytics
- Survey Reports
- Research Institute
- Latest Research Reports
- Opinion Leaders
Secondary Research
- Annual Reports
- White Paper
- Latest Press Release
- Industry Association
- Paid Database
- Investor Presentations

Step 4 - Data Triangulation
Involves using different sources of information in order to increase the validity of a study
These sources are likely to be stakeholders in a program - participants, other researchers, program staff, other community members, and so on.
Then we put all data in single framework & apply various statistical tools to find out the dynamic on the market.
During the analysis stage, feedback from the stakeholder groups would be compared to determine areas of agreement as well as areas of divergence