

Key Insights
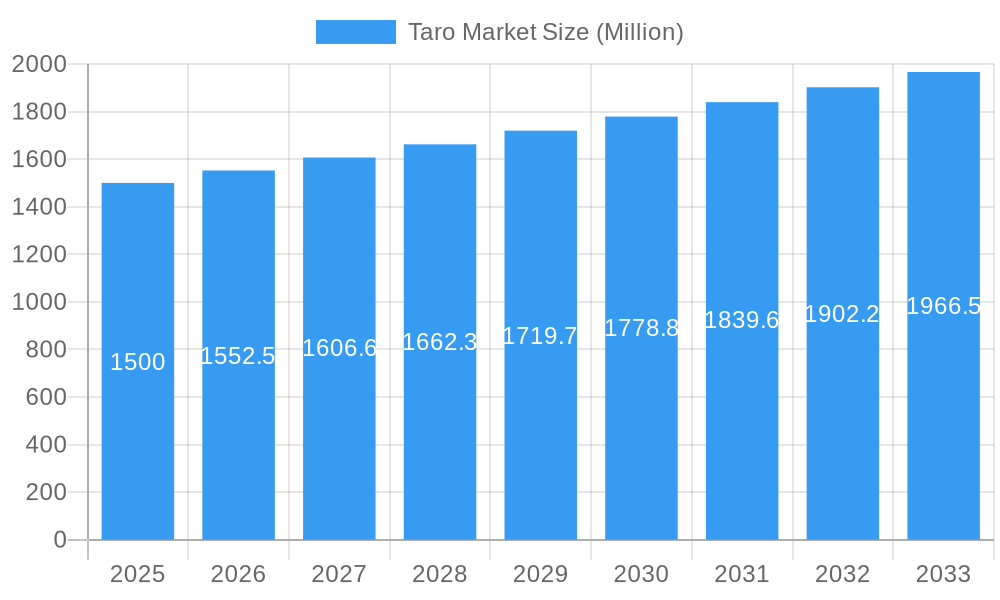
The global taro market, valued at approximately $1.5 billion in 2025, is projected to experience steady growth at a Compound Annual Growth Rate (CAGR) of 3.5% from 2025 to 2033. This growth is fueled by increasing consumer demand for healthier food options, driven by rising awareness of taro's nutritional benefits. The versatility of taro, allowing its use in various food and beverage products like chips, flour, and fresh consumption, contributes significantly to market expansion. Furthermore, the growing popularity of taro-based products in the food service industry, particularly in cafes and restaurants specializing in Asian cuisine, presents a significant avenue for market growth. The pharmaceutical and cosmetic industries are also emerging as promising avenues, with taro extracts increasingly utilized for their potential health and beauty benefits. However, challenges remain, including seasonal production variations affecting supply and price fluctuations, and the need for greater awareness of taro's applications outside traditional markets. Geographic distribution also plays a role, with Asia Pacific currently dominating the market due to high taro consumption and established cultivation practices, although regions like North America and Europe are exhibiting promising growth due to increasing interest in exotic food items and health-conscious trends.
Taro Market Market Size (In Billion)
The segmentation of the taro market offers valuable insights into its dynamic nature. The fresh taro segment currently holds the largest market share within the product type category, but the processed segments, including taro flour and taro chips, are witnessing the fastest growth rates fueled by convenience and shelf-life considerations. Similarly, while the food and beverage sector dominates applications, the pharmaceutical and cosmetic sectors are exhibiting considerable potential for expansion due to ongoing research into taro's bioactive compounds. The diverse end-user segments, including food processors, retail stores, and food service establishments, collectively contribute to the market's overall growth, and the expansion of e-commerce platforms is expected to open new distribution channels, broadening accessibility to diverse consumer bases. Competition within the market is relatively fragmented, with various companies operating at both regional and global levels, offering diverse product portfolios and catering to specific market segments.
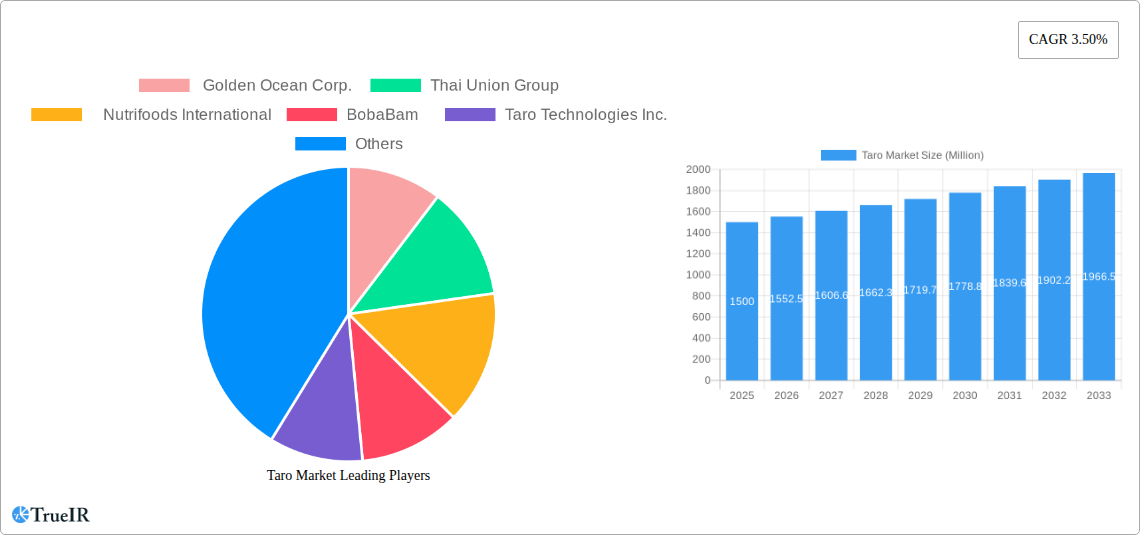
Taro Market Company Market Share
Taro Market: A Comprehensive Market Report (2019-2033)
This dynamic report provides a comprehensive analysis of the Taro Market, offering invaluable insights for industry stakeholders. With a detailed study period spanning 2019-2033, including a base year of 2025 and a forecast period of 2025-2033, this report unveils the market's current state and future trajectory. The report leverages extensive data analysis to project a xx Million market valuation by 2033, exhibiting a CAGR of xx% during the forecast period. This in-depth study covers key market segments, competitive landscapes, and emerging trends, providing actionable intelligence for strategic decision-making.
Taro Market Structure & Competitive Landscape
The Taro market exhibits a moderately concentrated structure, with a xx% market share held by the top five players in 2024. Key players include Golden Ocean Corp., Thai Union Group, Nutrifoods International, BobaBam, and Taro Technologies Inc. The market's competitive landscape is characterized by ongoing innovation in product development, particularly within the Taro Chips and Taro Flour segments. Regulatory changes regarding food safety and sustainability are significantly impacting market players, prompting a shift towards eco-friendly packaging and sourcing practices. Product substitution is limited, with alternatives mainly restricted to other root vegetables, posing a minor threat. The market has witnessed a moderate level of M&A activity in recent years, with approximately xx M&A deals recorded between 2019 and 2024. This activity is primarily driven by players aiming to expand their product portfolios and geographic reach. End-user segmentation reveals a significant reliance on the Food and Beverage sector, accounting for over xx% of total consumption. Future M&A activity is expected to intensify, fueled by the growing demand for convenient and value-added taro products.
- Market Concentration: Herfindahl-Hirschman Index (HHI): xx
- M&A Volume (2019-2024): xx deals
- Major Players: Golden Ocean Corp., Thai Union Group, Nutrifoods International, BobaBam, Taro Technologies Inc.
- Key Regulatory Impacts: Food safety standards, sustainable sourcing regulations.
Taro Market Trends & Opportunities
The global Taro market is experiencing robust growth, driven by increasing consumer demand for healthy and convenient food options. The market size is projected to reach xx Million by 2033, exhibiting a CAGR of xx% from 2025 to 2033. This growth is fueled by several key trends: the rising popularity of Taro-based beverages (e.g., bubble tea), the growing awareness of Taro's nutritional benefits, and the increasing adoption of innovative Taro-based products in the food and beverage, pharmaceutical, and cosmetic industries. Technological advancements in food processing and packaging are further enhancing the market's appeal. However, challenges such as fluctuating raw material prices and seasonal variations in production pose significant hurdles. Market penetration rates for Taro products vary significantly across different regions and consumer segments, with higher penetration in Asia-Pacific and increasing adoption in North America and Europe. The competitive landscape is dynamic, with both established players and new entrants vying for market share.
Dominant Markets & Segments in Taro Market
The Asia-Pacific region dominates the global Taro market, driven by high consumption rates and extensive cultivation in countries like Taiwan, China, and Vietnam. Within the product type segment, Fresh Taro holds the largest market share, followed by Taro Flour and Taro Chips. The Food and Beverage application segment dominates the market, owing to the increased demand for Taro-based beverages and snacks. Food processors are the primary end-users, purchasing significant quantities of fresh Taro and Taro Flour for further processing and distribution.
- Leading Region: Asia-Pacific
- Dominant Product Type: Fresh Taro
- Leading Application: Food and Beverage
- Primary End-User: Food Processors
Key Growth Drivers:
- Asia-Pacific: High Taro consumption, extensive cultivation, favorable climatic conditions.
- Food and Beverage: Growing popularity of Taro-based drinks and snacks, health-conscious consumer trends.
- Food Processors: Large-scale production and distribution capabilities, efficient supply chain management.
Taro Market Product Analysis
Product innovation in the Taro market focuses on enhancing convenience, taste, and nutritional value. Recent advancements include the development of ready-to-eat Taro products, organic Taro options, and Taro-based functional foods fortified with vitamins and minerals. These innovations cater to evolving consumer preferences for healthier and more convenient food choices. The competitive advantage lies in achieving optimal balance of taste, texture, and nutritional value while ensuring cost-effectiveness and sustainable sourcing practices.
Key Drivers, Barriers & Challenges in Taro Market
Key Drivers:
- Rising consumer demand for healthy and nutritious foods.
- Growing popularity of Taro-based beverages and snacks.
- Increasing innovation in Taro-based product development.
- Expansion of retail channels and e-commerce platforms.
Challenges:
- Fluctuating raw material prices and supply chain disruptions.
- Seasonal variations in Taro production.
- Regulatory hurdles and stringent food safety standards.
- Intense competition from substitute products and other root vegetables. This leads to a xx% reduction in overall profitability for some players.
Growth Drivers in the Taro Market
The Taro market is propelled by several key growth drivers, including rising consumer awareness of Taro's nutritional benefits, increasing demand for convenient and ready-to-eat food products, and the emergence of innovative Taro-based applications in the food and beverage, pharmaceutical, and cosmetic industries. Technological advancements in food processing and packaging further enhance the market's growth potential. Favorable government policies supporting the cultivation and processing of Taro also contribute to market expansion.
Challenges Impacting Taro Market Growth
Several challenges hinder Taro market growth. These include fluctuating raw material prices, supply chain disruptions due to seasonal variations in production and geographical limitations, and the imposition of stringent food safety regulations. Intense competition from substitute products and the need for continuous innovation to maintain market relevance present further obstacles.
Key Players Shaping the Taro Market
- Golden Ocean Corp.
- Thai Union Group
- Nutrifoods International
- BobaBam
- Taro Technologies Inc.
Significant Taro Market Industry Milestones
- March 2022: A record-breaking 50-pound taro root was harvested in Hawaii, highlighting the potential for increased production and supply.
- January 2023: BobaBam launched a new Milk Tea and Taro variety pack, expanding the market reach of Taro-based beverages and showcasing eco-friendly packaging. This launch led to a xx% increase in sales for BobaBam within the first quarter.
Future Outlook for Taro Market
The future of the Taro market appears promising, driven by sustained growth in demand, continuous product innovation, and expansion into new markets. Strategic opportunities exist in developing value-added Taro products, exploring new applications in various industries, and leveraging sustainable sourcing practices. The market is expected to witness further consolidation through mergers and acquisitions, as key players seek to enhance their market positions and expand their product portfolios. The growing focus on health and wellness, coupled with the rising popularity of plant-based foods, presents a significant growth catalyst for the Taro market in the coming years.
Taro Market Segmentation
- 1. Production Analysis
- 2. Consumption Analysis
- 3. Import Market Analysis (Value & Volume)
- 4. Export Market Analysis (Value & Volume)
- 5. Price Trend Analysis
Taro Market Segmentation By Geography
-
1. North America
- 1.1. United States
-
2. Europe
- 2.1. France
-
3. Asia Pacific
- 3.1. China
-
4. South America
- 4.1. Brazil
-
5. Middle East And Africa
- 5.1. Turkey
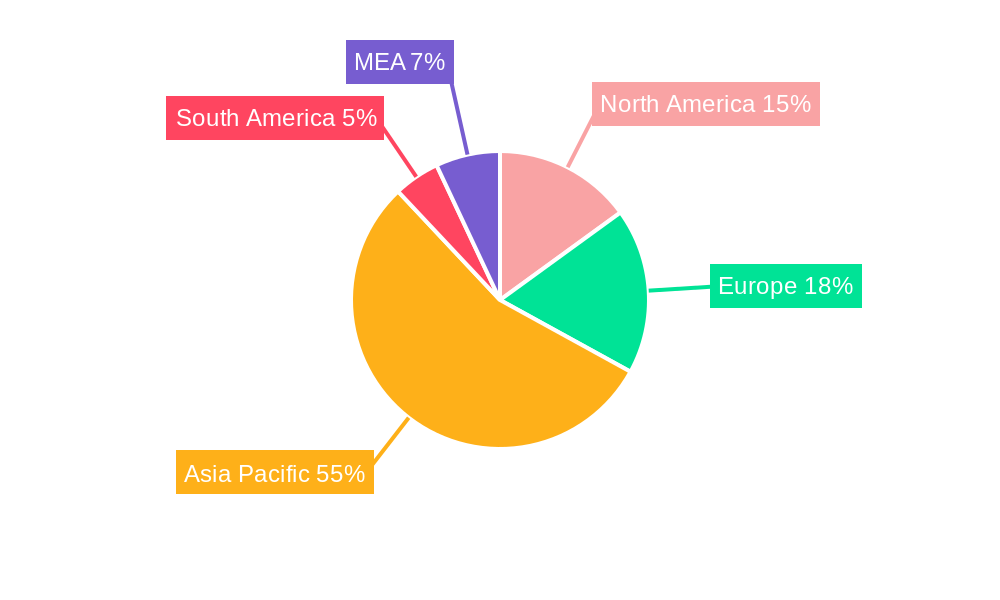
Taro Market Regional Market Share
Geographic Coverage of Taro Market
Taro Market REPORT HIGHLIGHTS
| Aspects | Details |
|---|---|
| Study Period | 2020-2034 |
| Base Year | 2025 |
| Estimated Year | 2026 |
| Forecast Period | 2026-2034 |
| Historical Period | 2020-2025 |
| Growth Rate | CAGR of 3.50% from 2020-2034 |
| Segmentation |
|
Table of Contents
- 1. Introduction
- 1.1. Research Scope
- 1.2. Market Segmentation
- 1.3. Research Methodology
- 1.4. Definitions and Assumptions
- 2. Executive Summary
- 2.1. Introduction
- 3. Market Dynamics
- 3.1. Introduction
- 3.2. Market Drivers
- 3.2.1. ; Awareness About Health Benefits Associated With Pecan Consumption; Wide Application of Pecan
- 3.3. Market Restrains
- 3.3.1. ; Volatility in the Prices; Adverse Weather Conditions Affecting Yield
- 3.4. Market Trends
- 3.4.1. Strong Growth in Taro Production
- 4. Market Factor Analysis
- 4.1. Porters Five Forces
- 4.2. Supply/Value Chain
- 4.3. PESTEL analysis
- 4.4. Market Entropy
- 4.5. Patent/Trademark Analysis
- 5. Global Taro Market Analysis, Insights and Forecast, 2020-2032
- 5.1. Market Analysis, Insights and Forecast - by Production Analysis
- 5.2. Market Analysis, Insights and Forecast - by Consumption Analysis
- 5.3. Market Analysis, Insights and Forecast - by Import Market Analysis (Value & Volume)
- 5.4. Market Analysis, Insights and Forecast - by Export Market Analysis (Value & Volume)
- 5.5. Market Analysis, Insights and Forecast - by Price Trend Analysis
- 5.6. Market Analysis, Insights and Forecast - by Region
- 5.6.1. North America
- 5.6.2. Europe
- 5.6.3. Asia Pacific
- 5.6.4. South America
- 5.6.5. Middle East And Africa
- 5.1. Market Analysis, Insights and Forecast - by Production Analysis
- 6. North America Taro Market Analysis, Insights and Forecast, 2020-2032
- 6.1. Market Analysis, Insights and Forecast - by Production Analysis
- 6.2. Market Analysis, Insights and Forecast - by Consumption Analysis
- 6.3. Market Analysis, Insights and Forecast - by Import Market Analysis (Value & Volume)
- 6.4. Market Analysis, Insights and Forecast - by Export Market Analysis (Value & Volume)
- 6.5. Market Analysis, Insights and Forecast - by Price Trend Analysis
- 6.1. Market Analysis, Insights and Forecast - by Production Analysis
- 7. Europe Taro Market Analysis, Insights and Forecast, 2020-2032
- 7.1. Market Analysis, Insights and Forecast - by Production Analysis
- 7.2. Market Analysis, Insights and Forecast - by Consumption Analysis
- 7.3. Market Analysis, Insights and Forecast - by Import Market Analysis (Value & Volume)
- 7.4. Market Analysis, Insights and Forecast - by Export Market Analysis (Value & Volume)
- 7.5. Market Analysis, Insights and Forecast - by Price Trend Analysis
- 7.1. Market Analysis, Insights and Forecast - by Production Analysis
- 8. Asia Pacific Taro Market Analysis, Insights and Forecast, 2020-2032
- 8.1. Market Analysis, Insights and Forecast - by Production Analysis
- 8.2. Market Analysis, Insights and Forecast - by Consumption Analysis
- 8.3. Market Analysis, Insights and Forecast - by Import Market Analysis (Value & Volume)
- 8.4. Market Analysis, Insights and Forecast - by Export Market Analysis (Value & Volume)
- 8.5. Market Analysis, Insights and Forecast - by Price Trend Analysis
- 8.1. Market Analysis, Insights and Forecast - by Production Analysis
- 9. South America Taro Market Analysis, Insights and Forecast, 2020-2032
- 9.1. Market Analysis, Insights and Forecast - by Production Analysis
- 9.2. Market Analysis, Insights and Forecast - by Consumption Analysis
- 9.3. Market Analysis, Insights and Forecast - by Import Market Analysis (Value & Volume)
- 9.4. Market Analysis, Insights and Forecast - by Export Market Analysis (Value & Volume)
- 9.5. Market Analysis, Insights and Forecast - by Price Trend Analysis
- 9.1. Market Analysis, Insights and Forecast - by Production Analysis
- 10. Middle East And Africa Taro Market Analysis, Insights and Forecast, 2020-2032
- 10.1. Market Analysis, Insights and Forecast - by Production Analysis
- 10.2. Market Analysis, Insights and Forecast - by Consumption Analysis
- 10.3. Market Analysis, Insights and Forecast - by Import Market Analysis (Value & Volume)
- 10.4. Market Analysis, Insights and Forecast - by Export Market Analysis (Value & Volume)
- 10.5. Market Analysis, Insights and Forecast - by Price Trend Analysis
- 10.1. Market Analysis, Insights and Forecast - by Production Analysis
- 11. Competitive Analysis
- 11.1. Global Market Share Analysis 2025
- 11.2. Company Profiles
- 11.2.1 Golden Ocean Corp.
- 11.2.1.1. Overview
- 11.2.1.2. Products
- 11.2.1.3. SWOT Analysis
- 11.2.1.4. Recent Developments
- 11.2.1.5. Financials (Based on Availability)
- 11.2.2 Thai Union Group
- 11.2.2.1. Overview
- 11.2.2.2. Products
- 11.2.2.3. SWOT Analysis
- 11.2.2.4. Recent Developments
- 11.2.2.5. Financials (Based on Availability)
- 11.2.3 Nutrifoods International
- 11.2.3.1. Overview
- 11.2.3.2. Products
- 11.2.3.3. SWOT Analysis
- 11.2.3.4. Recent Developments
- 11.2.3.5. Financials (Based on Availability)
- 11.2.4 BobaBam
- 11.2.4.1. Overview
- 11.2.4.2. Products
- 11.2.4.3. SWOT Analysis
- 11.2.4.4. Recent Developments
- 11.2.4.5. Financials (Based on Availability)
- 11.2.5 Taro Technologies Inc.
- 11.2.5.1. Overview
- 11.2.5.2. Products
- 11.2.5.3. SWOT Analysis
- 11.2.5.4. Recent Developments
- 11.2.5.5. Financials (Based on Availability)
- 11.2.1 Golden Ocean Corp.
List of Figures
- Figure 1: Global Taro Market Revenue Breakdown (Million, %) by Region 2025 & 2033
- Figure 2: Global Taro Market Volume Breakdown (Kiloton, %) by Region 2025 & 2033
- Figure 3: North America Taro Market Revenue (Million), by Production Analysis 2025 & 2033
- Figure 4: North America Taro Market Volume (Kiloton), by Production Analysis 2025 & 2033
- Figure 5: North America Taro Market Revenue Share (%), by Production Analysis 2025 & 2033
- Figure 6: North America Taro Market Volume Share (%), by Production Analysis 2025 & 2033
- Figure 7: North America Taro Market Revenue (Million), by Consumption Analysis 2025 & 2033
- Figure 8: North America Taro Market Volume (Kiloton), by Consumption Analysis 2025 & 2033
- Figure 9: North America Taro Market Revenue Share (%), by Consumption Analysis 2025 & 2033
- Figure 10: North America Taro Market Volume Share (%), by Consumption Analysis 2025 & 2033
- Figure 11: North America Taro Market Revenue (Million), by Import Market Analysis (Value & Volume) 2025 & 2033
- Figure 12: North America Taro Market Volume (Kiloton), by Import Market Analysis (Value & Volume) 2025 & 2033
- Figure 13: North America Taro Market Revenue Share (%), by Import Market Analysis (Value & Volume) 2025 & 2033
- Figure 14: North America Taro Market Volume Share (%), by Import Market Analysis (Value & Volume) 2025 & 2033
- Figure 15: North America Taro Market Revenue (Million), by Export Market Analysis (Value & Volume) 2025 & 2033
- Figure 16: North America Taro Market Volume (Kiloton), by Export Market Analysis (Value & Volume) 2025 & 2033
- Figure 17: North America Taro Market Revenue Share (%), by Export Market Analysis (Value & Volume) 2025 & 2033
- Figure 18: North America Taro Market Volume Share (%), by Export Market Analysis (Value & Volume) 2025 & 2033
- Figure 19: North America Taro Market Revenue (Million), by Price Trend Analysis 2025 & 2033
- Figure 20: North America Taro Market Volume (Kiloton), by Price Trend Analysis 2025 & 2033
- Figure 21: North America Taro Market Revenue Share (%), by Price Trend Analysis 2025 & 2033
- Figure 22: North America Taro Market Volume Share (%), by Price Trend Analysis 2025 & 2033
- Figure 23: North America Taro Market Revenue (Million), by Country 2025 & 2033
- Figure 24: North America Taro Market Volume (Kiloton), by Country 2025 & 2033
- Figure 25: North America Taro Market Revenue Share (%), by Country 2025 & 2033
- Figure 26: North America Taro Market Volume Share (%), by Country 2025 & 2033
- Figure 27: Europe Taro Market Revenue (Million), by Production Analysis 2025 & 2033
- Figure 28: Europe Taro Market Volume (Kiloton), by Production Analysis 2025 & 2033
- Figure 29: Europe Taro Market Revenue Share (%), by Production Analysis 2025 & 2033
- Figure 30: Europe Taro Market Volume Share (%), by Production Analysis 2025 & 2033
- Figure 31: Europe Taro Market Revenue (Million), by Consumption Analysis 2025 & 2033
- Figure 32: Europe Taro Market Volume (Kiloton), by Consumption Analysis 2025 & 2033
- Figure 33: Europe Taro Market Revenue Share (%), by Consumption Analysis 2025 & 2033
- Figure 34: Europe Taro Market Volume Share (%), by Consumption Analysis 2025 & 2033
- Figure 35: Europe Taro Market Revenue (Million), by Import Market Analysis (Value & Volume) 2025 & 2033
- Figure 36: Europe Taro Market Volume (Kiloton), by Import Market Analysis (Value & Volume) 2025 & 2033
- Figure 37: Europe Taro Market Revenue Share (%), by Import Market Analysis (Value & Volume) 2025 & 2033
- Figure 38: Europe Taro Market Volume Share (%), by Import Market Analysis (Value & Volume) 2025 & 2033
- Figure 39: Europe Taro Market Revenue (Million), by Export Market Analysis (Value & Volume) 2025 & 2033
- Figure 40: Europe Taro Market Volume (Kiloton), by Export Market Analysis (Value & Volume) 2025 & 2033
- Figure 41: Europe Taro Market Revenue Share (%), by Export Market Analysis (Value & Volume) 2025 & 2033
- Figure 42: Europe Taro Market Volume Share (%), by Export Market Analysis (Value & Volume) 2025 & 2033
- Figure 43: Europe Taro Market Revenue (Million), by Price Trend Analysis 2025 & 2033
- Figure 44: Europe Taro Market Volume (Kiloton), by Price Trend Analysis 2025 & 2033
- Figure 45: Europe Taro Market Revenue Share (%), by Price Trend Analysis 2025 & 2033
- Figure 46: Europe Taro Market Volume Share (%), by Price Trend Analysis 2025 & 2033
- Figure 47: Europe Taro Market Revenue (Million), by Country 2025 & 2033
- Figure 48: Europe Taro Market Volume (Kiloton), by Country 2025 & 2033
- Figure 49: Europe Taro Market Revenue Share (%), by Country 2025 & 2033
- Figure 50: Europe Taro Market Volume Share (%), by Country 2025 & 2033
- Figure 51: Asia Pacific Taro Market Revenue (Million), by Production Analysis 2025 & 2033
- Figure 52: Asia Pacific Taro Market Volume (Kiloton), by Production Analysis 2025 & 2033
- Figure 53: Asia Pacific Taro Market Revenue Share (%), by Production Analysis 2025 & 2033
- Figure 54: Asia Pacific Taro Market Volume Share (%), by Production Analysis 2025 & 2033
- Figure 55: Asia Pacific Taro Market Revenue (Million), by Consumption Analysis 2025 & 2033
- Figure 56: Asia Pacific Taro Market Volume (Kiloton), by Consumption Analysis 2025 & 2033
- Figure 57: Asia Pacific Taro Market Revenue Share (%), by Consumption Analysis 2025 & 2033
- Figure 58: Asia Pacific Taro Market Volume Share (%), by Consumption Analysis 2025 & 2033
- Figure 59: Asia Pacific Taro Market Revenue (Million), by Import Market Analysis (Value & Volume) 2025 & 2033
- Figure 60: Asia Pacific Taro Market Volume (Kiloton), by Import Market Analysis (Value & Volume) 2025 & 2033
- Figure 61: Asia Pacific Taro Market Revenue Share (%), by Import Market Analysis (Value & Volume) 2025 & 2033
- Figure 62: Asia Pacific Taro Market Volume Share (%), by Import Market Analysis (Value & Volume) 2025 & 2033
- Figure 63: Asia Pacific Taro Market Revenue (Million), by Export Market Analysis (Value & Volume) 2025 & 2033
- Figure 64: Asia Pacific Taro Market Volume (Kiloton), by Export Market Analysis (Value & Volume) 2025 & 2033
- Figure 65: Asia Pacific Taro Market Revenue Share (%), by Export Market Analysis (Value & Volume) 2025 & 2033
- Figure 66: Asia Pacific Taro Market Volume Share (%), by Export Market Analysis (Value & Volume) 2025 & 2033
- Figure 67: Asia Pacific Taro Market Revenue (Million), by Price Trend Analysis 2025 & 2033
- Figure 68: Asia Pacific Taro Market Volume (Kiloton), by Price Trend Analysis 2025 & 2033
- Figure 69: Asia Pacific Taro Market Revenue Share (%), by Price Trend Analysis 2025 & 2033
- Figure 70: Asia Pacific Taro Market Volume Share (%), by Price Trend Analysis 2025 & 2033
- Figure 71: Asia Pacific Taro Market Revenue (Million), by Country 2025 & 2033
- Figure 72: Asia Pacific Taro Market Volume (Kiloton), by Country 2025 & 2033
- Figure 73: Asia Pacific Taro Market Revenue Share (%), by Country 2025 & 2033
- Figure 74: Asia Pacific Taro Market Volume Share (%), by Country 2025 & 2033
- Figure 75: South America Taro Market Revenue (Million), by Production Analysis 2025 & 2033
- Figure 76: South America Taro Market Volume (Kiloton), by Production Analysis 2025 & 2033
- Figure 77: South America Taro Market Revenue Share (%), by Production Analysis 2025 & 2033
- Figure 78: South America Taro Market Volume Share (%), by Production Analysis 2025 & 2033
- Figure 79: South America Taro Market Revenue (Million), by Consumption Analysis 2025 & 2033
- Figure 80: South America Taro Market Volume (Kiloton), by Consumption Analysis 2025 & 2033
- Figure 81: South America Taro Market Revenue Share (%), by Consumption Analysis 2025 & 2033
- Figure 82: South America Taro Market Volume Share (%), by Consumption Analysis 2025 & 2033
- Figure 83: South America Taro Market Revenue (Million), by Import Market Analysis (Value & Volume) 2025 & 2033
- Figure 84: South America Taro Market Volume (Kiloton), by Import Market Analysis (Value & Volume) 2025 & 2033
- Figure 85: South America Taro Market Revenue Share (%), by Import Market Analysis (Value & Volume) 2025 & 2033
- Figure 86: South America Taro Market Volume Share (%), by Import Market Analysis (Value & Volume) 2025 & 2033
- Figure 87: South America Taro Market Revenue (Million), by Export Market Analysis (Value & Volume) 2025 & 2033
- Figure 88: South America Taro Market Volume (Kiloton), by Export Market Analysis (Value & Volume) 2025 & 2033
- Figure 89: South America Taro Market Revenue Share (%), by Export Market Analysis (Value & Volume) 2025 & 2033
- Figure 90: South America Taro Market Volume Share (%), by Export Market Analysis (Value & Volume) 2025 & 2033
- Figure 91: South America Taro Market Revenue (Million), by Price Trend Analysis 2025 & 2033
- Figure 92: South America Taro Market Volume (Kiloton), by Price Trend Analysis 2025 & 2033
- Figure 93: South America Taro Market Revenue Share (%), by Price Trend Analysis 2025 & 2033
- Figure 94: South America Taro Market Volume Share (%), by Price Trend Analysis 2025 & 2033
- Figure 95: South America Taro Market Revenue (Million), by Country 2025 & 2033
- Figure 96: South America Taro Market Volume (Kiloton), by Country 2025 & 2033
- Figure 97: South America Taro Market Revenue Share (%), by Country 2025 & 2033
- Figure 98: South America Taro Market Volume Share (%), by Country 2025 & 2033
- Figure 99: Middle East And Africa Taro Market Revenue (Million), by Production Analysis 2025 & 2033
- Figure 100: Middle East And Africa Taro Market Volume (Kiloton), by Production Analysis 2025 & 2033
- Figure 101: Middle East And Africa Taro Market Revenue Share (%), by Production Analysis 2025 & 2033
- Figure 102: Middle East And Africa Taro Market Volume Share (%), by Production Analysis 2025 & 2033
- Figure 103: Middle East And Africa Taro Market Revenue (Million), by Consumption Analysis 2025 & 2033
- Figure 104: Middle East And Africa Taro Market Volume (Kiloton), by Consumption Analysis 2025 & 2033
- Figure 105: Middle East And Africa Taro Market Revenue Share (%), by Consumption Analysis 2025 & 2033
- Figure 106: Middle East And Africa Taro Market Volume Share (%), by Consumption Analysis 2025 & 2033
- Figure 107: Middle East And Africa Taro Market Revenue (Million), by Import Market Analysis (Value & Volume) 2025 & 2033
- Figure 108: Middle East And Africa Taro Market Volume (Kiloton), by Import Market Analysis (Value & Volume) 2025 & 2033
- Figure 109: Middle East And Africa Taro Market Revenue Share (%), by Import Market Analysis (Value & Volume) 2025 & 2033
- Figure 110: Middle East And Africa Taro Market Volume Share (%), by Import Market Analysis (Value & Volume) 2025 & 2033
- Figure 111: Middle East And Africa Taro Market Revenue (Million), by Export Market Analysis (Value & Volume) 2025 & 2033
- Figure 112: Middle East And Africa Taro Market Volume (Kiloton), by Export Market Analysis (Value & Volume) 2025 & 2033
- Figure 113: Middle East And Africa Taro Market Revenue Share (%), by Export Market Analysis (Value & Volume) 2025 & 2033
- Figure 114: Middle East And Africa Taro Market Volume Share (%), by Export Market Analysis (Value & Volume) 2025 & 2033
- Figure 115: Middle East And Africa Taro Market Revenue (Million), by Price Trend Analysis 2025 & 2033
- Figure 116: Middle East And Africa Taro Market Volume (Kiloton), by Price Trend Analysis 2025 & 2033
- Figure 117: Middle East And Africa Taro Market Revenue Share (%), by Price Trend Analysis 2025 & 2033
- Figure 118: Middle East And Africa Taro Market Volume Share (%), by Price Trend Analysis 2025 & 2033
- Figure 119: Middle East And Africa Taro Market Revenue (Million), by Country 2025 & 2033
- Figure 120: Middle East And Africa Taro Market Volume (Kiloton), by Country 2025 & 2033
- Figure 121: Middle East And Africa Taro Market Revenue Share (%), by Country 2025 & 2033
- Figure 122: Middle East And Africa Taro Market Volume Share (%), by Country 2025 & 2033
List of Tables
- Table 1: Global Taro Market Revenue Million Forecast, by Production Analysis 2020 & 2033
- Table 2: Global Taro Market Volume Kiloton Forecast, by Production Analysis 2020 & 2033
- Table 3: Global Taro Market Revenue Million Forecast, by Consumption Analysis 2020 & 2033
- Table 4: Global Taro Market Volume Kiloton Forecast, by Consumption Analysis 2020 & 2033
- Table 5: Global Taro Market Revenue Million Forecast, by Import Market Analysis (Value & Volume) 2020 & 2033
- Table 6: Global Taro Market Volume Kiloton Forecast, by Import Market Analysis (Value & Volume) 2020 & 2033
- Table 7: Global Taro Market Revenue Million Forecast, by Export Market Analysis (Value & Volume) 2020 & 2033
- Table 8: Global Taro Market Volume Kiloton Forecast, by Export Market Analysis (Value & Volume) 2020 & 2033
- Table 9: Global Taro Market Revenue Million Forecast, by Price Trend Analysis 2020 & 2033
- Table 10: Global Taro Market Volume Kiloton Forecast, by Price Trend Analysis 2020 & 2033
- Table 11: Global Taro Market Revenue Million Forecast, by Region 2020 & 2033
- Table 12: Global Taro Market Volume Kiloton Forecast, by Region 2020 & 2033
- Table 13: Global Taro Market Revenue Million Forecast, by Production Analysis 2020 & 2033
- Table 14: Global Taro Market Volume Kiloton Forecast, by Production Analysis 2020 & 2033
- Table 15: Global Taro Market Revenue Million Forecast, by Consumption Analysis 2020 & 2033
- Table 16: Global Taro Market Volume Kiloton Forecast, by Consumption Analysis 2020 & 2033
- Table 17: Global Taro Market Revenue Million Forecast, by Import Market Analysis (Value & Volume) 2020 & 2033
- Table 18: Global Taro Market Volume Kiloton Forecast, by Import Market Analysis (Value & Volume) 2020 & 2033
- Table 19: Global Taro Market Revenue Million Forecast, by Export Market Analysis (Value & Volume) 2020 & 2033
- Table 20: Global Taro Market Volume Kiloton Forecast, by Export Market Analysis (Value & Volume) 2020 & 2033
- Table 21: Global Taro Market Revenue Million Forecast, by Price Trend Analysis 2020 & 2033
- Table 22: Global Taro Market Volume Kiloton Forecast, by Price Trend Analysis 2020 & 2033
- Table 23: Global Taro Market Revenue Million Forecast, by Country 2020 & 2033
- Table 24: Global Taro Market Volume Kiloton Forecast, by Country 2020 & 2033
- Table 25: United States Taro Market Revenue (Million) Forecast, by Application 2020 & 2033
- Table 26: United States Taro Market Volume (Kiloton) Forecast, by Application 2020 & 2033
- Table 27: Global Taro Market Revenue Million Forecast, by Production Analysis 2020 & 2033
- Table 28: Global Taro Market Volume Kiloton Forecast, by Production Analysis 2020 & 2033
- Table 29: Global Taro Market Revenue Million Forecast, by Consumption Analysis 2020 & 2033
- Table 30: Global Taro Market Volume Kiloton Forecast, by Consumption Analysis 2020 & 2033
- Table 31: Global Taro Market Revenue Million Forecast, by Import Market Analysis (Value & Volume) 2020 & 2033
- Table 32: Global Taro Market Volume Kiloton Forecast, by Import Market Analysis (Value & Volume) 2020 & 2033
- Table 33: Global Taro Market Revenue Million Forecast, by Export Market Analysis (Value & Volume) 2020 & 2033
- Table 34: Global Taro Market Volume Kiloton Forecast, by Export Market Analysis (Value & Volume) 2020 & 2033
- Table 35: Global Taro Market Revenue Million Forecast, by Price Trend Analysis 2020 & 2033
- Table 36: Global Taro Market Volume Kiloton Forecast, by Price Trend Analysis 2020 & 2033
- Table 37: Global Taro Market Revenue Million Forecast, by Country 2020 & 2033
- Table 38: Global Taro Market Volume Kiloton Forecast, by Country 2020 & 2033
- Table 39: France Taro Market Revenue (Million) Forecast, by Application 2020 & 2033
- Table 40: France Taro Market Volume (Kiloton) Forecast, by Application 2020 & 2033
- Table 41: Global Taro Market Revenue Million Forecast, by Production Analysis 2020 & 2033
- Table 42: Global Taro Market Volume Kiloton Forecast, by Production Analysis 2020 & 2033
- Table 43: Global Taro Market Revenue Million Forecast, by Consumption Analysis 2020 & 2033
- Table 44: Global Taro Market Volume Kiloton Forecast, by Consumption Analysis 2020 & 2033
- Table 45: Global Taro Market Revenue Million Forecast, by Import Market Analysis (Value & Volume) 2020 & 2033
- Table 46: Global Taro Market Volume Kiloton Forecast, by Import Market Analysis (Value & Volume) 2020 & 2033
- Table 47: Global Taro Market Revenue Million Forecast, by Export Market Analysis (Value & Volume) 2020 & 2033
- Table 48: Global Taro Market Volume Kiloton Forecast, by Export Market Analysis (Value & Volume) 2020 & 2033
- Table 49: Global Taro Market Revenue Million Forecast, by Price Trend Analysis 2020 & 2033
- Table 50: Global Taro Market Volume Kiloton Forecast, by Price Trend Analysis 2020 & 2033
- Table 51: Global Taro Market Revenue Million Forecast, by Country 2020 & 2033
- Table 52: Global Taro Market Volume Kiloton Forecast, by Country 2020 & 2033
- Table 53: China Taro Market Revenue (Million) Forecast, by Application 2020 & 2033
- Table 54: China Taro Market Volume (Kiloton) Forecast, by Application 2020 & 2033
- Table 55: Global Taro Market Revenue Million Forecast, by Production Analysis 2020 & 2033
- Table 56: Global Taro Market Volume Kiloton Forecast, by Production Analysis 2020 & 2033
- Table 57: Global Taro Market Revenue Million Forecast, by Consumption Analysis 2020 & 2033
- Table 58: Global Taro Market Volume Kiloton Forecast, by Consumption Analysis 2020 & 2033
- Table 59: Global Taro Market Revenue Million Forecast, by Import Market Analysis (Value & Volume) 2020 & 2033
- Table 60: Global Taro Market Volume Kiloton Forecast, by Import Market Analysis (Value & Volume) 2020 & 2033
- Table 61: Global Taro Market Revenue Million Forecast, by Export Market Analysis (Value & Volume) 2020 & 2033
- Table 62: Global Taro Market Volume Kiloton Forecast, by Export Market Analysis (Value & Volume) 2020 & 2033
- Table 63: Global Taro Market Revenue Million Forecast, by Price Trend Analysis 2020 & 2033
- Table 64: Global Taro Market Volume Kiloton Forecast, by Price Trend Analysis 2020 & 2033
- Table 65: Global Taro Market Revenue Million Forecast, by Country 2020 & 2033
- Table 66: Global Taro Market Volume Kiloton Forecast, by Country 2020 & 2033
- Table 67: Brazil Taro Market Revenue (Million) Forecast, by Application 2020 & 2033
- Table 68: Brazil Taro Market Volume (Kiloton) Forecast, by Application 2020 & 2033
- Table 69: Global Taro Market Revenue Million Forecast, by Production Analysis 2020 & 2033
- Table 70: Global Taro Market Volume Kiloton Forecast, by Production Analysis 2020 & 2033
- Table 71: Global Taro Market Revenue Million Forecast, by Consumption Analysis 2020 & 2033
- Table 72: Global Taro Market Volume Kiloton Forecast, by Consumption Analysis 2020 & 2033
- Table 73: Global Taro Market Revenue Million Forecast, by Import Market Analysis (Value & Volume) 2020 & 2033
- Table 74: Global Taro Market Volume Kiloton Forecast, by Import Market Analysis (Value & Volume) 2020 & 2033
- Table 75: Global Taro Market Revenue Million Forecast, by Export Market Analysis (Value & Volume) 2020 & 2033
- Table 76: Global Taro Market Volume Kiloton Forecast, by Export Market Analysis (Value & Volume) 2020 & 2033
- Table 77: Global Taro Market Revenue Million Forecast, by Price Trend Analysis 2020 & 2033
- Table 78: Global Taro Market Volume Kiloton Forecast, by Price Trend Analysis 2020 & 2033
- Table 79: Global Taro Market Revenue Million Forecast, by Country 2020 & 2033
- Table 80: Global Taro Market Volume Kiloton Forecast, by Country 2020 & 2033
- Table 81: Turkey Taro Market Revenue (Million) Forecast, by Application 2020 & 2033
- Table 82: Turkey Taro Market Volume (Kiloton) Forecast, by Application 2020 & 2033
Frequently Asked Questions
1. What is the projected Compound Annual Growth Rate (CAGR) of the Taro Market?
The projected CAGR is approximately 3.50%.
2. Which companies are prominent players in the Taro Market?
Key companies in the market include Golden Ocean Corp. , Thai Union Group, Nutrifoods International, BobaBam , Taro Technologies Inc..
3. What are the main segments of the Taro Market?
The market segments include Production Analysis, Consumption Analysis, Import Market Analysis (Value & Volume), Export Market Analysis (Value & Volume), Price Trend Analysis.
4. Can you provide details about the market size?
The market size is estimated to be USD XXX Million as of 2022.
5. What are some drivers contributing to market growth?
; Awareness About Health Benefits Associated With Pecan Consumption; Wide Application of Pecan.
6. What are the notable trends driving market growth?
Strong Growth in Taro Production.
7. Are there any restraints impacting market growth?
; Volatility in the Prices; Adverse Weather Conditions Affecting Yield.
8. Can you provide examples of recent developments in the market?
January 2023: BobaBam launched new Milk Tea and Taro, which features two of the Los Angeles-based company's newest flavors which are among the best-selling flavors at boba shops around 200 club locations across the Northeast and West Coast. The new variety pack contains 14 packs (7 each of Milk Tea and Taro) and includes eco-friendly packaging.
9. What pricing options are available for accessing the report?
Pricing options include single-user, multi-user, and enterprise licenses priced at USD 4750, USD 5250, and USD 8750 respectively.
10. Is the market size provided in terms of value or volume?
The market size is provided in terms of value, measured in Million and volume, measured in Kiloton.
11. Are there any specific market keywords associated with the report?
Yes, the market keyword associated with the report is "Taro Market," which aids in identifying and referencing the specific market segment covered.
12. How do I determine which pricing option suits my needs best?
The pricing options vary based on user requirements and access needs. Individual users may opt for single-user licenses, while businesses requiring broader access may choose multi-user or enterprise licenses for cost-effective access to the report.
13. Are there any additional resources or data provided in the Taro Market report?
While the report offers comprehensive insights, it's advisable to review the specific contents or supplementary materials provided to ascertain if additional resources or data are available.
14. How can I stay updated on further developments or reports in the Taro Market?
To stay informed about further developments, trends, and reports in the Taro Market, consider subscribing to industry newsletters, following relevant companies and organizations, or regularly checking reputable industry news sources and publications.
Methodology
Step 1 - Identification of Relevant Samples Size from Population Database


Step 2 - Approaches for Defining Global Market Size (Value, Volume* & Price*)

Note*: In applicable scenarios
Step 3 - Data Sources
Primary Research
- Web Analytics
- Survey Reports
- Research Institute
- Latest Research Reports
- Opinion Leaders
Secondary Research
- Annual Reports
- White Paper
- Latest Press Release
- Industry Association
- Paid Database
- Investor Presentations

Step 4 - Data Triangulation
Involves using different sources of information in order to increase the validity of a study
These sources are likely to be stakeholders in a program - participants, other researchers, program staff, other community members, and so on.
Then we put all data in single framework & apply various statistical tools to find out the dynamic on the market.
During the analysis stage, feedback from the stakeholder groups would be compared to determine areas of agreement as well as areas of divergence