

Key Insights
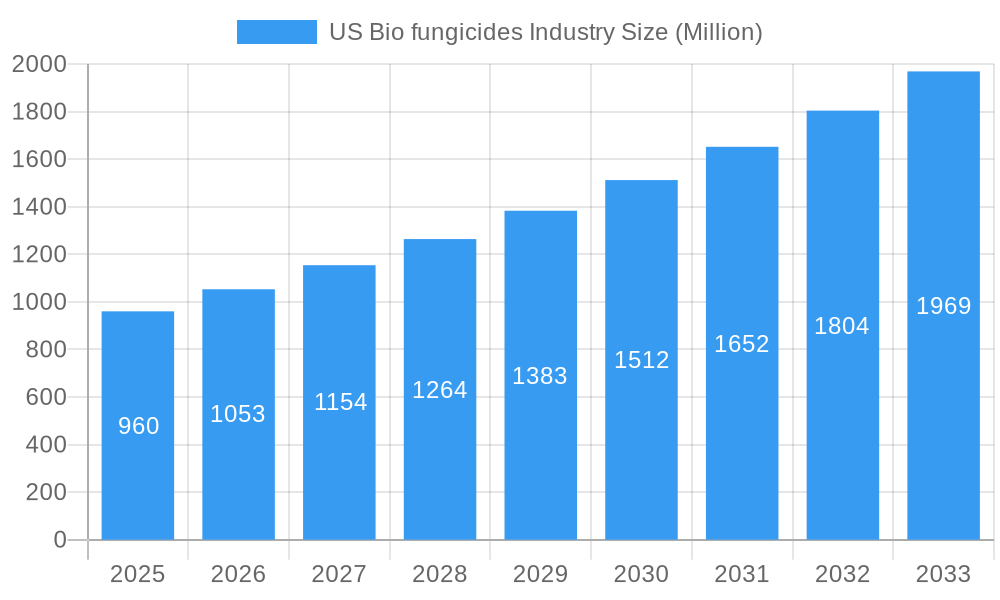
The US biofungicides market, valued at $0.96 billion in 2025, is poised for robust growth, exhibiting a Compound Annual Growth Rate (CAGR) of 9.5% from 2025 to 2033. This expansion is driven by several factors. Increasing awareness of the environmental impact of conventional fungicides is prompting a shift towards bio-based alternatives, particularly among growers concerned about soil health and residue limits. Furthermore, the rising prevalence of fungal diseases resistant to traditional chemical treatments necessitates innovative and effective biofungicide solutions. Growing consumer demand for organically produced food also fuels market growth, as biofungicides align with sustainable agriculture practices. The market is segmented by crop type, encompassing grains and cereals, oilseeds, commercial crops, fruits and vegetables, and turf and ornamentals, with each segment contributing differently to the overall market value. Significant regional variations exist, with the US Midwest, owing to its extensive agricultural land, likely holding a substantial market share, followed by the Southeast and West. Major players such as BioWorks Inc, Novozyme Biologicals, Isagro USA, Marrone Bio Innovations, Valent BioSciences LLC, Syngenta AG, De Sangosse Lt, and Certis USA LLC are driving innovation and competition within the market.
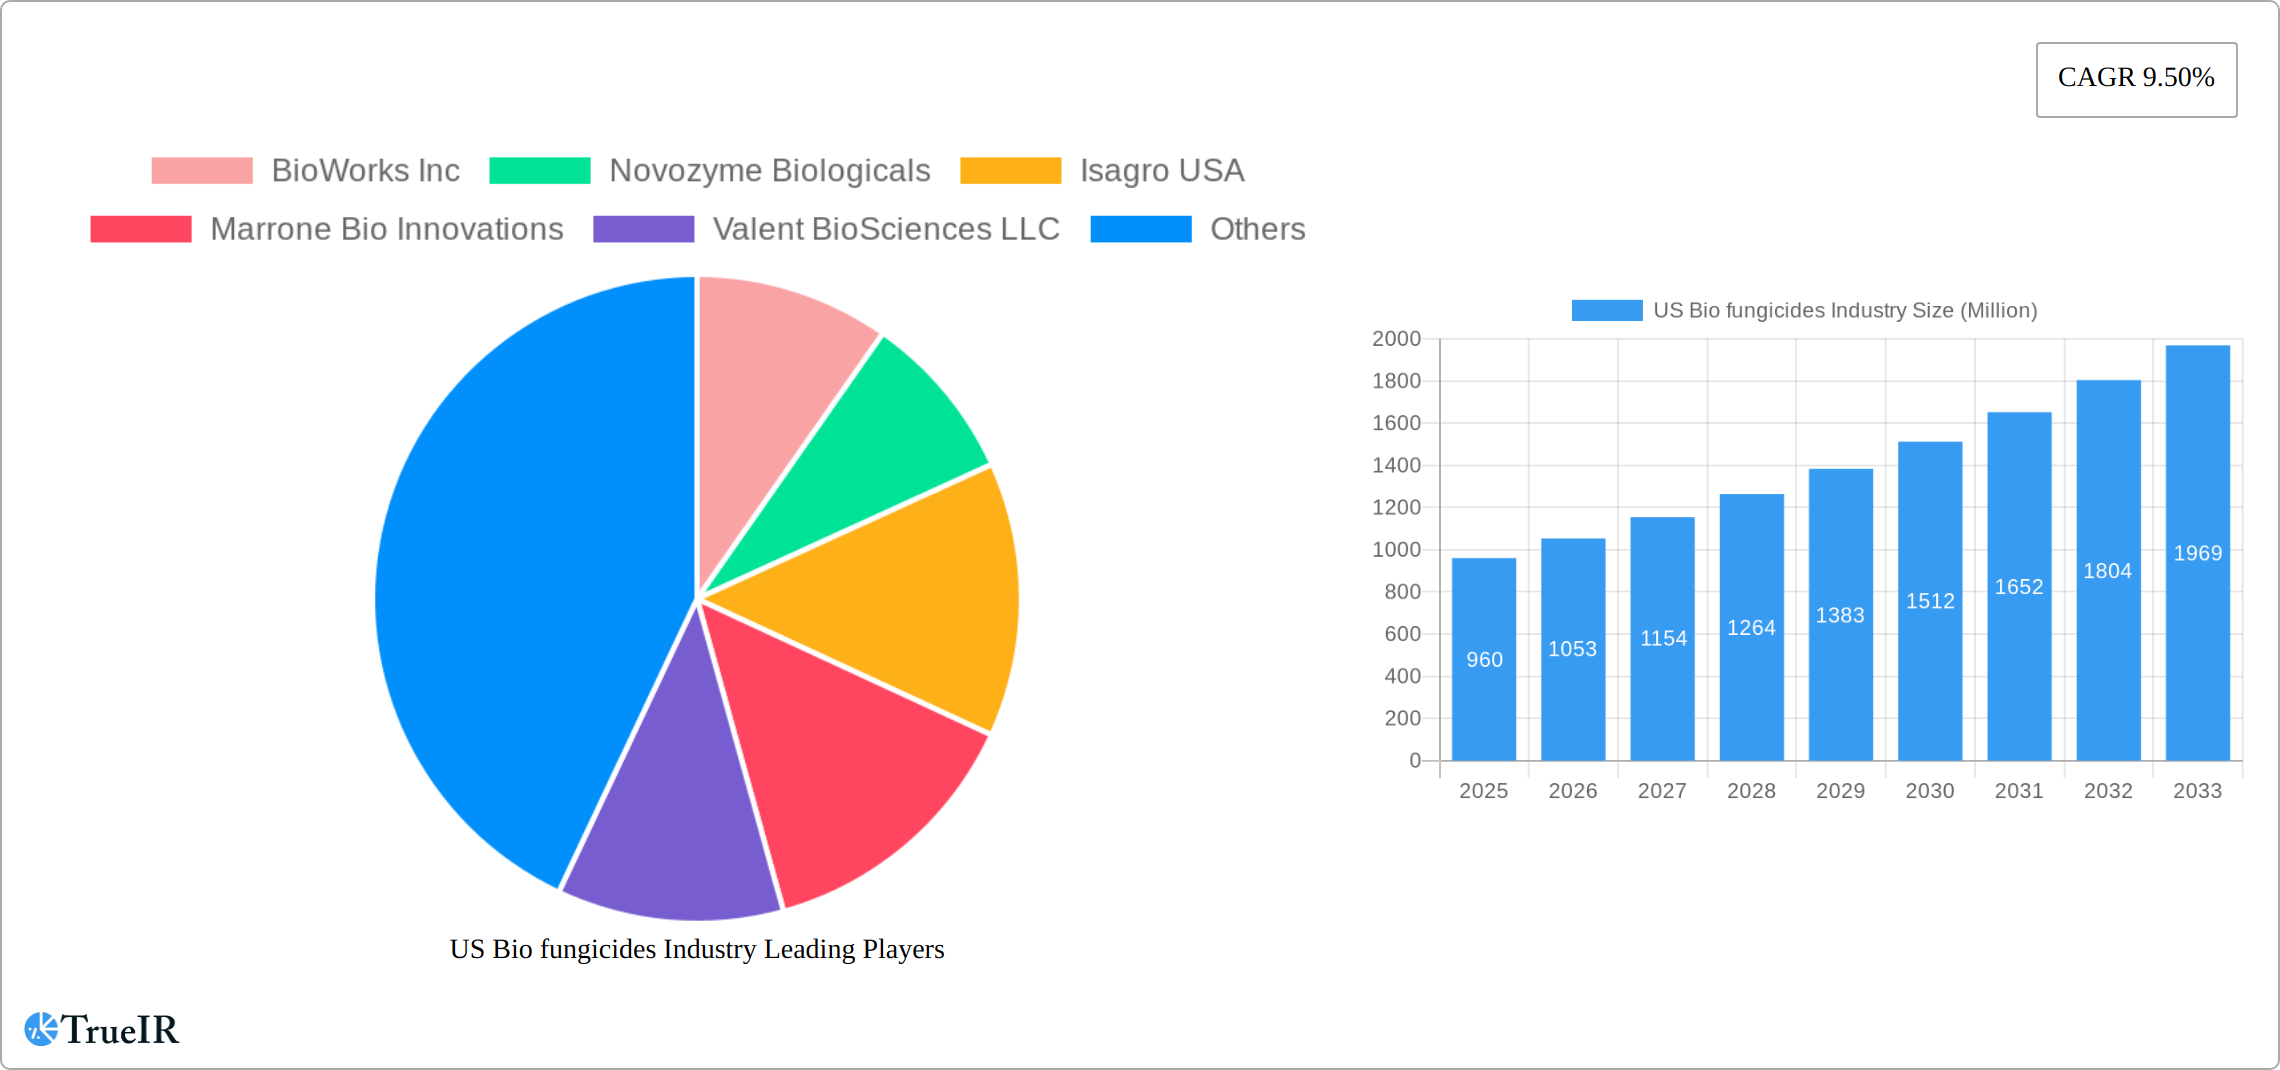
US Bio fungicides Industry Market Size (In Million)
Continued growth is projected throughout the forecast period (2025-2033), fueled by ongoing research and development leading to more efficacious and cost-effective biofungicides. Government regulations promoting sustainable agriculture and stricter limitations on chemical fungicide use further contribute to market expansion. However, factors like the relatively higher cost of biofungicides compared to their chemical counterparts and the sometimes lower efficacy in specific disease control scenarios could pose challenges. The market's trajectory suggests a significant increase in market size by 2033, with specific projections for each segment requiring further data analysis and market modeling but certainly in the billions of dollars range given the CAGR and current market size.
US Bio fungicides Industry Company Market Share
Dynamic US Biofungicides Industry Report: 2019-2033
This comprehensive report provides an in-depth analysis of the US biofungicides market, offering invaluable insights for industry stakeholders, investors, and researchers. Covering the period from 2019 to 2033, with a focus on 2025, this report unveils market trends, competitive dynamics, and future growth potential. The US biofungicides market is projected to reach xx Million by 2033, exhibiting a robust CAGR of xx% during the forecast period (2025-2033).
US Bio fungicides Industry Market Structure & Competitive Landscape
The US biofungicides market is characterized by a moderately concentrated structure, with a dynamic interplay between established players and emerging innovators. While a few key companies hold a significant market share, the landscape is increasingly shaped by a strong emphasis on research and development. The estimated Herfindahl-Hirschman Index (HHI) for 2024, at xx, signifies a competitive yet manageable environment. A primary driver for this market is the persistent demand for effective and environmentally responsible disease control solutions. Navigating the complex and stringent regulatory frameworks, especially concerning the registration and approval of novel biofungicides, profoundly influences market entry and product lifecycle. The broader category of biopesticides, encompassing biofungicides, is experiencing a notable surge in adoption. This is largely attributable to growing consumer preference for sustainably produced agricultural goods and heightened concerns about the potential health and environmental impacts of chemical residues. Although conventional chemical fungicides remain a significant competitor, biofungicides are steadily gaining ground due to their inherently lower environmental footprint and favorable safety profiles.
Mergers and acquisitions (M&A) activity within the sector has been observed to be moderate in recent years, with an estimated total deal value of xx Million in 2024. Key M&A trends reveal a strategic focus on forging alliances, facilitating technology licensing, and establishing distribution agreements. These collaborations are instrumental in expanding market reach, diversifying product portfolios, and accelerating the commercialization of innovative biofungicide technologies.
- Market Concentration: Moderately concentrated, with an estimated HHI of xx in 2024.
- Innovation Drivers: Primarily driven by the demand for sustainable and eco-friendly agricultural solutions and continuous advancements in microbial research and biotechnological applications.
- Regulatory Impacts: Stringent and evolving registration processes for new biofungicides, requiring robust efficacy and safety data.
- Product Substitutes: Competition from conventional chemical fungicides, alongside other biological control agents and integrated pest management (IPM) strategies.
- End-User Segmentation: Predominantly farmers across a wide array of crop types, including row crops, fruits, vegetables, and ornamentals.
- M&A Trends: Moderate activity, with a strategic emphasis on collaborations, technology licensing, and distribution partnerships to foster growth and market penetration.
US Bio fungicides Industry Market Trends & Opportunities
The US biofungicides market is on a robust growth trajectory, propelled by a growing global consciousness regarding the environmental implications of traditional chemical fungicides and an escalating demand for sustainable agricultural practices. The market size impressively expanded from xx Million in 2019 to xx Million in 2024, demonstrating a Compound Annual Growth Rate (CAGR) of xx%. This positive momentum is anticipated to persist throughout the forecast period, underpinned by several influential factors. Significant advancements in biofungicide formulation techniques and sophisticated delivery systems are continuously enhancing their efficacy, ease of application, and overall user-friendliness. The increasing consumer preference for organically produced fruits and vegetables is a substantial catalyst, directly fueling the demand for biofungicides within these high-value agricultural sectors. The intensifying competition among manufacturers is acting as a powerful engine for innovation, leading to the introduction of novel and improved product offerings. While market penetration rates for biofungicides are steadily rising in specific crop segments, particularly fruits and vegetables, they still represent a smaller share compared to the established chemical fungicides market. The market presents substantial opportunities for forward-thinking companies that can adeptly address the challenges associated with cost-effectiveness and scalability in biofungicide production. Furthermore, the development of specialized biofungicides tailored for specific diseases and the strategic expansion into emerging niche markets represent promising avenues for sustained growth and market leadership.
Dominant Markets & Segments in US Bio fungicides Industry
The US biofungicides market showcases strong growth across multiple segments, with fruits and vegetables and grains and cereals currently dominating.
- Fruits and Vegetables: This segment leads due to high consumer demand for organic produce and stringent regulations concerning chemical pesticide use. Growth is fueled by increasing consumer awareness of chemical residue impacts and rising disposable incomes.
- Key Growth Drivers: Growing demand for organic produce, stringent regulations on chemical fungicides, increasing awareness of the harmful effects of chemical residues.
- Grains and Cereals: This segment exhibits considerable growth due to the large acreage devoted to these crops and the increasing prevalence of fungal diseases.
- Key Growth Drivers: Large cultivated area, increasing incidence of fungal diseases, government support for sustainable agricultural practices.
- Oilseeds: This segment's growth rate is slightly lower than Fruits and Vegetables and Grains and Cereals, but still significant, driven by the demand for sustainable oilseed production and improved crop yields.
- Key Growth Drivers: Growing demand for sustainable oilseed production, increasing incidence of fungal diseases.
- Commercial Crops: Growth in this segment is moderate compared to other segments, driven by increasing awareness and adoption of biofungicides.
- Key Growth Drivers: Increasing demand for sustainable agricultural practices, government initiatives promoting biopesticide usage.
- Turf and Ornamentals: Growth in this segment is driven by the rising popularity of eco-friendly landscaping and gardening practices.
- Key Growth Drivers: Growing demand for eco-friendly landscaping and gardening, increasing awareness among consumers.
US Bio fungicides Industry Product Analysis
The biofungicides market is characterized by a diverse and evolving product portfolio, largely categorized by their active microbial strains, which include a variety of beneficial bacteria, fungi, and other microorganisms. These products exhibit distinct modes of action, targeting fungal pathogens through mechanisms such as competition, antagonism, induced resistance, or direct parasitic activity. Technological advancements are at the forefront of enhancing biofungicide performance, with a strong focus on developing novel formulations and advanced delivery systems. These innovations are crucial for improving product stability, shelf life, efficacy against target diseases, and ensuring better compatibility with existing agricultural machinery and integrated pest management (IPM) programs. The competitive standing of specific biofungicide products is determined by a confluence of factors, including their demonstrated efficacy against a broad spectrum of fungal diseases, the simplicity and efficiency of their application methods, their favorable environmental safety profile, and crucially, their cost-effectiveness in comparison to alternative solutions.
Key Drivers, Barriers & Challenges in US Bio fungicides Industry
Key Drivers:
The market is propelled by the growing awareness of the environmental and health risks associated with conventional chemical fungicides, stringent regulations aimed at reducing chemical pesticide use, increasing consumer preference for organically produced food, and the rising demand for sustainable agricultural practices. Furthermore, continuous research and development lead to the introduction of more effective and user-friendly biofungicide products.
Challenges & Restraints:
Challenges include relatively high production costs compared to chemical fungicides, lower efficacy compared to some chemical fungicides in specific situations, limited shelf life for certain products, and potential supply chain bottlenecks. Regulatory complexities for biopesticide registration and approval represent further hurdles. The competitive landscape, with established chemical fungicide manufacturers entering the biofungicides market, adds another layer of complexity. This results in a pressure on pricing and market share. The estimated impact of these challenges on market growth is xx% annually.
Growth Drivers in the US Bio fungicides Industry Market
The US biofungicides market is propelled by several key factors. These include a rising consumer preference for organic and sustainably grown produce, stringent government regulations favoring biopesticides, increasing awareness about the detrimental effects of chemical fungicides, and technological advancements resulting in improved efficacy and ease of application of biofungicides. Furthermore, supportive government policies and incentives play a vital role in accelerating the adoption of these environmentally friendly alternatives.
Challenges Impacting US Bio fungicides Industry Growth
The industry faces challenges such as the higher production costs of biofungicides compared to conventional chemical counterparts, which limits affordability for some farmers. The effectiveness of biofungicides can be inconsistent compared to their chemical counterparts, particularly in severe disease outbreaks. Supply chain complexities and storage requirements also pose considerable hurdles, potentially limiting market reach. Regulatory approval processes can be lengthy and expensive, delaying product launches and market entry.
Key Players Shaping the US Bio fungicides Industry Market
- BioWorks Inc
- Novozymes Biologicals
- Isagro USA
- Marrone Bio Innovations (Now part of Bioceres Crop Solutions)
- Valent BioSciences LLC
- Syngenta AG
- De Sangosse Lt
- Certis USA LLC
Significant US Bio fungicides Industry Industry Milestones
- 2020, Q4: BioWorks Inc. launched a new biofungicide formulation with improved efficacy.
- 2021, Q2: Syngenta AG acquired a smaller biofungicide company, expanding its product portfolio.
- 2022, Q3: New EPA regulations on chemical fungicides spurred increased demand for biofungicides.
- 2023, Q1: Marrone Bio Innovations secured significant funding for research and development of novel biofungicide technologies.
- 2024, Q2: Valent BioSciences LLC partnered with a university to enhance biofungicide research.
Future Outlook for US Bio fungicides Industry Market
The US biofungicides market is strongly positioned for sustained and significant growth in the coming years. This expansion will be primarily fueled by the escalating consumer demand for sustainably produced food and agricultural products, coupled with increasingly stringent governmental regulations that aim to curb the use of conventional chemical fungicides. Strategic partnerships and continued technological advancements will play a pivotal role in further enhancing product efficacy, broadening market penetration, and improving cost-competitiveness. The market offers substantial opportunities for agile and innovative companies that can develop and deliver cost-effective, highly efficacious biofungicide solutions that precisely meet the evolving needs of diverse crop segments. The development of novel applications, such as seed treatments and in-furrow applications, alongside tailored solutions for emerging fungal diseases, will be key drivers for future market expansion and will shape the competitive landscape.
US Bio fungicides Industry Segmentation
- 1. Production Analysis
- 2. Consumption Analysis
- 3. Import Market Analysis (Value & Volume)
- 4. Export Market Analysis (Value & Volume)
- 5. Price Trend Analysis
US Bio fungicides Industry Segmentation By Geography
-
1. North America
- 1.1. United States
- 1.2. Canada
- 1.3. Mexico
-
2. South America
- 2.1. Brazil
- 2.2. Argentina
- 2.3. Rest of South America
-
3. Europe
- 3.1. United Kingdom
- 3.2. Germany
- 3.3. France
- 3.4. Italy
- 3.5. Spain
- 3.6. Russia
- 3.7. Benelux
- 3.8. Nordics
- 3.9. Rest of Europe
-
4. Middle East & Africa
- 4.1. Turkey
- 4.2. Israel
- 4.3. GCC
- 4.4. North Africa
- 4.5. South Africa
- 4.6. Rest of Middle East & Africa
-
5. Asia Pacific
- 5.1. China
- 5.2. India
- 5.3. Japan
- 5.4. South Korea
- 5.5. ASEAN
- 5.6. Oceania
- 5.7. Rest of Asia Pacific
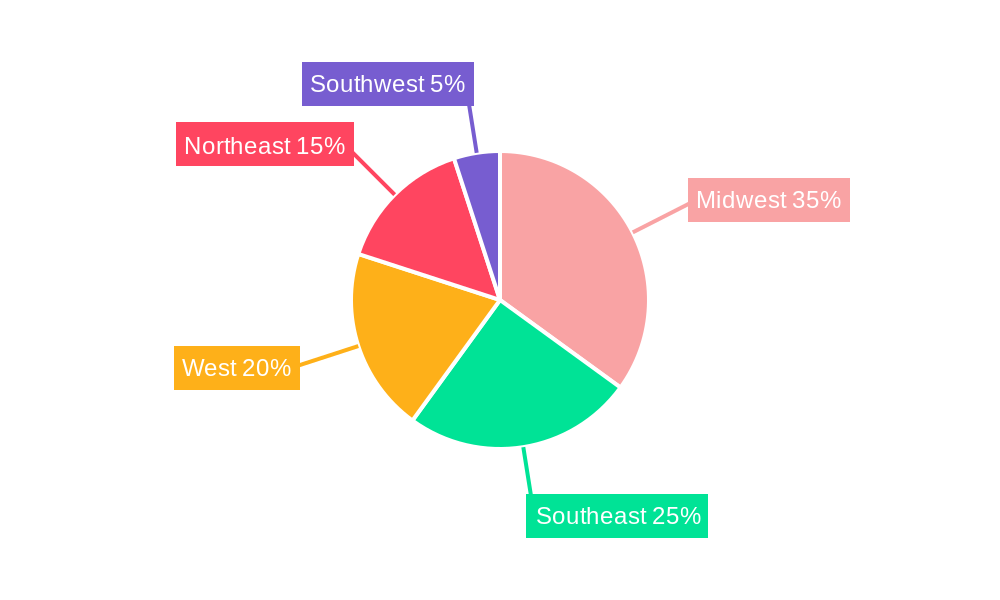
US Bio fungicides Industry Regional Market Share
Geographic Coverage of US Bio fungicides Industry
US Bio fungicides Industry REPORT HIGHLIGHTS
| Aspects | Details |
|---|---|
| Study Period | 2020-2034 |
| Base Year | 2025 |
| Estimated Year | 2026 |
| Forecast Period | 2026-2034 |
| Historical Period | 2020-2025 |
| Growth Rate | CAGR of 9.50% from 2020-2034 |
| Segmentation |
|
Table of Contents
- 1. Introduction
- 1.1. Research Scope
- 1.2. Market Segmentation
- 1.3. Research Methodology
- 1.4. Definitions and Assumptions
- 2. Executive Summary
- 2.1. Introduction
- 3. Market Dynamics
- 3.1. Introduction
- 3.2. Market Drivers
- 3.2.1. Adoption of Organic and Eco-friendly Farming Practices; Declining Area of Arable Land and Rising Food Security Concerns
- 3.3. Market Restrains
- 3.3.1. High Demand for Conventional and Synthetic Products; Lack of Awareness and Other Factors Limiting the Adoption of Agricultural Inoculants
- 3.4. Market Trends
- 3.4.1. Fruits and Vegetables Fastest Market Growing Segment
- 4. Market Factor Analysis
- 4.1. Porters Five Forces
- 4.2. Supply/Value Chain
- 4.3. PESTEL analysis
- 4.4. Market Entropy
- 4.5. Patent/Trademark Analysis
- 5. Global US Bio fungicides Industry Analysis, Insights and Forecast, 2020-2032
- 5.1. Market Analysis, Insights and Forecast - by Production Analysis
- 5.2. Market Analysis, Insights and Forecast - by Consumption Analysis
- 5.3. Market Analysis, Insights and Forecast - by Import Market Analysis (Value & Volume)
- 5.4. Market Analysis, Insights and Forecast - by Export Market Analysis (Value & Volume)
- 5.5. Market Analysis, Insights and Forecast - by Price Trend Analysis
- 5.6. Market Analysis, Insights and Forecast - by Region
- 5.6.1. North America
- 5.6.2. South America
- 5.6.3. Europe
- 5.6.4. Middle East & Africa
- 5.6.5. Asia Pacific
- 5.1. Market Analysis, Insights and Forecast - by Production Analysis
- 6. North America US Bio fungicides Industry Analysis, Insights and Forecast, 2020-2032
- 6.1. Market Analysis, Insights and Forecast - by Production Analysis
- 6.2. Market Analysis, Insights and Forecast - by Consumption Analysis
- 6.3. Market Analysis, Insights and Forecast - by Import Market Analysis (Value & Volume)
- 6.4. Market Analysis, Insights and Forecast - by Export Market Analysis (Value & Volume)
- 6.5. Market Analysis, Insights and Forecast - by Price Trend Analysis
- 6.1. Market Analysis, Insights and Forecast - by Production Analysis
- 7. South America US Bio fungicides Industry Analysis, Insights and Forecast, 2020-2032
- 7.1. Market Analysis, Insights and Forecast - by Production Analysis
- 7.2. Market Analysis, Insights and Forecast - by Consumption Analysis
- 7.3. Market Analysis, Insights and Forecast - by Import Market Analysis (Value & Volume)
- 7.4. Market Analysis, Insights and Forecast - by Export Market Analysis (Value & Volume)
- 7.5. Market Analysis, Insights and Forecast - by Price Trend Analysis
- 7.1. Market Analysis, Insights and Forecast - by Production Analysis
- 8. Europe US Bio fungicides Industry Analysis, Insights and Forecast, 2020-2032
- 8.1. Market Analysis, Insights and Forecast - by Production Analysis
- 8.2. Market Analysis, Insights and Forecast - by Consumption Analysis
- 8.3. Market Analysis, Insights and Forecast - by Import Market Analysis (Value & Volume)
- 8.4. Market Analysis, Insights and Forecast - by Export Market Analysis (Value & Volume)
- 8.5. Market Analysis, Insights and Forecast - by Price Trend Analysis
- 8.1. Market Analysis, Insights and Forecast - by Production Analysis
- 9. Middle East & Africa US Bio fungicides Industry Analysis, Insights and Forecast, 2020-2032
- 9.1. Market Analysis, Insights and Forecast - by Production Analysis
- 9.2. Market Analysis, Insights and Forecast - by Consumption Analysis
- 9.3. Market Analysis, Insights and Forecast - by Import Market Analysis (Value & Volume)
- 9.4. Market Analysis, Insights and Forecast - by Export Market Analysis (Value & Volume)
- 9.5. Market Analysis, Insights and Forecast - by Price Trend Analysis
- 9.1. Market Analysis, Insights and Forecast - by Production Analysis
- 10. Asia Pacific US Bio fungicides Industry Analysis, Insights and Forecast, 2020-2032
- 10.1. Market Analysis, Insights and Forecast - by Production Analysis
- 10.2. Market Analysis, Insights and Forecast - by Consumption Analysis
- 10.3. Market Analysis, Insights and Forecast - by Import Market Analysis (Value & Volume)
- 10.4. Market Analysis, Insights and Forecast - by Export Market Analysis (Value & Volume)
- 10.5. Market Analysis, Insights and Forecast - by Price Trend Analysis
- 10.1. Market Analysis, Insights and Forecast - by Production Analysis
- 11. Competitive Analysis
- 11.1. Global Market Share Analysis 2025
- 11.2. Company Profiles
- 11.2.1 BioWorks Inc
- 11.2.1.1. Overview
- 11.2.1.2. Products
- 11.2.1.3. SWOT Analysis
- 11.2.1.4. Recent Developments
- 11.2.1.5. Financials (Based on Availability)
- 11.2.2 Novozyme Biologicals
- 11.2.2.1. Overview
- 11.2.2.2. Products
- 11.2.2.3. SWOT Analysis
- 11.2.2.4. Recent Developments
- 11.2.2.5. Financials (Based on Availability)
- 11.2.3 Isagro USA
- 11.2.3.1. Overview
- 11.2.3.2. Products
- 11.2.3.3. SWOT Analysis
- 11.2.3.4. Recent Developments
- 11.2.3.5. Financials (Based on Availability)
- 11.2.4 Marrone Bio Innovations
- 11.2.4.1. Overview
- 11.2.4.2. Products
- 11.2.4.3. SWOT Analysis
- 11.2.4.4. Recent Developments
- 11.2.4.5. Financials (Based on Availability)
- 11.2.5 Valent BioSciences LLC
- 11.2.5.1. Overview
- 11.2.5.2. Products
- 11.2.5.3. SWOT Analysis
- 11.2.5.4. Recent Developments
- 11.2.5.5. Financials (Based on Availability)
- 11.2.6 Syngenta AG
- 11.2.6.1. Overview
- 11.2.6.2. Products
- 11.2.6.3. SWOT Analysis
- 11.2.6.4. Recent Developments
- 11.2.6.5. Financials (Based on Availability)
- 11.2.7 De Sangosse Lt
- 11.2.7.1. Overview
- 11.2.7.2. Products
- 11.2.7.3. SWOT Analysis
- 11.2.7.4. Recent Developments
- 11.2.7.5. Financials (Based on Availability)
- 11.2.8 Certis USA LLC
- 11.2.8.1. Overview
- 11.2.8.2. Products
- 11.2.8.3. SWOT Analysis
- 11.2.8.4. Recent Developments
- 11.2.8.5. Financials (Based on Availability)
- 11.2.1 BioWorks Inc
List of Figures
- Figure 1: Global US Bio fungicides Industry Revenue Breakdown (Million, %) by Region 2025 & 2033
- Figure 2: North America US Bio fungicides Industry Revenue (Million), by Production Analysis 2025 & 2033
- Figure 3: North America US Bio fungicides Industry Revenue Share (%), by Production Analysis 2025 & 2033
- Figure 4: North America US Bio fungicides Industry Revenue (Million), by Consumption Analysis 2025 & 2033
- Figure 5: North America US Bio fungicides Industry Revenue Share (%), by Consumption Analysis 2025 & 2033
- Figure 6: North America US Bio fungicides Industry Revenue (Million), by Import Market Analysis (Value & Volume) 2025 & 2033
- Figure 7: North America US Bio fungicides Industry Revenue Share (%), by Import Market Analysis (Value & Volume) 2025 & 2033
- Figure 8: North America US Bio fungicides Industry Revenue (Million), by Export Market Analysis (Value & Volume) 2025 & 2033
- Figure 9: North America US Bio fungicides Industry Revenue Share (%), by Export Market Analysis (Value & Volume) 2025 & 2033
- Figure 10: North America US Bio fungicides Industry Revenue (Million), by Price Trend Analysis 2025 & 2033
- Figure 11: North America US Bio fungicides Industry Revenue Share (%), by Price Trend Analysis 2025 & 2033
- Figure 12: North America US Bio fungicides Industry Revenue (Million), by Country 2025 & 2033
- Figure 13: North America US Bio fungicides Industry Revenue Share (%), by Country 2025 & 2033
- Figure 14: South America US Bio fungicides Industry Revenue (Million), by Production Analysis 2025 & 2033
- Figure 15: South America US Bio fungicides Industry Revenue Share (%), by Production Analysis 2025 & 2033
- Figure 16: South America US Bio fungicides Industry Revenue (Million), by Consumption Analysis 2025 & 2033
- Figure 17: South America US Bio fungicides Industry Revenue Share (%), by Consumption Analysis 2025 & 2033
- Figure 18: South America US Bio fungicides Industry Revenue (Million), by Import Market Analysis (Value & Volume) 2025 & 2033
- Figure 19: South America US Bio fungicides Industry Revenue Share (%), by Import Market Analysis (Value & Volume) 2025 & 2033
- Figure 20: South America US Bio fungicides Industry Revenue (Million), by Export Market Analysis (Value & Volume) 2025 & 2033
- Figure 21: South America US Bio fungicides Industry Revenue Share (%), by Export Market Analysis (Value & Volume) 2025 & 2033
- Figure 22: South America US Bio fungicides Industry Revenue (Million), by Price Trend Analysis 2025 & 2033
- Figure 23: South America US Bio fungicides Industry Revenue Share (%), by Price Trend Analysis 2025 & 2033
- Figure 24: South America US Bio fungicides Industry Revenue (Million), by Country 2025 & 2033
- Figure 25: South America US Bio fungicides Industry Revenue Share (%), by Country 2025 & 2033
- Figure 26: Europe US Bio fungicides Industry Revenue (Million), by Production Analysis 2025 & 2033
- Figure 27: Europe US Bio fungicides Industry Revenue Share (%), by Production Analysis 2025 & 2033
- Figure 28: Europe US Bio fungicides Industry Revenue (Million), by Consumption Analysis 2025 & 2033
- Figure 29: Europe US Bio fungicides Industry Revenue Share (%), by Consumption Analysis 2025 & 2033
- Figure 30: Europe US Bio fungicides Industry Revenue (Million), by Import Market Analysis (Value & Volume) 2025 & 2033
- Figure 31: Europe US Bio fungicides Industry Revenue Share (%), by Import Market Analysis (Value & Volume) 2025 & 2033
- Figure 32: Europe US Bio fungicides Industry Revenue (Million), by Export Market Analysis (Value & Volume) 2025 & 2033
- Figure 33: Europe US Bio fungicides Industry Revenue Share (%), by Export Market Analysis (Value & Volume) 2025 & 2033
- Figure 34: Europe US Bio fungicides Industry Revenue (Million), by Price Trend Analysis 2025 & 2033
- Figure 35: Europe US Bio fungicides Industry Revenue Share (%), by Price Trend Analysis 2025 & 2033
- Figure 36: Europe US Bio fungicides Industry Revenue (Million), by Country 2025 & 2033
- Figure 37: Europe US Bio fungicides Industry Revenue Share (%), by Country 2025 & 2033
- Figure 38: Middle East & Africa US Bio fungicides Industry Revenue (Million), by Production Analysis 2025 & 2033
- Figure 39: Middle East & Africa US Bio fungicides Industry Revenue Share (%), by Production Analysis 2025 & 2033
- Figure 40: Middle East & Africa US Bio fungicides Industry Revenue (Million), by Consumption Analysis 2025 & 2033
- Figure 41: Middle East & Africa US Bio fungicides Industry Revenue Share (%), by Consumption Analysis 2025 & 2033
- Figure 42: Middle East & Africa US Bio fungicides Industry Revenue (Million), by Import Market Analysis (Value & Volume) 2025 & 2033
- Figure 43: Middle East & Africa US Bio fungicides Industry Revenue Share (%), by Import Market Analysis (Value & Volume) 2025 & 2033
- Figure 44: Middle East & Africa US Bio fungicides Industry Revenue (Million), by Export Market Analysis (Value & Volume) 2025 & 2033
- Figure 45: Middle East & Africa US Bio fungicides Industry Revenue Share (%), by Export Market Analysis (Value & Volume) 2025 & 2033
- Figure 46: Middle East & Africa US Bio fungicides Industry Revenue (Million), by Price Trend Analysis 2025 & 2033
- Figure 47: Middle East & Africa US Bio fungicides Industry Revenue Share (%), by Price Trend Analysis 2025 & 2033
- Figure 48: Middle East & Africa US Bio fungicides Industry Revenue (Million), by Country 2025 & 2033
- Figure 49: Middle East & Africa US Bio fungicides Industry Revenue Share (%), by Country 2025 & 2033
- Figure 50: Asia Pacific US Bio fungicides Industry Revenue (Million), by Production Analysis 2025 & 2033
- Figure 51: Asia Pacific US Bio fungicides Industry Revenue Share (%), by Production Analysis 2025 & 2033
- Figure 52: Asia Pacific US Bio fungicides Industry Revenue (Million), by Consumption Analysis 2025 & 2033
- Figure 53: Asia Pacific US Bio fungicides Industry Revenue Share (%), by Consumption Analysis 2025 & 2033
- Figure 54: Asia Pacific US Bio fungicides Industry Revenue (Million), by Import Market Analysis (Value & Volume) 2025 & 2033
- Figure 55: Asia Pacific US Bio fungicides Industry Revenue Share (%), by Import Market Analysis (Value & Volume) 2025 & 2033
- Figure 56: Asia Pacific US Bio fungicides Industry Revenue (Million), by Export Market Analysis (Value & Volume) 2025 & 2033
- Figure 57: Asia Pacific US Bio fungicides Industry Revenue Share (%), by Export Market Analysis (Value & Volume) 2025 & 2033
- Figure 58: Asia Pacific US Bio fungicides Industry Revenue (Million), by Price Trend Analysis 2025 & 2033
- Figure 59: Asia Pacific US Bio fungicides Industry Revenue Share (%), by Price Trend Analysis 2025 & 2033
- Figure 60: Asia Pacific US Bio fungicides Industry Revenue (Million), by Country 2025 & 2033
- Figure 61: Asia Pacific US Bio fungicides Industry Revenue Share (%), by Country 2025 & 2033
List of Tables
- Table 1: Global US Bio fungicides Industry Revenue Million Forecast, by Production Analysis 2020 & 2033
- Table 2: Global US Bio fungicides Industry Revenue Million Forecast, by Consumption Analysis 2020 & 2033
- Table 3: Global US Bio fungicides Industry Revenue Million Forecast, by Import Market Analysis (Value & Volume) 2020 & 2033
- Table 4: Global US Bio fungicides Industry Revenue Million Forecast, by Export Market Analysis (Value & Volume) 2020 & 2033
- Table 5: Global US Bio fungicides Industry Revenue Million Forecast, by Price Trend Analysis 2020 & 2033
- Table 6: Global US Bio fungicides Industry Revenue Million Forecast, by Region 2020 & 2033
- Table 7: Global US Bio fungicides Industry Revenue Million Forecast, by Production Analysis 2020 & 2033
- Table 8: Global US Bio fungicides Industry Revenue Million Forecast, by Consumption Analysis 2020 & 2033
- Table 9: Global US Bio fungicides Industry Revenue Million Forecast, by Import Market Analysis (Value & Volume) 2020 & 2033
- Table 10: Global US Bio fungicides Industry Revenue Million Forecast, by Export Market Analysis (Value & Volume) 2020 & 2033
- Table 11: Global US Bio fungicides Industry Revenue Million Forecast, by Price Trend Analysis 2020 & 2033
- Table 12: Global US Bio fungicides Industry Revenue Million Forecast, by Country 2020 & 2033
- Table 13: United States US Bio fungicides Industry Revenue (Million) Forecast, by Application 2020 & 2033
- Table 14: Canada US Bio fungicides Industry Revenue (Million) Forecast, by Application 2020 & 2033
- Table 15: Mexico US Bio fungicides Industry Revenue (Million) Forecast, by Application 2020 & 2033
- Table 16: Global US Bio fungicides Industry Revenue Million Forecast, by Production Analysis 2020 & 2033
- Table 17: Global US Bio fungicides Industry Revenue Million Forecast, by Consumption Analysis 2020 & 2033
- Table 18: Global US Bio fungicides Industry Revenue Million Forecast, by Import Market Analysis (Value & Volume) 2020 & 2033
- Table 19: Global US Bio fungicides Industry Revenue Million Forecast, by Export Market Analysis (Value & Volume) 2020 & 2033
- Table 20: Global US Bio fungicides Industry Revenue Million Forecast, by Price Trend Analysis 2020 & 2033
- Table 21: Global US Bio fungicides Industry Revenue Million Forecast, by Country 2020 & 2033
- Table 22: Brazil US Bio fungicides Industry Revenue (Million) Forecast, by Application 2020 & 2033
- Table 23: Argentina US Bio fungicides Industry Revenue (Million) Forecast, by Application 2020 & 2033
- Table 24: Rest of South America US Bio fungicides Industry Revenue (Million) Forecast, by Application 2020 & 2033
- Table 25: Global US Bio fungicides Industry Revenue Million Forecast, by Production Analysis 2020 & 2033
- Table 26: Global US Bio fungicides Industry Revenue Million Forecast, by Consumption Analysis 2020 & 2033
- Table 27: Global US Bio fungicides Industry Revenue Million Forecast, by Import Market Analysis (Value & Volume) 2020 & 2033
- Table 28: Global US Bio fungicides Industry Revenue Million Forecast, by Export Market Analysis (Value & Volume) 2020 & 2033
- Table 29: Global US Bio fungicides Industry Revenue Million Forecast, by Price Trend Analysis 2020 & 2033
- Table 30: Global US Bio fungicides Industry Revenue Million Forecast, by Country 2020 & 2033
- Table 31: United Kingdom US Bio fungicides Industry Revenue (Million) Forecast, by Application 2020 & 2033
- Table 32: Germany US Bio fungicides Industry Revenue (Million) Forecast, by Application 2020 & 2033
- Table 33: France US Bio fungicides Industry Revenue (Million) Forecast, by Application 2020 & 2033
- Table 34: Italy US Bio fungicides Industry Revenue (Million) Forecast, by Application 2020 & 2033
- Table 35: Spain US Bio fungicides Industry Revenue (Million) Forecast, by Application 2020 & 2033
- Table 36: Russia US Bio fungicides Industry Revenue (Million) Forecast, by Application 2020 & 2033
- Table 37: Benelux US Bio fungicides Industry Revenue (Million) Forecast, by Application 2020 & 2033
- Table 38: Nordics US Bio fungicides Industry Revenue (Million) Forecast, by Application 2020 & 2033
- Table 39: Rest of Europe US Bio fungicides Industry Revenue (Million) Forecast, by Application 2020 & 2033
- Table 40: Global US Bio fungicides Industry Revenue Million Forecast, by Production Analysis 2020 & 2033
- Table 41: Global US Bio fungicides Industry Revenue Million Forecast, by Consumption Analysis 2020 & 2033
- Table 42: Global US Bio fungicides Industry Revenue Million Forecast, by Import Market Analysis (Value & Volume) 2020 & 2033
- Table 43: Global US Bio fungicides Industry Revenue Million Forecast, by Export Market Analysis (Value & Volume) 2020 & 2033
- Table 44: Global US Bio fungicides Industry Revenue Million Forecast, by Price Trend Analysis 2020 & 2033
- Table 45: Global US Bio fungicides Industry Revenue Million Forecast, by Country 2020 & 2033
- Table 46: Turkey US Bio fungicides Industry Revenue (Million) Forecast, by Application 2020 & 2033
- Table 47: Israel US Bio fungicides Industry Revenue (Million) Forecast, by Application 2020 & 2033
- Table 48: GCC US Bio fungicides Industry Revenue (Million) Forecast, by Application 2020 & 2033
- Table 49: North Africa US Bio fungicides Industry Revenue (Million) Forecast, by Application 2020 & 2033
- Table 50: South Africa US Bio fungicides Industry Revenue (Million) Forecast, by Application 2020 & 2033
- Table 51: Rest of Middle East & Africa US Bio fungicides Industry Revenue (Million) Forecast, by Application 2020 & 2033
- Table 52: Global US Bio fungicides Industry Revenue Million Forecast, by Production Analysis 2020 & 2033
- Table 53: Global US Bio fungicides Industry Revenue Million Forecast, by Consumption Analysis 2020 & 2033
- Table 54: Global US Bio fungicides Industry Revenue Million Forecast, by Import Market Analysis (Value & Volume) 2020 & 2033
- Table 55: Global US Bio fungicides Industry Revenue Million Forecast, by Export Market Analysis (Value & Volume) 2020 & 2033
- Table 56: Global US Bio fungicides Industry Revenue Million Forecast, by Price Trend Analysis 2020 & 2033
- Table 57: Global US Bio fungicides Industry Revenue Million Forecast, by Country 2020 & 2033
- Table 58: China US Bio fungicides Industry Revenue (Million) Forecast, by Application 2020 & 2033
- Table 59: India US Bio fungicides Industry Revenue (Million) Forecast, by Application 2020 & 2033
- Table 60: Japan US Bio fungicides Industry Revenue (Million) Forecast, by Application 2020 & 2033
- Table 61: South Korea US Bio fungicides Industry Revenue (Million) Forecast, by Application 2020 & 2033
- Table 62: ASEAN US Bio fungicides Industry Revenue (Million) Forecast, by Application 2020 & 2033
- Table 63: Oceania US Bio fungicides Industry Revenue (Million) Forecast, by Application 2020 & 2033
- Table 64: Rest of Asia Pacific US Bio fungicides Industry Revenue (Million) Forecast, by Application 2020 & 2033
Frequently Asked Questions
1. What is the projected Compound Annual Growth Rate (CAGR) of the US Bio fungicides Industry?
The projected CAGR is approximately 9.50%.
2. Which companies are prominent players in the US Bio fungicides Industry?
Key companies in the market include BioWorks Inc, Novozyme Biologicals, Isagro USA, Marrone Bio Innovations, Valent BioSciences LLC, Syngenta AG, De Sangosse Lt, Certis USA LLC.
3. What are the main segments of the US Bio fungicides Industry?
The market segments include Production Analysis, Consumption Analysis, Import Market Analysis (Value & Volume), Export Market Analysis (Value & Volume), Price Trend Analysis.
4. Can you provide details about the market size?
The market size is estimated to be USD 0.96 Million as of 2022.
5. What are some drivers contributing to market growth?
Adoption of Organic and Eco-friendly Farming Practices; Declining Area of Arable Land and Rising Food Security Concerns.
6. What are the notable trends driving market growth?
Fruits and Vegetables Fastest Market Growing Segment.
7. Are there any restraints impacting market growth?
High Demand for Conventional and Synthetic Products; Lack of Awareness and Other Factors Limiting the Adoption of Agricultural Inoculants.
8. Can you provide examples of recent developments in the market?
N/A
9. What pricing options are available for accessing the report?
Pricing options include single-user, multi-user, and enterprise licenses priced at USD 3800, USD 4500, and USD 5800 respectively.
10. Is the market size provided in terms of value or volume?
The market size is provided in terms of value, measured in Million.
11. Are there any specific market keywords associated with the report?
Yes, the market keyword associated with the report is "US Bio fungicides Industry," which aids in identifying and referencing the specific market segment covered.
12. How do I determine which pricing option suits my needs best?
The pricing options vary based on user requirements and access needs. Individual users may opt for single-user licenses, while businesses requiring broader access may choose multi-user or enterprise licenses for cost-effective access to the report.
13. Are there any additional resources or data provided in the US Bio fungicides Industry report?
While the report offers comprehensive insights, it's advisable to review the specific contents or supplementary materials provided to ascertain if additional resources or data are available.
14. How can I stay updated on further developments or reports in the US Bio fungicides Industry?
To stay informed about further developments, trends, and reports in the US Bio fungicides Industry, consider subscribing to industry newsletters, following relevant companies and organizations, or regularly checking reputable industry news sources and publications.
Methodology
Step 1 - Identification of Relevant Samples Size from Population Database


Step 2 - Approaches for Defining Global Market Size (Value, Volume* & Price*)

Note*: In applicable scenarios
Step 3 - Data Sources
Primary Research
- Web Analytics
- Survey Reports
- Research Institute
- Latest Research Reports
- Opinion Leaders
Secondary Research
- Annual Reports
- White Paper
- Latest Press Release
- Industry Association
- Paid Database
- Investor Presentations

Step 4 - Data Triangulation
Involves using different sources of information in order to increase the validity of a study
These sources are likely to be stakeholders in a program - participants, other researchers, program staff, other community members, and so on.
Then we put all data in single framework & apply various statistical tools to find out the dynamic on the market.
During the analysis stage, feedback from the stakeholder groups would be compared to determine areas of agreement as well as areas of divergence