

Key Insights
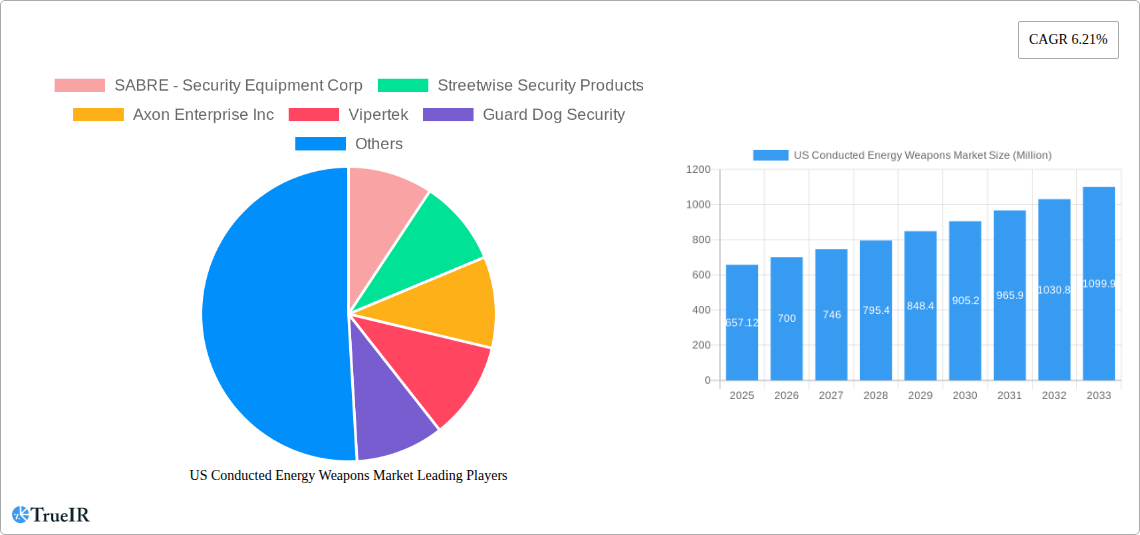
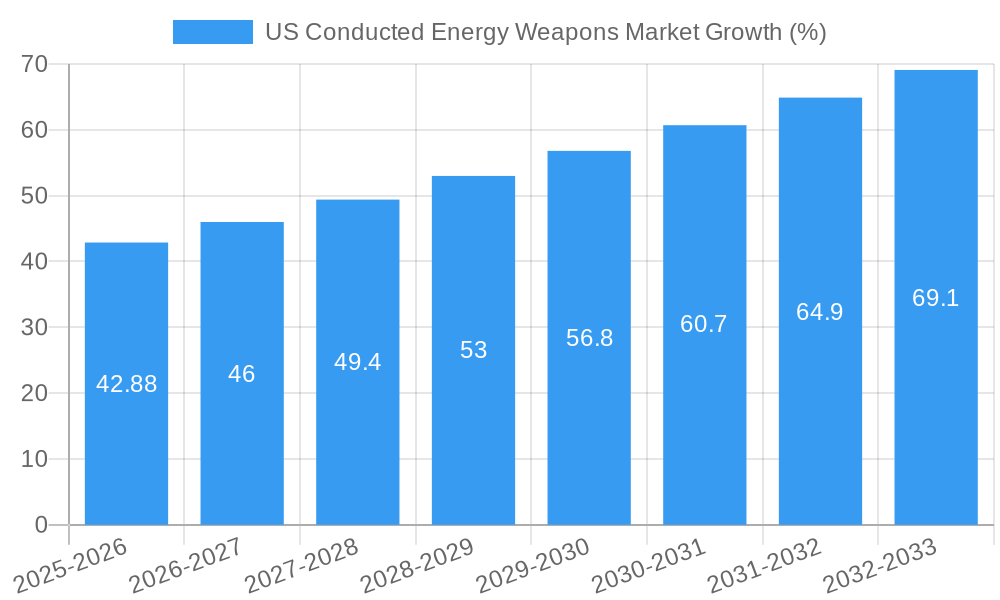
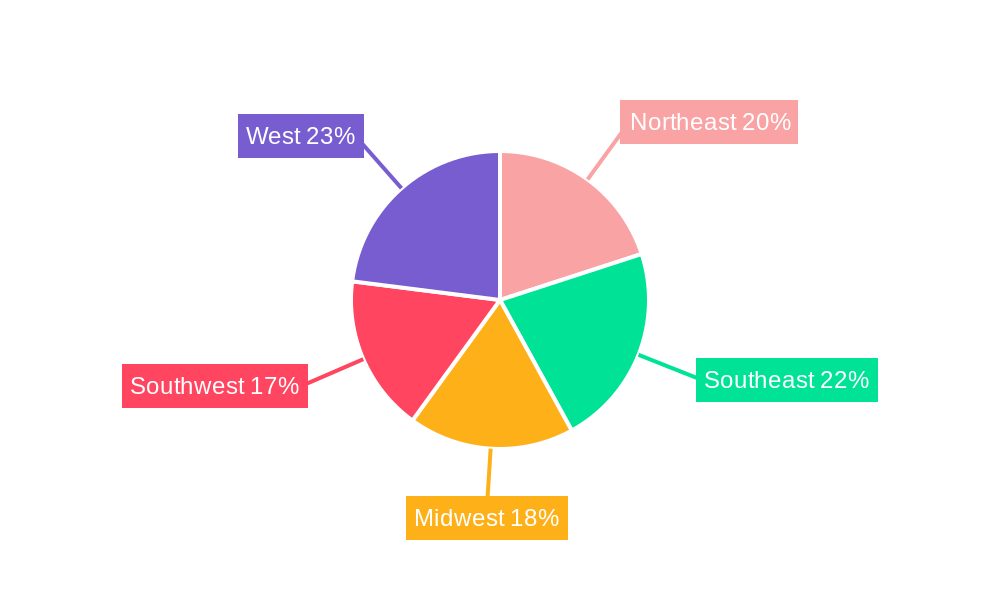
The US Conducted Energy Weapons (CEW) market, valued at $657.12 million in 2025, is projected to experience robust growth, driven by increasing demand from law enforcement agencies and a rising awareness of personal safety among civilians. The market's Compound Annual Growth Rate (CAGR) of 6.21% from 2025 to 2033 indicates a significant expansion over the forecast period. Key drivers include the growing need for less-lethal alternatives to firearms in law enforcement, enhanced technological advancements in CEW design leading to improved safety and effectiveness, and a rise in personal self-defense applications. Market segmentation reveals a strong preference for stun guns within the device type category, while cartridges and weapons are the major equipment types driving growth. Law enforcement agencies currently dominate the end-user segment, though the personal use sector shows considerable potential for future growth, fueled by increasing crime rates and public safety concerns. Regional analysis suggests strong growth across all US regions, with potential variations depending on specific state laws and regulations. The historical period (2019-2024) likely witnessed a steady market expansion, setting the stage for the accelerated growth projected for the forecast period.
The competitive landscape features established players like SABRE, Axon Enterprise, and Vipertek, alongside several smaller manufacturers. These companies are continually innovating, introducing new CEW models with enhanced features such as improved accuracy, longer range, and enhanced safety mechanisms. Future market growth will depend on several factors, including government regulations surrounding CEW usage, public perception of their safety and effectiveness, and ongoing technological advancements. The increasing focus on officer safety and the reduction of injuries and fatalities during law enforcement operations is expected to fuel considerable growth within the law enforcement segment. Furthermore, effective marketing campaigns emphasizing the benefits of CEWs for personal safety are likely to boost demand in the civilian market.
US Conducted Energy Weapons Market Report: A Comprehensive Analysis (2019-2033)
This dynamic report provides a thorough examination of the US Conducted Energy Weapons (CEW) market, offering invaluable insights for stakeholders across the industry. Leveraging extensive market research and data analysis covering the period 2019-2033, this report forecasts robust growth and identifies key opportunities within this rapidly evolving sector. The study period encompasses historical data (2019-2024), the base year (2025), and a comprehensive forecast (2025-2033). The market is segmented by type (Stun Gun, Taser, Stun Baton), equipment type (Weapons, Cartridges), and end-user (Law Enforcement Agencies, Personal Use), providing a granular understanding of market dynamics. Key players like SABRE - Security Equipment Corp, Streetwise Security Products, Axon Enterprise Inc, Vipertek, Guard Dog Security, PhaZZer LL, and Foxfend are analyzed for their market share, strategies, and competitive positioning.
US Conducted Energy Weapons Market Market Structure & Competitive Landscape
The US Conducted Energy Weapons market exhibits a moderately concentrated structure in 2025, with the top 5 players holding an estimated xx% market share. This concentration is driven by strong brand recognition, established distribution networks, and significant investments in R&D. Innovation is a crucial driver, with ongoing advancements in CEW technology focusing on improved safety features, enhanced effectiveness, and reduced collateral damage. Regulatory impacts, particularly concerning the use of CEWs by law enforcement, significantly influence market dynamics. Stringent regulations and potential liability concerns can impact adoption rates. Product substitutes, such as pepper spray and other non-lethal weapons, also present competitive challenges. The end-user segmentation is dominated by law enforcement agencies, reflecting their substantial demand for reliable and effective CEWs. However, the personal use segment is experiencing gradual growth, driven by increasing awareness of personal safety concerns. Mergers and acquisitions (M&A) activity within the industry has been moderate over the past five years, with approximately xx M&A deals recorded between 2020 and 2024. These transactions have primarily focused on expanding product portfolios, strengthening market presence, and gaining access to new technologies.
- Market Concentration: Top 5 players hold an estimated xx% market share in 2025.
- Innovation Drivers: Improved safety, enhanced effectiveness, reduced collateral damage.
- Regulatory Impacts: Stringent regulations influence adoption rates and create liability concerns.
- Product Substitutes: Pepper spray and other non-lethal weapons pose competition.
- End-User Segmentation: Law enforcement agencies dominate, with personal use showing steady growth.
- M&A Trends: Approximately xx M&A deals between 2020 and 2024, focused on portfolio expansion and technological access.
US Conducted Energy Weapons Market Market Trends & Opportunities
The US Conducted Energy Weapons market is projected to witness significant growth during the forecast period (2025-2033), with an estimated Compound Annual Growth Rate (CAGR) of xx%. This expansion is fueled by several factors. Technological advancements, particularly in areas such as improved battery life, enhanced targeting systems, and data recording capabilities, are driving adoption among both law enforcement and personal users. Consumer preferences are shifting towards more compact, user-friendly, and less-lethal options. The competitive landscape is characterized by ongoing innovation and strategic partnerships. Companies are investing heavily in R&D to differentiate their offerings and cater to the evolving needs of their target markets. Market penetration rates are expected to increase significantly across both law enforcement and personal use segments, driven by increased awareness of CEW capabilities and improved product availability. The market is further driven by a growing focus on less-lethal alternatives to firearms in law enforcement contexts and increasing concerns about personal safety, particularly among women and vulnerable populations. Increased awareness campaigns and the introduction of more advanced and user-friendly models are also contributing factors.
Dominant Markets & Segments in US Conducted Energy Weapons Market
The largest segment within the US Conducted Energy Weapons market in 2025 is the Law Enforcement Agencies end-user segment, accounting for approximately xx% of the market. The Stun Gun type holds the largest market share among the various CEW types, reflecting its widespread availability and affordability. Geographically, the market is concentrated in major urban areas, with higher demand in states with larger law enforcement agencies and higher crime rates.
- Key Growth Drivers in Law Enforcement Segment:
- Increased adoption of less-lethal weapons policies by law enforcement agencies.
- Growing awareness of the effectiveness of CEWs in de-escalating potentially violent situations.
- Government funding and procurement programs for equipping law enforcement officers with CEWs.
- Key Growth Drivers in Personal Use Segment:
- Rising awareness of personal safety and self-defense needs.
- Increased availability of compact and user-friendly CEW devices.
- Growing consumer demand for non-lethal self-defense tools.
- Geographic Concentration: Larger urban areas with significant law enforcement presence exhibit higher market concentration.
US Conducted Energy Weapons Market Product Analysis
Recent product innovations in the US CEW market focus on enhancing safety features, improving accuracy, and integrating advanced technologies like data recording and GPS tracking. These advancements are crucial for addressing concerns surrounding collateral damage and ensuring responsible use. The increased use of lightweight materials and ergonomic designs makes these weapons more user-friendly, contributing to increased adoption rates. Companies are developing models specifically tailored to law enforcement needs and personal self-defense applications, further boosting market growth. Key competitive advantages center on superior technology, ease of use, reliability, and after-sales service.
Key Drivers, Barriers & Challenges in US Conducted Energy Weapons Market
Key Drivers: Technological advancements (e.g., improved targeting systems, enhanced safety features), increasing demand for less-lethal weapons in law enforcement, and rising personal safety concerns are major drivers. Government support through procurement initiatives also plays a significant role.
Key Barriers & Challenges: Stringent regulatory frameworks and potential liability concerns can impede market growth. Supply chain disruptions and the availability of raw materials can lead to production bottlenecks. Intense competition from established players and emerging entrants requires ongoing innovation and strategic maneuvering. The potential for misuse and negative publicity surrounding CEWs remains a significant challenge. Estimating the quantifiable impact of these challenges requires detailed, specific data not available currently – estimated at a xx% reduction in market growth during 2025-2033.
Growth Drivers in the US Conducted Energy Weapons Market Market
Technological advancements in CEW design, focusing on improved safety and effectiveness, along with increasing government procurement, are key growth drivers. The rising need for less-lethal alternatives within law enforcement coupled with increased consumer awareness of self-defense options fuels market expansion. Furthermore, favorable regulatory environments in certain regions and a steady increase in the number of CEW users also contribute. Lastly, strategic partnerships and collaborations among industry players further enhance the market’s growth trajectory.
Challenges Impacting US Conducted Energy Weapons Market Growth
Regulatory hurdles, including evolving legal frameworks surrounding CEW usage and liability, can slow down market expansion. Supply chain vulnerabilities and the rising cost of raw materials create manufacturing challenges. Fierce competition, driven by numerous players, necessitates continuous innovation and investment in R&D. Negative publicity and ethical concerns surrounding the appropriate and responsible use of CEWs remain significant challenges. The estimated impact of these challenges on market growth during 2025-2033 is a xx% reduction in projected sales figures.
Key Players Shaping the US Conducted Energy Weapons Market Market
- SABRE - Security Equipment Corp
- Streetwise Security Products
- Axon Enterprise Inc
- Vipertek
- Guard Dog Security
- PhaZZer LL
- Foxfend
Significant US Conducted Energy Weapons Market Industry Milestones
- 2021: Axon Enterprise Inc. launches a new line of CEWs with enhanced safety features.
- 2022: New regulations concerning the use of CEWs by law enforcement agencies are implemented in several states.
- 2023: A major player in the CEW market acquires a smaller competitor, expanding its product portfolio.
- 2024: Significant technological advancements in battery technology lead to improved CEW performance.
Future Outlook for US Conducted Energy Weapons Market Market
The US Conducted Energy Weapons market is poised for continued growth, driven by technological advancements, increasing demand from law enforcement, and rising consumer awareness. Strategic partnerships, investments in R&D, and the development of new and innovative products will shape the market's trajectory. The market is expected to witness a sustained growth momentum throughout the forecast period, presenting significant opportunities for established players and new entrants alike. Expanding into international markets also holds considerable potential for growth.
US Conducted Energy Weapons Market Segmentation
- 1. Production Analysis
- 2. Consumption Analysis
- 3. Import Market Analysis (Value & Volume)
- 4. Export Market Analysis (Value & Volume)
- 5. Price Trend Analysis
US Conducted Energy Weapons Market Segmentation By Geography
-
1. North America
- 1.1. United States
- 1.2. Canada
- 1.3. Mexico
-
2. South America
- 2.1. Brazil
- 2.2. Argentina
- 2.3. Rest of South America
-
3. Europe
- 3.1. United Kingdom
- 3.2. Germany
- 3.3. France
- 3.4. Italy
- 3.5. Spain
- 3.6. Russia
- 3.7. Benelux
- 3.8. Nordics
- 3.9. Rest of Europe
-
4. Middle East & Africa
- 4.1. Turkey
- 4.2. Israel
- 4.3. GCC
- 4.4. North Africa
- 4.5. South Africa
- 4.6. Rest of Middle East & Africa
-
5. Asia Pacific
- 5.1. China
- 5.2. India
- 5.3. Japan
- 5.4. South Korea
- 5.5. ASEAN
- 5.6. Oceania
- 5.7. Rest of Asia Pacific
US Conducted Energy Weapons Market REPORT HIGHLIGHTS
| Aspects | Details |
|---|---|
| Study Period | 2019-2033 |
| Base Year | 2024 |
| Estimated Year | 2025 |
| Forecast Period | 2025-2033 |
| Historical Period | 2019-2024 |
| Growth Rate | CAGR of 6.21% from 2019-2033 |
| Segmentation |
|
Table of Contents
- 1. Introduction
- 1.1. Research Scope
- 1.2. Market Segmentation
- 1.3. Research Methodology
- 1.4. Definitions and Assumptions
- 2. Executive Summary
- 2.1. Introduction
- 3. Market Dynamics
- 3.1. Introduction
- 3.2. Market Drivers
- 3.2.1. ; Increased Seaborne Threats And Ambiguous Maritime Security Policies; Increasing Adoption Of Security Technologies In Bric Countries
- 3.3. Market Restrains
- 3.3.1. ; High Risk Rate In Ungoverned Zones; Unstructured Security Standards And Technologies
- 3.4. Market Trends
- 3.4.1. Increasing Incidents of Civil Unrest Driving Procurement
- 4. Market Factor Analysis
- 4.1. Porters Five Forces
- 4.2. Supply/Value Chain
- 4.3. PESTEL analysis
- 4.4. Market Entropy
- 4.5. Patent/Trademark Analysis
- 5. Global US Conducted Energy Weapons Market Analysis, Insights and Forecast, 2019-2031
- 5.1. Market Analysis, Insights and Forecast - by Production Analysis
- 5.2. Market Analysis, Insights and Forecast - by Consumption Analysis
- 5.3. Market Analysis, Insights and Forecast - by Import Market Analysis (Value & Volume)
- 5.4. Market Analysis, Insights and Forecast - by Export Market Analysis (Value & Volume)
- 5.5. Market Analysis, Insights and Forecast - by Price Trend Analysis
- 5.6. Market Analysis, Insights and Forecast - by Region
- 5.6.1. North America
- 5.6.2. South America
- 5.6.3. Europe
- 5.6.4. Middle East & Africa
- 5.6.5. Asia Pacific
- 5.1. Market Analysis, Insights and Forecast - by Production Analysis
- 6. North America US Conducted Energy Weapons Market Analysis, Insights and Forecast, 2019-2031
- 6.1. Market Analysis, Insights and Forecast - by Production Analysis
- 6.2. Market Analysis, Insights and Forecast - by Consumption Analysis
- 6.3. Market Analysis, Insights and Forecast - by Import Market Analysis (Value & Volume)
- 6.4. Market Analysis, Insights and Forecast - by Export Market Analysis (Value & Volume)
- 6.5. Market Analysis, Insights and Forecast - by Price Trend Analysis
- 6.1. Market Analysis, Insights and Forecast - by Production Analysis
- 7. South America US Conducted Energy Weapons Market Analysis, Insights and Forecast, 2019-2031
- 7.1. Market Analysis, Insights and Forecast - by Production Analysis
- 7.2. Market Analysis, Insights and Forecast - by Consumption Analysis
- 7.3. Market Analysis, Insights and Forecast - by Import Market Analysis (Value & Volume)
- 7.4. Market Analysis, Insights and Forecast - by Export Market Analysis (Value & Volume)
- 7.5. Market Analysis, Insights and Forecast - by Price Trend Analysis
- 7.1. Market Analysis, Insights and Forecast - by Production Analysis
- 8. Europe US Conducted Energy Weapons Market Analysis, Insights and Forecast, 2019-2031
- 8.1. Market Analysis, Insights and Forecast - by Production Analysis
- 8.2. Market Analysis, Insights and Forecast - by Consumption Analysis
- 8.3. Market Analysis, Insights and Forecast - by Import Market Analysis (Value & Volume)
- 8.4. Market Analysis, Insights and Forecast - by Export Market Analysis (Value & Volume)
- 8.5. Market Analysis, Insights and Forecast - by Price Trend Analysis
- 8.1. Market Analysis, Insights and Forecast - by Production Analysis
- 9. Middle East & Africa US Conducted Energy Weapons Market Analysis, Insights and Forecast, 2019-2031
- 9.1. Market Analysis, Insights and Forecast - by Production Analysis
- 9.2. Market Analysis, Insights and Forecast - by Consumption Analysis
- 9.3. Market Analysis, Insights and Forecast - by Import Market Analysis (Value & Volume)
- 9.4. Market Analysis, Insights and Forecast - by Export Market Analysis (Value & Volume)
- 9.5. Market Analysis, Insights and Forecast - by Price Trend Analysis
- 9.1. Market Analysis, Insights and Forecast - by Production Analysis
- 10. Asia Pacific US Conducted Energy Weapons Market Analysis, Insights and Forecast, 2019-2031
- 10.1. Market Analysis, Insights and Forecast - by Production Analysis
- 10.2. Market Analysis, Insights and Forecast - by Consumption Analysis
- 10.3. Market Analysis, Insights and Forecast - by Import Market Analysis (Value & Volume)
- 10.4. Market Analysis, Insights and Forecast - by Export Market Analysis (Value & Volume)
- 10.5. Market Analysis, Insights and Forecast - by Price Trend Analysis
- 10.1. Market Analysis, Insights and Forecast - by Production Analysis
- 11. Northeast US Conducted Energy Weapons Market Analysis, Insights and Forecast, 2019-2031
- 12. Southeast US Conducted Energy Weapons Market Analysis, Insights and Forecast, 2019-2031
- 13. Midwest US Conducted Energy Weapons Market Analysis, Insights and Forecast, 2019-2031
- 14. Southwest US Conducted Energy Weapons Market Analysis, Insights and Forecast, 2019-2031
- 15. West US Conducted Energy Weapons Market Analysis, Insights and Forecast, 2019-2031
- 16. Competitive Analysis
- 16.1. Global Market Share Analysis 2024
- 16.2. Company Profiles
- 16.2.1 SABRE - Security Equipment Corp
- 16.2.1.1. Overview
- 16.2.1.2. Products
- 16.2.1.3. SWOT Analysis
- 16.2.1.4. Recent Developments
- 16.2.1.5. Financials (Based on Availability)
- 16.2.2 Streetwise Security Products
- 16.2.2.1. Overview
- 16.2.2.2. Products
- 16.2.2.3. SWOT Analysis
- 16.2.2.4. Recent Developments
- 16.2.2.5. Financials (Based on Availability)
- 16.2.3 Axon Enterprise Inc
- 16.2.3.1. Overview
- 16.2.3.2. Products
- 16.2.3.3. SWOT Analysis
- 16.2.3.4. Recent Developments
- 16.2.3.5. Financials (Based on Availability)
- 16.2.4 Vipertek
- 16.2.4.1. Overview
- 16.2.4.2. Products
- 16.2.4.3. SWOT Analysis
- 16.2.4.4. Recent Developments
- 16.2.4.5. Financials (Based on Availability)
- 16.2.5 Guard Dog Security
- 16.2.5.1. Overview
- 16.2.5.2. Products
- 16.2.5.3. SWOT Analysis
- 16.2.5.4. Recent Developments
- 16.2.5.5. Financials (Based on Availability)
- 16.2.6 PhaZZer LL
- 16.2.6.1. Overview
- 16.2.6.2. Products
- 16.2.6.3. SWOT Analysis
- 16.2.6.4. Recent Developments
- 16.2.6.5. Financials (Based on Availability)
- 16.2.7 Foxfend
- 16.2.7.1. Overview
- 16.2.7.2. Products
- 16.2.7.3. SWOT Analysis
- 16.2.7.4. Recent Developments
- 16.2.7.5. Financials (Based on Availability)
- 16.2.1 SABRE - Security Equipment Corp
List of Figures
- Figure 1: Global US Conducted Energy Weapons Market Revenue Breakdown (Million, %) by Region 2024 & 2032
- Figure 2: United states US Conducted Energy Weapons Market Revenue (Million), by Country 2024 & 2032
- Figure 3: United states US Conducted Energy Weapons Market Revenue Share (%), by Country 2024 & 2032
- Figure 4: North America US Conducted Energy Weapons Market Revenue (Million), by Production Analysis 2024 & 2032
- Figure 5: North America US Conducted Energy Weapons Market Revenue Share (%), by Production Analysis 2024 & 2032
- Figure 6: North America US Conducted Energy Weapons Market Revenue (Million), by Consumption Analysis 2024 & 2032
- Figure 7: North America US Conducted Energy Weapons Market Revenue Share (%), by Consumption Analysis 2024 & 2032
- Figure 8: North America US Conducted Energy Weapons Market Revenue (Million), by Import Market Analysis (Value & Volume) 2024 & 2032
- Figure 9: North America US Conducted Energy Weapons Market Revenue Share (%), by Import Market Analysis (Value & Volume) 2024 & 2032
- Figure 10: North America US Conducted Energy Weapons Market Revenue (Million), by Export Market Analysis (Value & Volume) 2024 & 2032
- Figure 11: North America US Conducted Energy Weapons Market Revenue Share (%), by Export Market Analysis (Value & Volume) 2024 & 2032
- Figure 12: North America US Conducted Energy Weapons Market Revenue (Million), by Price Trend Analysis 2024 & 2032
- Figure 13: North America US Conducted Energy Weapons Market Revenue Share (%), by Price Trend Analysis 2024 & 2032
- Figure 14: North America US Conducted Energy Weapons Market Revenue (Million), by Country 2024 & 2032
- Figure 15: North America US Conducted Energy Weapons Market Revenue Share (%), by Country 2024 & 2032
- Figure 16: South America US Conducted Energy Weapons Market Revenue (Million), by Production Analysis 2024 & 2032
- Figure 17: South America US Conducted Energy Weapons Market Revenue Share (%), by Production Analysis 2024 & 2032
- Figure 18: South America US Conducted Energy Weapons Market Revenue (Million), by Consumption Analysis 2024 & 2032
- Figure 19: South America US Conducted Energy Weapons Market Revenue Share (%), by Consumption Analysis 2024 & 2032
- Figure 20: South America US Conducted Energy Weapons Market Revenue (Million), by Import Market Analysis (Value & Volume) 2024 & 2032
- Figure 21: South America US Conducted Energy Weapons Market Revenue Share (%), by Import Market Analysis (Value & Volume) 2024 & 2032
- Figure 22: South America US Conducted Energy Weapons Market Revenue (Million), by Export Market Analysis (Value & Volume) 2024 & 2032
- Figure 23: South America US Conducted Energy Weapons Market Revenue Share (%), by Export Market Analysis (Value & Volume) 2024 & 2032
- Figure 24: South America US Conducted Energy Weapons Market Revenue (Million), by Price Trend Analysis 2024 & 2032
- Figure 25: South America US Conducted Energy Weapons Market Revenue Share (%), by Price Trend Analysis 2024 & 2032
- Figure 26: South America US Conducted Energy Weapons Market Revenue (Million), by Country 2024 & 2032
- Figure 27: South America US Conducted Energy Weapons Market Revenue Share (%), by Country 2024 & 2032
- Figure 28: Europe US Conducted Energy Weapons Market Revenue (Million), by Production Analysis 2024 & 2032
- Figure 29: Europe US Conducted Energy Weapons Market Revenue Share (%), by Production Analysis 2024 & 2032
- Figure 30: Europe US Conducted Energy Weapons Market Revenue (Million), by Consumption Analysis 2024 & 2032
- Figure 31: Europe US Conducted Energy Weapons Market Revenue Share (%), by Consumption Analysis 2024 & 2032
- Figure 32: Europe US Conducted Energy Weapons Market Revenue (Million), by Import Market Analysis (Value & Volume) 2024 & 2032
- Figure 33: Europe US Conducted Energy Weapons Market Revenue Share (%), by Import Market Analysis (Value & Volume) 2024 & 2032
- Figure 34: Europe US Conducted Energy Weapons Market Revenue (Million), by Export Market Analysis (Value & Volume) 2024 & 2032
- Figure 35: Europe US Conducted Energy Weapons Market Revenue Share (%), by Export Market Analysis (Value & Volume) 2024 & 2032
- Figure 36: Europe US Conducted Energy Weapons Market Revenue (Million), by Price Trend Analysis 2024 & 2032
- Figure 37: Europe US Conducted Energy Weapons Market Revenue Share (%), by Price Trend Analysis 2024 & 2032
- Figure 38: Europe US Conducted Energy Weapons Market Revenue (Million), by Country 2024 & 2032
- Figure 39: Europe US Conducted Energy Weapons Market Revenue Share (%), by Country 2024 & 2032
- Figure 40: Middle East & Africa US Conducted Energy Weapons Market Revenue (Million), by Production Analysis 2024 & 2032
- Figure 41: Middle East & Africa US Conducted Energy Weapons Market Revenue Share (%), by Production Analysis 2024 & 2032
- Figure 42: Middle East & Africa US Conducted Energy Weapons Market Revenue (Million), by Consumption Analysis 2024 & 2032
- Figure 43: Middle East & Africa US Conducted Energy Weapons Market Revenue Share (%), by Consumption Analysis 2024 & 2032
- Figure 44: Middle East & Africa US Conducted Energy Weapons Market Revenue (Million), by Import Market Analysis (Value & Volume) 2024 & 2032
- Figure 45: Middle East & Africa US Conducted Energy Weapons Market Revenue Share (%), by Import Market Analysis (Value & Volume) 2024 & 2032
- Figure 46: Middle East & Africa US Conducted Energy Weapons Market Revenue (Million), by Export Market Analysis (Value & Volume) 2024 & 2032
- Figure 47: Middle East & Africa US Conducted Energy Weapons Market Revenue Share (%), by Export Market Analysis (Value & Volume) 2024 & 2032
- Figure 48: Middle East & Africa US Conducted Energy Weapons Market Revenue (Million), by Price Trend Analysis 2024 & 2032
- Figure 49: Middle East & Africa US Conducted Energy Weapons Market Revenue Share (%), by Price Trend Analysis 2024 & 2032
- Figure 50: Middle East & Africa US Conducted Energy Weapons Market Revenue (Million), by Country 2024 & 2032
- Figure 51: Middle East & Africa US Conducted Energy Weapons Market Revenue Share (%), by Country 2024 & 2032
- Figure 52: Asia Pacific US Conducted Energy Weapons Market Revenue (Million), by Production Analysis 2024 & 2032
- Figure 53: Asia Pacific US Conducted Energy Weapons Market Revenue Share (%), by Production Analysis 2024 & 2032
- Figure 54: Asia Pacific US Conducted Energy Weapons Market Revenue (Million), by Consumption Analysis 2024 & 2032
- Figure 55: Asia Pacific US Conducted Energy Weapons Market Revenue Share (%), by Consumption Analysis 2024 & 2032
- Figure 56: Asia Pacific US Conducted Energy Weapons Market Revenue (Million), by Import Market Analysis (Value & Volume) 2024 & 2032
- Figure 57: Asia Pacific US Conducted Energy Weapons Market Revenue Share (%), by Import Market Analysis (Value & Volume) 2024 & 2032
- Figure 58: Asia Pacific US Conducted Energy Weapons Market Revenue (Million), by Export Market Analysis (Value & Volume) 2024 & 2032
- Figure 59: Asia Pacific US Conducted Energy Weapons Market Revenue Share (%), by Export Market Analysis (Value & Volume) 2024 & 2032
- Figure 60: Asia Pacific US Conducted Energy Weapons Market Revenue (Million), by Price Trend Analysis 2024 & 2032
- Figure 61: Asia Pacific US Conducted Energy Weapons Market Revenue Share (%), by Price Trend Analysis 2024 & 2032
- Figure 62: Asia Pacific US Conducted Energy Weapons Market Revenue (Million), by Country 2024 & 2032
- Figure 63: Asia Pacific US Conducted Energy Weapons Market Revenue Share (%), by Country 2024 & 2032
List of Tables
- Table 1: Global US Conducted Energy Weapons Market Revenue Million Forecast, by Region 2019 & 2032
- Table 2: Global US Conducted Energy Weapons Market Revenue Million Forecast, by Production Analysis 2019 & 2032
- Table 3: Global US Conducted Energy Weapons Market Revenue Million Forecast, by Consumption Analysis 2019 & 2032
- Table 4: Global US Conducted Energy Weapons Market Revenue Million Forecast, by Import Market Analysis (Value & Volume) 2019 & 2032
- Table 5: Global US Conducted Energy Weapons Market Revenue Million Forecast, by Export Market Analysis (Value & Volume) 2019 & 2032
- Table 6: Global US Conducted Energy Weapons Market Revenue Million Forecast, by Price Trend Analysis 2019 & 2032
- Table 7: Global US Conducted Energy Weapons Market Revenue Million Forecast, by Region 2019 & 2032
- Table 8: Global US Conducted Energy Weapons Market Revenue Million Forecast, by Country 2019 & 2032
- Table 9: Northeast US Conducted Energy Weapons Market Revenue (Million) Forecast, by Application 2019 & 2032
- Table 10: Southeast US Conducted Energy Weapons Market Revenue (Million) Forecast, by Application 2019 & 2032
- Table 11: Midwest US Conducted Energy Weapons Market Revenue (Million) Forecast, by Application 2019 & 2032
- Table 12: Southwest US Conducted Energy Weapons Market Revenue (Million) Forecast, by Application 2019 & 2032
- Table 13: West US Conducted Energy Weapons Market Revenue (Million) Forecast, by Application 2019 & 2032
- Table 14: Global US Conducted Energy Weapons Market Revenue Million Forecast, by Production Analysis 2019 & 2032
- Table 15: Global US Conducted Energy Weapons Market Revenue Million Forecast, by Consumption Analysis 2019 & 2032
- Table 16: Global US Conducted Energy Weapons Market Revenue Million Forecast, by Import Market Analysis (Value & Volume) 2019 & 2032
- Table 17: Global US Conducted Energy Weapons Market Revenue Million Forecast, by Export Market Analysis (Value & Volume) 2019 & 2032
- Table 18: Global US Conducted Energy Weapons Market Revenue Million Forecast, by Price Trend Analysis 2019 & 2032
- Table 19: Global US Conducted Energy Weapons Market Revenue Million Forecast, by Country 2019 & 2032
- Table 20: United States US Conducted Energy Weapons Market Revenue (Million) Forecast, by Application 2019 & 2032
- Table 21: Canada US Conducted Energy Weapons Market Revenue (Million) Forecast, by Application 2019 & 2032
- Table 22: Mexico US Conducted Energy Weapons Market Revenue (Million) Forecast, by Application 2019 & 2032
- Table 23: Global US Conducted Energy Weapons Market Revenue Million Forecast, by Production Analysis 2019 & 2032
- Table 24: Global US Conducted Energy Weapons Market Revenue Million Forecast, by Consumption Analysis 2019 & 2032
- Table 25: Global US Conducted Energy Weapons Market Revenue Million Forecast, by Import Market Analysis (Value & Volume) 2019 & 2032
- Table 26: Global US Conducted Energy Weapons Market Revenue Million Forecast, by Export Market Analysis (Value & Volume) 2019 & 2032
- Table 27: Global US Conducted Energy Weapons Market Revenue Million Forecast, by Price Trend Analysis 2019 & 2032
- Table 28: Global US Conducted Energy Weapons Market Revenue Million Forecast, by Country 2019 & 2032
- Table 29: Brazil US Conducted Energy Weapons Market Revenue (Million) Forecast, by Application 2019 & 2032
- Table 30: Argentina US Conducted Energy Weapons Market Revenue (Million) Forecast, by Application 2019 & 2032
- Table 31: Rest of South America US Conducted Energy Weapons Market Revenue (Million) Forecast, by Application 2019 & 2032
- Table 32: Global US Conducted Energy Weapons Market Revenue Million Forecast, by Production Analysis 2019 & 2032
- Table 33: Global US Conducted Energy Weapons Market Revenue Million Forecast, by Consumption Analysis 2019 & 2032
- Table 34: Global US Conducted Energy Weapons Market Revenue Million Forecast, by Import Market Analysis (Value & Volume) 2019 & 2032
- Table 35: Global US Conducted Energy Weapons Market Revenue Million Forecast, by Export Market Analysis (Value & Volume) 2019 & 2032
- Table 36: Global US Conducted Energy Weapons Market Revenue Million Forecast, by Price Trend Analysis 2019 & 2032
- Table 37: Global US Conducted Energy Weapons Market Revenue Million Forecast, by Country 2019 & 2032
- Table 38: United Kingdom US Conducted Energy Weapons Market Revenue (Million) Forecast, by Application 2019 & 2032
- Table 39: Germany US Conducted Energy Weapons Market Revenue (Million) Forecast, by Application 2019 & 2032
- Table 40: France US Conducted Energy Weapons Market Revenue (Million) Forecast, by Application 2019 & 2032
- Table 41: Italy US Conducted Energy Weapons Market Revenue (Million) Forecast, by Application 2019 & 2032
- Table 42: Spain US Conducted Energy Weapons Market Revenue (Million) Forecast, by Application 2019 & 2032
- Table 43: Russia US Conducted Energy Weapons Market Revenue (Million) Forecast, by Application 2019 & 2032
- Table 44: Benelux US Conducted Energy Weapons Market Revenue (Million) Forecast, by Application 2019 & 2032
- Table 45: Nordics US Conducted Energy Weapons Market Revenue (Million) Forecast, by Application 2019 & 2032
- Table 46: Rest of Europe US Conducted Energy Weapons Market Revenue (Million) Forecast, by Application 2019 & 2032
- Table 47: Global US Conducted Energy Weapons Market Revenue Million Forecast, by Production Analysis 2019 & 2032
- Table 48: Global US Conducted Energy Weapons Market Revenue Million Forecast, by Consumption Analysis 2019 & 2032
- Table 49: Global US Conducted Energy Weapons Market Revenue Million Forecast, by Import Market Analysis (Value & Volume) 2019 & 2032
- Table 50: Global US Conducted Energy Weapons Market Revenue Million Forecast, by Export Market Analysis (Value & Volume) 2019 & 2032
- Table 51: Global US Conducted Energy Weapons Market Revenue Million Forecast, by Price Trend Analysis 2019 & 2032
- Table 52: Global US Conducted Energy Weapons Market Revenue Million Forecast, by Country 2019 & 2032
- Table 53: Turkey US Conducted Energy Weapons Market Revenue (Million) Forecast, by Application 2019 & 2032
- Table 54: Israel US Conducted Energy Weapons Market Revenue (Million) Forecast, by Application 2019 & 2032
- Table 55: GCC US Conducted Energy Weapons Market Revenue (Million) Forecast, by Application 2019 & 2032
- Table 56: North Africa US Conducted Energy Weapons Market Revenue (Million) Forecast, by Application 2019 & 2032
- Table 57: South Africa US Conducted Energy Weapons Market Revenue (Million) Forecast, by Application 2019 & 2032
- Table 58: Rest of Middle East & Africa US Conducted Energy Weapons Market Revenue (Million) Forecast, by Application 2019 & 2032
- Table 59: Global US Conducted Energy Weapons Market Revenue Million Forecast, by Production Analysis 2019 & 2032
- Table 60: Global US Conducted Energy Weapons Market Revenue Million Forecast, by Consumption Analysis 2019 & 2032
- Table 61: Global US Conducted Energy Weapons Market Revenue Million Forecast, by Import Market Analysis (Value & Volume) 2019 & 2032
- Table 62: Global US Conducted Energy Weapons Market Revenue Million Forecast, by Export Market Analysis (Value & Volume) 2019 & 2032
- Table 63: Global US Conducted Energy Weapons Market Revenue Million Forecast, by Price Trend Analysis 2019 & 2032
- Table 64: Global US Conducted Energy Weapons Market Revenue Million Forecast, by Country 2019 & 2032
- Table 65: China US Conducted Energy Weapons Market Revenue (Million) Forecast, by Application 2019 & 2032
- Table 66: India US Conducted Energy Weapons Market Revenue (Million) Forecast, by Application 2019 & 2032
- Table 67: Japan US Conducted Energy Weapons Market Revenue (Million) Forecast, by Application 2019 & 2032
- Table 68: South Korea US Conducted Energy Weapons Market Revenue (Million) Forecast, by Application 2019 & 2032
- Table 69: ASEAN US Conducted Energy Weapons Market Revenue (Million) Forecast, by Application 2019 & 2032
- Table 70: Oceania US Conducted Energy Weapons Market Revenue (Million) Forecast, by Application 2019 & 2032
- Table 71: Rest of Asia Pacific US Conducted Energy Weapons Market Revenue (Million) Forecast, by Application 2019 & 2032
Frequently Asked Questions
1. What is the projected Compound Annual Growth Rate (CAGR) of the US Conducted Energy Weapons Market?
The projected CAGR is approximately 6.21%.
2. Which companies are prominent players in the US Conducted Energy Weapons Market?
Key companies in the market include SABRE - Security Equipment Corp, Streetwise Security Products, Axon Enterprise Inc, Vipertek, Guard Dog Security, PhaZZer LL, Foxfend.
3. What are the main segments of the US Conducted Energy Weapons Market?
The market segments include Production Analysis, Consumption Analysis, Import Market Analysis (Value & Volume), Export Market Analysis (Value & Volume), Price Trend Analysis.
4. Can you provide details about the market size?
The market size is estimated to be USD 657.12 Million as of 2022.
5. What are some drivers contributing to market growth?
; Increased Seaborne Threats And Ambiguous Maritime Security Policies; Increasing Adoption Of Security Technologies In Bric Countries.
6. What are the notable trends driving market growth?
Increasing Incidents of Civil Unrest Driving Procurement.
7. Are there any restraints impacting market growth?
; High Risk Rate In Ungoverned Zones; Unstructured Security Standards And Technologies.
8. Can you provide examples of recent developments in the market?
N/A
9. What pricing options are available for accessing the report?
Pricing options include single-user, multi-user, and enterprise licenses priced at USD 3800, USD 4500, and USD 5800 respectively.
10. Is the market size provided in terms of value or volume?
The market size is provided in terms of value, measured in Million.
11. Are there any specific market keywords associated with the report?
Yes, the market keyword associated with the report is "US Conducted Energy Weapons Market," which aids in identifying and referencing the specific market segment covered.
12. How do I determine which pricing option suits my needs best?
The pricing options vary based on user requirements and access needs. Individual users may opt for single-user licenses, while businesses requiring broader access may choose multi-user or enterprise licenses for cost-effective access to the report.
13. Are there any additional resources or data provided in the US Conducted Energy Weapons Market report?
While the report offers comprehensive insights, it's advisable to review the specific contents or supplementary materials provided to ascertain if additional resources or data are available.
14. How can I stay updated on further developments or reports in the US Conducted Energy Weapons Market?
To stay informed about further developments, trends, and reports in the US Conducted Energy Weapons Market, consider subscribing to industry newsletters, following relevant companies and organizations, or regularly checking reputable industry news sources and publications.
Methodology
Step 1 - Identification of Relevant Samples Size from Population Database


Step 2 - Approaches for Defining Global Market Size (Value, Volume* & Price*)

Note*: In applicable scenarios
Step 3 - Data Sources
Primary Research
- Web Analytics
- Survey Reports
- Research Institute
- Latest Research Reports
- Opinion Leaders
Secondary Research
- Annual Reports
- White Paper
- Latest Press Release
- Industry Association
- Paid Database
- Investor Presentations

Step 4 - Data Triangulation
Involves using different sources of information in order to increase the validity of a study
These sources are likely to be stakeholders in a program - participants, other researchers, program staff, other community members, and so on.
Then we put all data in single framework & apply various statistical tools to find out the dynamic on the market.
During the analysis stage, feedback from the stakeholder groups would be compared to determine areas of agreement as well as areas of divergence
