

Key Insights
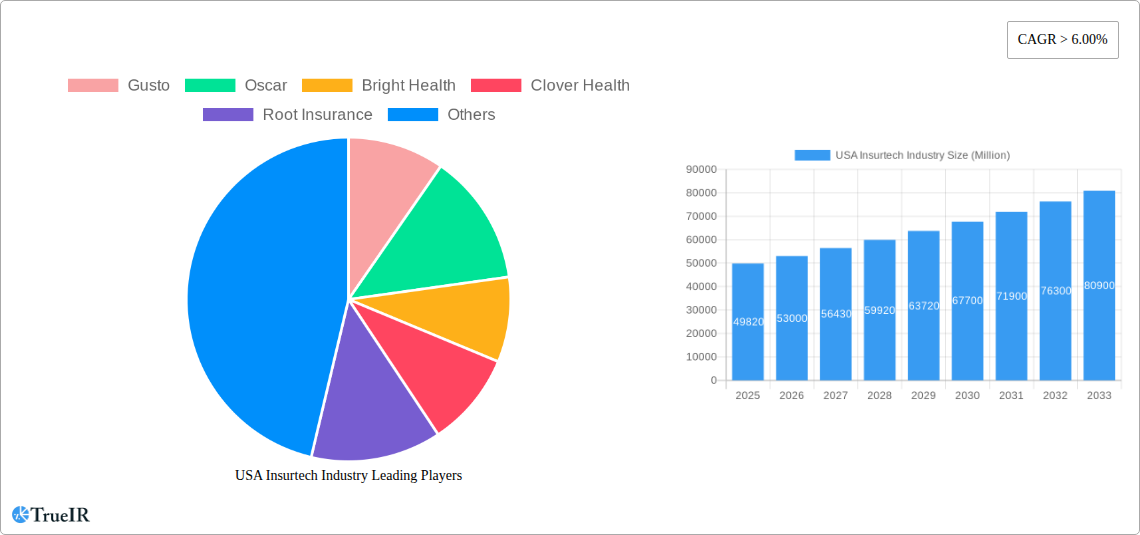
The U.S. Insurtech market, valued at $49.82 billion in 2025, is experiencing robust growth, projected to maintain a Compound Annual Growth Rate (CAGR) exceeding 6.00% from 2025 to 2033. This expansion is fueled by several key drivers. Increasing consumer adoption of digital technologies and mobile-first approaches are significantly impacting the insurance industry, leading to greater demand for convenient, online-based insurance solutions. Furthermore, the rise of data analytics and artificial intelligence (AI) is enabling insurers to offer personalized pricing and risk assessment, enhancing customer experience and improving operational efficiency. The emergence of innovative insurance products tailored to specific customer needs, such as micro-insurance and on-demand insurance, is also contributing to market growth. However, challenges remain, including stringent regulatory environments, cybersecurity concerns, and the need for robust data privacy measures. Competition is intense, with established players and disruptive startups vying for market share. Companies like Gusto, Oscar, Bright Health, and Lemonade are leading the charge, leveraging technology to streamline operations and deliver enhanced customer value propositions. The market is segmented by product type (e.g., auto, health, life), distribution channels (e.g., online, agents), and customer demographics. Future growth will likely be influenced by advancements in blockchain technology, the expansion of Insurtech into underserved markets, and increasing partnerships between traditional insurers and Insurtech firms.
The forecast period of 2025-2033 suggests continued market expansion, driven by ongoing technological advancements and evolving consumer preferences. Successfully navigating the regulatory landscape and managing cybersecurity risks will be crucial for Insurtech companies to sustain their growth trajectory. The continued integration of AI and machine learning will further refine risk assessment and claims processing, potentially reducing operational costs and enhancing customer satisfaction. The focus on personalized insurance offerings, leveraging data analytics to understand individual needs and tailor coverage, will continue to differentiate successful Insurtech firms. Expansion into new product categories and geographic markets, coupled with strategic partnerships, will be key growth strategies. The market is anticipated to see significant consolidation as larger players acquire smaller, more niche Insurtech companies.
Dynamic Report: USA Insurtech Industry Market Analysis (2019-2033)
This comprehensive report provides a detailed analysis of the burgeoning USA Insurtech industry, projecting robust growth from $xx Million in 2025 to $xx Million by 2033, representing a CAGR of xx%. Leveraging extensive research and data spanning the historical period (2019-2024), base year (2025), and forecast period (2025-2033), this report is an invaluable resource for investors, industry players, and strategic decision-makers. We delve deep into market structure, competitive dynamics, key segments, and future growth trajectories, offering actionable insights to navigate this rapidly evolving landscape.
USA Insurtech Industry Market Structure & Competitive Landscape
The USA Insurtech market is characterized by a moderately fragmented landscape with a Herfindahl-Hirschman Index (HHI) of xx in 2024, indicating neither perfect competition nor a monopoly. Innovation is a key driver, fueled by advancements in artificial intelligence (AI), machine learning (ML), and big data analytics. Stringent regulatory frameworks, including those from the [insert relevant regulatory bodies], significantly impact market operations. Product substitutes, such as traditional insurance models, pose a competitive challenge. End-user segmentation encompasses individual consumers, small and medium-sized enterprises (SMEs), and large corporations, with varying needs and preferences.
The market is experiencing a surge in mergers and acquisitions (M&A) activity. The volume of M&A deals in 2024 reached approximately xx deals, driven by strategic consolidation and expansion into new markets. This trend reflects both the opportunities and challenges within the industry, with larger players aggressively acquiring smaller, specialized companies to gain a competitive edge. For example, [Insert specific example of a recent M&A deal and its implications]
- Market Concentration: Moderate fragmentation (HHI: xx)
- Innovation Drivers: AI, ML, Big Data
- Regulatory Impacts: Significant impact from [insert regulatory bodies]
- Product Substitutes: Traditional insurance
- End-User Segmentation: Individuals, SMEs, Large Corporations
- M&A Trends: High volume, strategic consolidation
USA Insurtech Industry Market Trends & Opportunities
The USA Insurtech market is experiencing phenomenal growth, driven by several factors. Technological advancements are transforming the insurance landscape, enabling personalized offerings, enhanced risk assessment, and streamlined claims processing. Consumers are increasingly demanding digital-first solutions, favoring convenience, transparency, and personalized pricing. This shift is creating a fertile ground for Insurtech companies to disrupt traditional insurance models. The market's competitive dynamics are characterized by fierce rivalry, innovation, and rapid adaptation to changing consumer preferences.
Market size is projected to expand exponentially, with a substantial increase in market penetration, particularly amongst younger demographics. The high CAGR underscores the significant potential for growth and investment in the industry. The increased adoption of mobile and online platforms is also a significant contributor to market expansion.
Dominant Markets & Segments in USA Insurtech Industry
The dominant segment within the USA Insurtech market is currently the [Insert dominant segment, e.g., Personal Lines Insurance], accounting for approximately xx% of the total market revenue in 2024. This dominance is primarily attributed to several factors:
- Strong Consumer Adoption: High penetration of smartphones and online platforms.
- Favorable Regulatory Environment: [Insert specific examples of supporting regulations].
- Technological Advancements: Ease of integration with existing infrastructure.
Other prominent segments include commercial lines insurance and healthtech solutions, which are projected to experience substantial growth in the coming years.
USA Insurtech Industry Product Analysis
The Insurtech landscape is marked by a diverse array of products and services, ranging from AI-powered risk assessment tools and personalized insurance plans to digital claims processing platforms and telematics-based usage-based insurance (UBI). These innovations significantly improve efficiency, enhance customer experience, and reduce operational costs. The success of these products hinges on their ability to deliver value proposition to consumers, meet regulatory requirements, and effectively compete in a dynamic marketplace.
Key Drivers, Barriers & Challenges in USA Insurtech Industry
Key Drivers:
- Technological advancements like AI and ML enabling personalized insurance products and efficient risk assessment.
- Growing consumer demand for digital-first insurance solutions.
- Favorable regulatory environment in certain states supporting innovation.
Challenges:
- Regulatory hurdles, especially around data privacy and compliance (e.g., CCPA, GDPR).
- Cybersecurity risks and data breaches leading to financial losses and reputational damage.
- Intense competition from established players and emerging Insurtech firms.
Growth Drivers in the USA Insurtech Industry Market
The continued expansion of the USA Insurtech market is propelled by technological innovation, enabling more efficient and personalized services. Further regulatory clarity and supportive policies will accelerate adoption. Economic factors such as increasing disposable incomes and consumer preference for digital products drive significant growth.
Challenges Impacting USA Insurtech Industry Growth
Significant challenges include regulatory uncertainties, evolving cybersecurity threats, and persistent competition from established insurers and new entrants. These hurdles require strategic planning and adaptation to mitigate potential risks.
Key Players Shaping the USA Insurtech Industry Market
- Gusto
- Oscar
- Bright Health
- Clover Health
- Root Insurance
- American Well
- Lemonade
- Outsystems
- Next Insurance
- Metromile
- Hippo
- List Not Exhaustive
Significant USA Insurtech Industry Industry Milestones
- March 2023: Duck Creek Technologies acquired by Vista Equity Partners. This acquisition signifies increased investment in the P&C Insurtech space.
- January 2023: Encora's acquisition of Excellarate expands Encora's capabilities in AI, analytics, and automation, strengthening its position in the Insurtech sector.
Future Outlook for USA Insurtech Industry Market
The USA Insurtech market is poised for continued growth driven by technological advancements, evolving consumer preferences, and favorable regulatory developments. Strategic partnerships, increased investment, and the potential for innovative product development present substantial opportunities for market expansion. The potential for global expansion and partnerships with traditional insurers will significantly impact the future market landscape.
USA Insurtech Industry Segmentation
-
1. Business Model
- 1.1. Carrier
- 1.2. Enabler
- 1.3. Distributor
-
2. Insurance Type
- 2.1. Life Insurance
- 2.2. Non-Life Insurance
USA Insurtech Industry Segmentation By Geography
-
1. North America
- 1.1. United States
- 1.2. Canada
- 1.3. Mexico
-
2. South America
- 2.1. Brazil
- 2.2. Argentina
- 2.3. Rest of South America
-
3. Europe
- 3.1. United Kingdom
- 3.2. Germany
- 3.3. France
- 3.4. Italy
- 3.5. Spain
- 3.6. Russia
- 3.7. Benelux
- 3.8. Nordics
- 3.9. Rest of Europe
-
4. Middle East & Africa
- 4.1. Turkey
- 4.2. Israel
- 4.3. GCC
- 4.4. North Africa
- 4.5. South Africa
- 4.6. Rest of Middle East & Africa
-
5. Asia Pacific
- 5.1. China
- 5.2. India
- 5.3. Japan
- 5.4. South Korea
- 5.5. ASEAN
- 5.6. Oceania
- 5.7. Rest of Asia Pacific
USA Insurtech Industry REPORT HIGHLIGHTS
| Aspects | Details |
|---|---|
| Study Period | 2019-2033 |
| Base Year | 2024 |
| Estimated Year | 2025 |
| Forecast Period | 2025-2033 |
| Historical Period | 2019-2024 |
| Growth Rate | CAGR of > 6.00% from 2019-2033 |
| Segmentation |
|
Table of Contents
- 1. Introduction
- 1.1. Research Scope
- 1.2. Market Segmentation
- 1.3. Research Methodology
- 1.4. Definitions and Assumptions
- 2. Executive Summary
- 2.1. Introduction
- 3. Market Dynamics
- 3.1. Introduction
- 3.2. Market Drivers
- 3.2.1. Growing Demand for Data Analytics and Artificial Intelligence; Increasing Adoption of Digital Technologies
- 3.3. Market Restrains
- 3.3.1. Growing Demand for Data Analytics and Artificial Intelligence; Increasing Adoption of Digital Technologies
- 3.4. Market Trends
- 3.4.1. Surged Funding towards Insurtech Companies
- 4. Market Factor Analysis
- 4.1. Porters Five Forces
- 4.2. Supply/Value Chain
- 4.3. PESTEL analysis
- 4.4. Market Entropy
- 4.5. Patent/Trademark Analysis
- 5. Global USA Insurtech Industry Analysis, Insights and Forecast, 2019-2031
- 5.1. Market Analysis, Insights and Forecast - by Business Model
- 5.1.1. Carrier
- 5.1.2. Enabler
- 5.1.3. Distributor
- 5.2. Market Analysis, Insights and Forecast - by Insurance Type
- 5.2.1. Life Insurance
- 5.2.2. Non-Life Insurance
- 5.3. Market Analysis, Insights and Forecast - by Region
- 5.3.1. North America
- 5.3.2. South America
- 5.3.3. Europe
- 5.3.4. Middle East & Africa
- 5.3.5. Asia Pacific
- 5.1. Market Analysis, Insights and Forecast - by Business Model
- 6. North America USA Insurtech Industry Analysis, Insights and Forecast, 2019-2031
- 6.1. Market Analysis, Insights and Forecast - by Business Model
- 6.1.1. Carrier
- 6.1.2. Enabler
- 6.1.3. Distributor
- 6.2. Market Analysis, Insights and Forecast - by Insurance Type
- 6.2.1. Life Insurance
- 6.2.2. Non-Life Insurance
- 6.1. Market Analysis, Insights and Forecast - by Business Model
- 7. South America USA Insurtech Industry Analysis, Insights and Forecast, 2019-2031
- 7.1. Market Analysis, Insights and Forecast - by Business Model
- 7.1.1. Carrier
- 7.1.2. Enabler
- 7.1.3. Distributor
- 7.2. Market Analysis, Insights and Forecast - by Insurance Type
- 7.2.1. Life Insurance
- 7.2.2. Non-Life Insurance
- 7.1. Market Analysis, Insights and Forecast - by Business Model
- 8. Europe USA Insurtech Industry Analysis, Insights and Forecast, 2019-2031
- 8.1. Market Analysis, Insights and Forecast - by Business Model
- 8.1.1. Carrier
- 8.1.2. Enabler
- 8.1.3. Distributor
- 8.2. Market Analysis, Insights and Forecast - by Insurance Type
- 8.2.1. Life Insurance
- 8.2.2. Non-Life Insurance
- 8.1. Market Analysis, Insights and Forecast - by Business Model
- 9. Middle East & Africa USA Insurtech Industry Analysis, Insights and Forecast, 2019-2031
- 9.1. Market Analysis, Insights and Forecast - by Business Model
- 9.1.1. Carrier
- 9.1.2. Enabler
- 9.1.3. Distributor
- 9.2. Market Analysis, Insights and Forecast - by Insurance Type
- 9.2.1. Life Insurance
- 9.2.2. Non-Life Insurance
- 9.1. Market Analysis, Insights and Forecast - by Business Model
- 10. Asia Pacific USA Insurtech Industry Analysis, Insights and Forecast, 2019-2031
- 10.1. Market Analysis, Insights and Forecast - by Business Model
- 10.1.1. Carrier
- 10.1.2. Enabler
- 10.1.3. Distributor
- 10.2. Market Analysis, Insights and Forecast - by Insurance Type
- 10.2.1. Life Insurance
- 10.2.2. Non-Life Insurance
- 10.1. Market Analysis, Insights and Forecast - by Business Model
- 11. Competitive Analysis
- 11.1. Global Market Share Analysis 2024
- 11.2. Company Profiles
- 11.2.1 Gusto
- 11.2.1.1. Overview
- 11.2.1.2. Products
- 11.2.1.3. SWOT Analysis
- 11.2.1.4. Recent Developments
- 11.2.1.5. Financials (Based on Availability)
- 11.2.2 Oscar
- 11.2.2.1. Overview
- 11.2.2.2. Products
- 11.2.2.3. SWOT Analysis
- 11.2.2.4. Recent Developments
- 11.2.2.5. Financials (Based on Availability)
- 11.2.3 Bright Health
- 11.2.3.1. Overview
- 11.2.3.2. Products
- 11.2.3.3. SWOT Analysis
- 11.2.3.4. Recent Developments
- 11.2.3.5. Financials (Based on Availability)
- 11.2.4 Clover Health
- 11.2.4.1. Overview
- 11.2.4.2. Products
- 11.2.4.3. SWOT Analysis
- 11.2.4.4. Recent Developments
- 11.2.4.5. Financials (Based on Availability)
- 11.2.5 Root Insurance
- 11.2.5.1. Overview
- 11.2.5.2. Products
- 11.2.5.3. SWOT Analysis
- 11.2.5.4. Recent Developments
- 11.2.5.5. Financials (Based on Availability)
- 11.2.6 American Well
- 11.2.6.1. Overview
- 11.2.6.2. Products
- 11.2.6.3. SWOT Analysis
- 11.2.6.4. Recent Developments
- 11.2.6.5. Financials (Based on Availability)
- 11.2.7 Lemonade
- 11.2.7.1. Overview
- 11.2.7.2. Products
- 11.2.7.3. SWOT Analysis
- 11.2.7.4. Recent Developments
- 11.2.7.5. Financials (Based on Availability)
- 11.2.8 Outsystems
- 11.2.8.1. Overview
- 11.2.8.2. Products
- 11.2.8.3. SWOT Analysis
- 11.2.8.4. Recent Developments
- 11.2.8.5. Financials (Based on Availability)
- 11.2.9 Next Insurance
- 11.2.9.1. Overview
- 11.2.9.2. Products
- 11.2.9.3. SWOT Analysis
- 11.2.9.4. Recent Developments
- 11.2.9.5. Financials (Based on Availability)
- 11.2.10 Metromile
- 11.2.10.1. Overview
- 11.2.10.2. Products
- 11.2.10.3. SWOT Analysis
- 11.2.10.4. Recent Developments
- 11.2.10.5. Financials (Based on Availability)
- 11.2.11 Hippo**List Not Exhaustive
- 11.2.11.1. Overview
- 11.2.11.2. Products
- 11.2.11.3. SWOT Analysis
- 11.2.11.4. Recent Developments
- 11.2.11.5. Financials (Based on Availability)
- 11.2.1 Gusto
List of Figures
- Figure 1: Global USA Insurtech Industry Revenue Breakdown (Million, %) by Region 2024 & 2032
- Figure 2: Global USA Insurtech Industry Volume Breakdown (Billion, %) by Region 2024 & 2032
- Figure 3: North America USA Insurtech Industry Revenue (Million), by Business Model 2024 & 2032
- Figure 4: North America USA Insurtech Industry Volume (Billion), by Business Model 2024 & 2032
- Figure 5: North America USA Insurtech Industry Revenue Share (%), by Business Model 2024 & 2032
- Figure 6: North America USA Insurtech Industry Volume Share (%), by Business Model 2024 & 2032
- Figure 7: North America USA Insurtech Industry Revenue (Million), by Insurance Type 2024 & 2032
- Figure 8: North America USA Insurtech Industry Volume (Billion), by Insurance Type 2024 & 2032
- Figure 9: North America USA Insurtech Industry Revenue Share (%), by Insurance Type 2024 & 2032
- Figure 10: North America USA Insurtech Industry Volume Share (%), by Insurance Type 2024 & 2032
- Figure 11: North America USA Insurtech Industry Revenue (Million), by Country 2024 & 2032
- Figure 12: North America USA Insurtech Industry Volume (Billion), by Country 2024 & 2032
- Figure 13: North America USA Insurtech Industry Revenue Share (%), by Country 2024 & 2032
- Figure 14: North America USA Insurtech Industry Volume Share (%), by Country 2024 & 2032
- Figure 15: South America USA Insurtech Industry Revenue (Million), by Business Model 2024 & 2032
- Figure 16: South America USA Insurtech Industry Volume (Billion), by Business Model 2024 & 2032
- Figure 17: South America USA Insurtech Industry Revenue Share (%), by Business Model 2024 & 2032
- Figure 18: South America USA Insurtech Industry Volume Share (%), by Business Model 2024 & 2032
- Figure 19: South America USA Insurtech Industry Revenue (Million), by Insurance Type 2024 & 2032
- Figure 20: South America USA Insurtech Industry Volume (Billion), by Insurance Type 2024 & 2032
- Figure 21: South America USA Insurtech Industry Revenue Share (%), by Insurance Type 2024 & 2032
- Figure 22: South America USA Insurtech Industry Volume Share (%), by Insurance Type 2024 & 2032
- Figure 23: South America USA Insurtech Industry Revenue (Million), by Country 2024 & 2032
- Figure 24: South America USA Insurtech Industry Volume (Billion), by Country 2024 & 2032
- Figure 25: South America USA Insurtech Industry Revenue Share (%), by Country 2024 & 2032
- Figure 26: South America USA Insurtech Industry Volume Share (%), by Country 2024 & 2032
- Figure 27: Europe USA Insurtech Industry Revenue (Million), by Business Model 2024 & 2032
- Figure 28: Europe USA Insurtech Industry Volume (Billion), by Business Model 2024 & 2032
- Figure 29: Europe USA Insurtech Industry Revenue Share (%), by Business Model 2024 & 2032
- Figure 30: Europe USA Insurtech Industry Volume Share (%), by Business Model 2024 & 2032
- Figure 31: Europe USA Insurtech Industry Revenue (Million), by Insurance Type 2024 & 2032
- Figure 32: Europe USA Insurtech Industry Volume (Billion), by Insurance Type 2024 & 2032
- Figure 33: Europe USA Insurtech Industry Revenue Share (%), by Insurance Type 2024 & 2032
- Figure 34: Europe USA Insurtech Industry Volume Share (%), by Insurance Type 2024 & 2032
- Figure 35: Europe USA Insurtech Industry Revenue (Million), by Country 2024 & 2032
- Figure 36: Europe USA Insurtech Industry Volume (Billion), by Country 2024 & 2032
- Figure 37: Europe USA Insurtech Industry Revenue Share (%), by Country 2024 & 2032
- Figure 38: Europe USA Insurtech Industry Volume Share (%), by Country 2024 & 2032
- Figure 39: Middle East & Africa USA Insurtech Industry Revenue (Million), by Business Model 2024 & 2032
- Figure 40: Middle East & Africa USA Insurtech Industry Volume (Billion), by Business Model 2024 & 2032
- Figure 41: Middle East & Africa USA Insurtech Industry Revenue Share (%), by Business Model 2024 & 2032
- Figure 42: Middle East & Africa USA Insurtech Industry Volume Share (%), by Business Model 2024 & 2032
- Figure 43: Middle East & Africa USA Insurtech Industry Revenue (Million), by Insurance Type 2024 & 2032
- Figure 44: Middle East & Africa USA Insurtech Industry Volume (Billion), by Insurance Type 2024 & 2032
- Figure 45: Middle East & Africa USA Insurtech Industry Revenue Share (%), by Insurance Type 2024 & 2032
- Figure 46: Middle East & Africa USA Insurtech Industry Volume Share (%), by Insurance Type 2024 & 2032
- Figure 47: Middle East & Africa USA Insurtech Industry Revenue (Million), by Country 2024 & 2032
- Figure 48: Middle East & Africa USA Insurtech Industry Volume (Billion), by Country 2024 & 2032
- Figure 49: Middle East & Africa USA Insurtech Industry Revenue Share (%), by Country 2024 & 2032
- Figure 50: Middle East & Africa USA Insurtech Industry Volume Share (%), by Country 2024 & 2032
- Figure 51: Asia Pacific USA Insurtech Industry Revenue (Million), by Business Model 2024 & 2032
- Figure 52: Asia Pacific USA Insurtech Industry Volume (Billion), by Business Model 2024 & 2032
- Figure 53: Asia Pacific USA Insurtech Industry Revenue Share (%), by Business Model 2024 & 2032
- Figure 54: Asia Pacific USA Insurtech Industry Volume Share (%), by Business Model 2024 & 2032
- Figure 55: Asia Pacific USA Insurtech Industry Revenue (Million), by Insurance Type 2024 & 2032
- Figure 56: Asia Pacific USA Insurtech Industry Volume (Billion), by Insurance Type 2024 & 2032
- Figure 57: Asia Pacific USA Insurtech Industry Revenue Share (%), by Insurance Type 2024 & 2032
- Figure 58: Asia Pacific USA Insurtech Industry Volume Share (%), by Insurance Type 2024 & 2032
- Figure 59: Asia Pacific USA Insurtech Industry Revenue (Million), by Country 2024 & 2032
- Figure 60: Asia Pacific USA Insurtech Industry Volume (Billion), by Country 2024 & 2032
- Figure 61: Asia Pacific USA Insurtech Industry Revenue Share (%), by Country 2024 & 2032
- Figure 62: Asia Pacific USA Insurtech Industry Volume Share (%), by Country 2024 & 2032
List of Tables
- Table 1: Global USA Insurtech Industry Revenue Million Forecast, by Region 2019 & 2032
- Table 2: Global USA Insurtech Industry Volume Billion Forecast, by Region 2019 & 2032
- Table 3: Global USA Insurtech Industry Revenue Million Forecast, by Business Model 2019 & 2032
- Table 4: Global USA Insurtech Industry Volume Billion Forecast, by Business Model 2019 & 2032
- Table 5: Global USA Insurtech Industry Revenue Million Forecast, by Insurance Type 2019 & 2032
- Table 6: Global USA Insurtech Industry Volume Billion Forecast, by Insurance Type 2019 & 2032
- Table 7: Global USA Insurtech Industry Revenue Million Forecast, by Region 2019 & 2032
- Table 8: Global USA Insurtech Industry Volume Billion Forecast, by Region 2019 & 2032
- Table 9: Global USA Insurtech Industry Revenue Million Forecast, by Business Model 2019 & 2032
- Table 10: Global USA Insurtech Industry Volume Billion Forecast, by Business Model 2019 & 2032
- Table 11: Global USA Insurtech Industry Revenue Million Forecast, by Insurance Type 2019 & 2032
- Table 12: Global USA Insurtech Industry Volume Billion Forecast, by Insurance Type 2019 & 2032
- Table 13: Global USA Insurtech Industry Revenue Million Forecast, by Country 2019 & 2032
- Table 14: Global USA Insurtech Industry Volume Billion Forecast, by Country 2019 & 2032
- Table 15: United States USA Insurtech Industry Revenue (Million) Forecast, by Application 2019 & 2032
- Table 16: United States USA Insurtech Industry Volume (Billion) Forecast, by Application 2019 & 2032
- Table 17: Canada USA Insurtech Industry Revenue (Million) Forecast, by Application 2019 & 2032
- Table 18: Canada USA Insurtech Industry Volume (Billion) Forecast, by Application 2019 & 2032
- Table 19: Mexico USA Insurtech Industry Revenue (Million) Forecast, by Application 2019 & 2032
- Table 20: Mexico USA Insurtech Industry Volume (Billion) Forecast, by Application 2019 & 2032
- Table 21: Global USA Insurtech Industry Revenue Million Forecast, by Business Model 2019 & 2032
- Table 22: Global USA Insurtech Industry Volume Billion Forecast, by Business Model 2019 & 2032
- Table 23: Global USA Insurtech Industry Revenue Million Forecast, by Insurance Type 2019 & 2032
- Table 24: Global USA Insurtech Industry Volume Billion Forecast, by Insurance Type 2019 & 2032
- Table 25: Global USA Insurtech Industry Revenue Million Forecast, by Country 2019 & 2032
- Table 26: Global USA Insurtech Industry Volume Billion Forecast, by Country 2019 & 2032
- Table 27: Brazil USA Insurtech Industry Revenue (Million) Forecast, by Application 2019 & 2032
- Table 28: Brazil USA Insurtech Industry Volume (Billion) Forecast, by Application 2019 & 2032
- Table 29: Argentina USA Insurtech Industry Revenue (Million) Forecast, by Application 2019 & 2032
- Table 30: Argentina USA Insurtech Industry Volume (Billion) Forecast, by Application 2019 & 2032
- Table 31: Rest of South America USA Insurtech Industry Revenue (Million) Forecast, by Application 2019 & 2032
- Table 32: Rest of South America USA Insurtech Industry Volume (Billion) Forecast, by Application 2019 & 2032
- Table 33: Global USA Insurtech Industry Revenue Million Forecast, by Business Model 2019 & 2032
- Table 34: Global USA Insurtech Industry Volume Billion Forecast, by Business Model 2019 & 2032
- Table 35: Global USA Insurtech Industry Revenue Million Forecast, by Insurance Type 2019 & 2032
- Table 36: Global USA Insurtech Industry Volume Billion Forecast, by Insurance Type 2019 & 2032
- Table 37: Global USA Insurtech Industry Revenue Million Forecast, by Country 2019 & 2032
- Table 38: Global USA Insurtech Industry Volume Billion Forecast, by Country 2019 & 2032
- Table 39: United Kingdom USA Insurtech Industry Revenue (Million) Forecast, by Application 2019 & 2032
- Table 40: United Kingdom USA Insurtech Industry Volume (Billion) Forecast, by Application 2019 & 2032
- Table 41: Germany USA Insurtech Industry Revenue (Million) Forecast, by Application 2019 & 2032
- Table 42: Germany USA Insurtech Industry Volume (Billion) Forecast, by Application 2019 & 2032
- Table 43: France USA Insurtech Industry Revenue (Million) Forecast, by Application 2019 & 2032
- Table 44: France USA Insurtech Industry Volume (Billion) Forecast, by Application 2019 & 2032
- Table 45: Italy USA Insurtech Industry Revenue (Million) Forecast, by Application 2019 & 2032
- Table 46: Italy USA Insurtech Industry Volume (Billion) Forecast, by Application 2019 & 2032
- Table 47: Spain USA Insurtech Industry Revenue (Million) Forecast, by Application 2019 & 2032
- Table 48: Spain USA Insurtech Industry Volume (Billion) Forecast, by Application 2019 & 2032
- Table 49: Russia USA Insurtech Industry Revenue (Million) Forecast, by Application 2019 & 2032
- Table 50: Russia USA Insurtech Industry Volume (Billion) Forecast, by Application 2019 & 2032
- Table 51: Benelux USA Insurtech Industry Revenue (Million) Forecast, by Application 2019 & 2032
- Table 52: Benelux USA Insurtech Industry Volume (Billion) Forecast, by Application 2019 & 2032
- Table 53: Nordics USA Insurtech Industry Revenue (Million) Forecast, by Application 2019 & 2032
- Table 54: Nordics USA Insurtech Industry Volume (Billion) Forecast, by Application 2019 & 2032
- Table 55: Rest of Europe USA Insurtech Industry Revenue (Million) Forecast, by Application 2019 & 2032
- Table 56: Rest of Europe USA Insurtech Industry Volume (Billion) Forecast, by Application 2019 & 2032
- Table 57: Global USA Insurtech Industry Revenue Million Forecast, by Business Model 2019 & 2032
- Table 58: Global USA Insurtech Industry Volume Billion Forecast, by Business Model 2019 & 2032
- Table 59: Global USA Insurtech Industry Revenue Million Forecast, by Insurance Type 2019 & 2032
- Table 60: Global USA Insurtech Industry Volume Billion Forecast, by Insurance Type 2019 & 2032
- Table 61: Global USA Insurtech Industry Revenue Million Forecast, by Country 2019 & 2032
- Table 62: Global USA Insurtech Industry Volume Billion Forecast, by Country 2019 & 2032
- Table 63: Turkey USA Insurtech Industry Revenue (Million) Forecast, by Application 2019 & 2032
- Table 64: Turkey USA Insurtech Industry Volume (Billion) Forecast, by Application 2019 & 2032
- Table 65: Israel USA Insurtech Industry Revenue (Million) Forecast, by Application 2019 & 2032
- Table 66: Israel USA Insurtech Industry Volume (Billion) Forecast, by Application 2019 & 2032
- Table 67: GCC USA Insurtech Industry Revenue (Million) Forecast, by Application 2019 & 2032
- Table 68: GCC USA Insurtech Industry Volume (Billion) Forecast, by Application 2019 & 2032
- Table 69: North Africa USA Insurtech Industry Revenue (Million) Forecast, by Application 2019 & 2032
- Table 70: North Africa USA Insurtech Industry Volume (Billion) Forecast, by Application 2019 & 2032
- Table 71: South Africa USA Insurtech Industry Revenue (Million) Forecast, by Application 2019 & 2032
- Table 72: South Africa USA Insurtech Industry Volume (Billion) Forecast, by Application 2019 & 2032
- Table 73: Rest of Middle East & Africa USA Insurtech Industry Revenue (Million) Forecast, by Application 2019 & 2032
- Table 74: Rest of Middle East & Africa USA Insurtech Industry Volume (Billion) Forecast, by Application 2019 & 2032
- Table 75: Global USA Insurtech Industry Revenue Million Forecast, by Business Model 2019 & 2032
- Table 76: Global USA Insurtech Industry Volume Billion Forecast, by Business Model 2019 & 2032
- Table 77: Global USA Insurtech Industry Revenue Million Forecast, by Insurance Type 2019 & 2032
- Table 78: Global USA Insurtech Industry Volume Billion Forecast, by Insurance Type 2019 & 2032
- Table 79: Global USA Insurtech Industry Revenue Million Forecast, by Country 2019 & 2032
- Table 80: Global USA Insurtech Industry Volume Billion Forecast, by Country 2019 & 2032
- Table 81: China USA Insurtech Industry Revenue (Million) Forecast, by Application 2019 & 2032
- Table 82: China USA Insurtech Industry Volume (Billion) Forecast, by Application 2019 & 2032
- Table 83: India USA Insurtech Industry Revenue (Million) Forecast, by Application 2019 & 2032
- Table 84: India USA Insurtech Industry Volume (Billion) Forecast, by Application 2019 & 2032
- Table 85: Japan USA Insurtech Industry Revenue (Million) Forecast, by Application 2019 & 2032
- Table 86: Japan USA Insurtech Industry Volume (Billion) Forecast, by Application 2019 & 2032
- Table 87: South Korea USA Insurtech Industry Revenue (Million) Forecast, by Application 2019 & 2032
- Table 88: South Korea USA Insurtech Industry Volume (Billion) Forecast, by Application 2019 & 2032
- Table 89: ASEAN USA Insurtech Industry Revenue (Million) Forecast, by Application 2019 & 2032
- Table 90: ASEAN USA Insurtech Industry Volume (Billion) Forecast, by Application 2019 & 2032
- Table 91: Oceania USA Insurtech Industry Revenue (Million) Forecast, by Application 2019 & 2032
- Table 92: Oceania USA Insurtech Industry Volume (Billion) Forecast, by Application 2019 & 2032
- Table 93: Rest of Asia Pacific USA Insurtech Industry Revenue (Million) Forecast, by Application 2019 & 2032
- Table 94: Rest of Asia Pacific USA Insurtech Industry Volume (Billion) Forecast, by Application 2019 & 2032
Frequently Asked Questions
1. What is the projected Compound Annual Growth Rate (CAGR) of the USA Insurtech Industry?
The projected CAGR is approximately > 6.00%.
2. Which companies are prominent players in the USA Insurtech Industry?
Key companies in the market include Gusto, Oscar, Bright Health, Clover Health, Root Insurance, American Well, Lemonade, Outsystems, Next Insurance, Metromile, Hippo**List Not Exhaustive.
3. What are the main segments of the USA Insurtech Industry?
The market segments include Business Model, Insurance Type.
4. Can you provide details about the market size?
The market size is estimated to be USD 49.82 Million as of 2022.
5. What are some drivers contributing to market growth?
Growing Demand for Data Analytics and Artificial Intelligence; Increasing Adoption of Digital Technologies.
6. What are the notable trends driving market growth?
Surged Funding towards Insurtech Companies.
7. Are there any restraints impacting market growth?
Growing Demand for Data Analytics and Artificial Intelligence; Increasing Adoption of Digital Technologies.
8. Can you provide examples of recent developments in the market?
March 2023: Duck Creek Technologies, the intelligent solutions provider defining the future of property and casualty (P&C) and general insurance acquired by Vista Equity Partners, a leading global investment firm.
9. What pricing options are available for accessing the report?
Pricing options include single-user, multi-user, and enterprise licenses priced at USD 3800, USD 4500, and USD 5800 respectively.
10. Is the market size provided in terms of value or volume?
The market size is provided in terms of value, measured in Million and volume, measured in Billion.
11. Are there any specific market keywords associated with the report?
Yes, the market keyword associated with the report is "USA Insurtech Industry," which aids in identifying and referencing the specific market segment covered.
12. How do I determine which pricing option suits my needs best?
The pricing options vary based on user requirements and access needs. Individual users may opt for single-user licenses, while businesses requiring broader access may choose multi-user or enterprise licenses for cost-effective access to the report.
13. Are there any additional resources or data provided in the USA Insurtech Industry report?
While the report offers comprehensive insights, it's advisable to review the specific contents or supplementary materials provided to ascertain if additional resources or data are available.
14. How can I stay updated on further developments or reports in the USA Insurtech Industry?
To stay informed about further developments, trends, and reports in the USA Insurtech Industry, consider subscribing to industry newsletters, following relevant companies and organizations, or regularly checking reputable industry news sources and publications.
Methodology
Step 1 - Identification of Relevant Samples Size from Population Database


Step 2 - Approaches for Defining Global Market Size (Value, Volume* & Price*)

Note*: In applicable scenarios
Step 3 - Data Sources
Primary Research
- Web Analytics
- Survey Reports
- Research Institute
- Latest Research Reports
- Opinion Leaders
Secondary Research
- Annual Reports
- White Paper
- Latest Press Release
- Industry Association
- Paid Database
- Investor Presentations

Step 4 - Data Triangulation
Involves using different sources of information in order to increase the validity of a study
These sources are likely to be stakeholders in a program - participants, other researchers, program staff, other community members, and so on.
Then we put all data in single framework & apply various statistical tools to find out the dynamic on the market.
During the analysis stage, feedback from the stakeholder groups would be compared to determine areas of agreement as well as areas of divergence
