

Key Insights
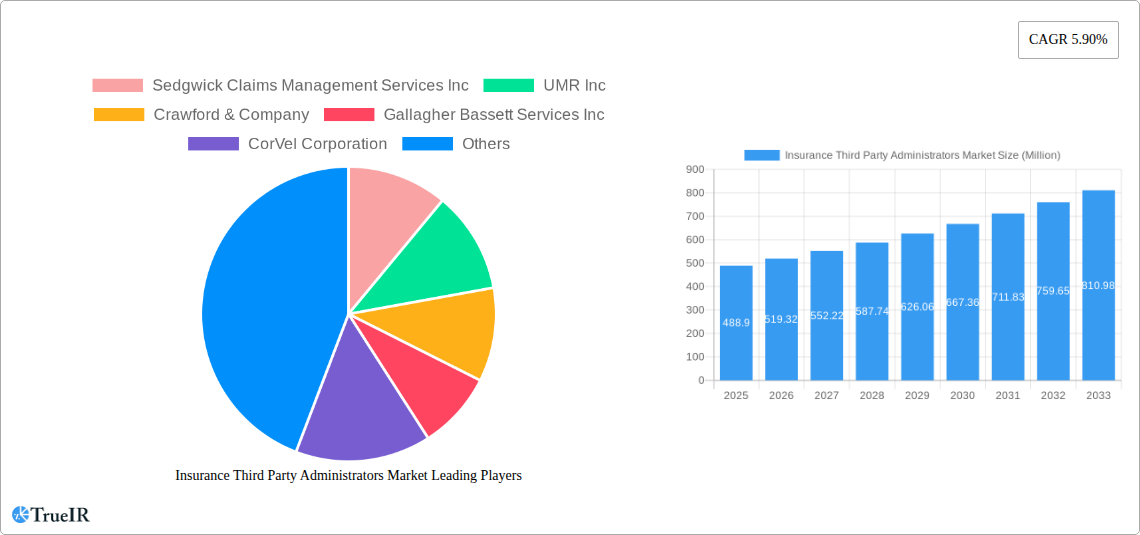
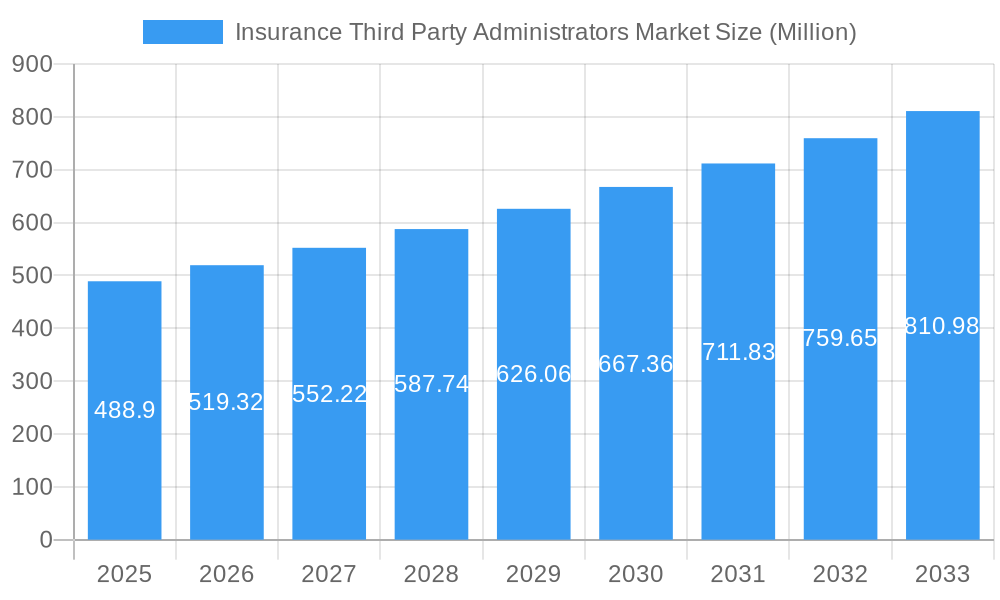
The Insurance Third Party Administrators (TPA) market, valued at $488.90 million in 2025, is projected to experience robust growth, driven by a compound annual growth rate (CAGR) of 5.90% from 2025 to 2033. This expansion is fueled by several key factors. The increasing complexity of insurance claims processing, coupled with the rising demand for cost-effective and efficient claims management solutions, is creating a significant opportunity for TPAs. Furthermore, the growing adoption of technology, including advanced analytics and automation, is streamlining operations and enhancing the accuracy and speed of claims processing. The shift towards value-based healthcare and the need for improved risk management are also contributing to market growth. Key players such as Sedgwick Claims Management Services Inc, UMR Inc, and Crawford & Company are leveraging these trends to consolidate their market share and expand their service offerings. The market is segmented based on service type (claims management, medical management, etc.), deployment type (on-premise, cloud-based), and end-user (health insurance, auto insurance, etc.), further contributing to the overall complexity and potential for growth.
Insurance Third Party Administrators Market Market Size (In Million)
Competition within the TPA market is intensifying, with established players facing challenges from smaller, agile companies that are specializing in niche areas and offering innovative solutions. However, the overall market outlook remains positive, with considerable potential for growth in both developed and emerging economies. Geographic expansion, strategic acquisitions, and technological advancements are expected to shape the market landscape in the coming years. The increasing emphasis on regulatory compliance and data security is also likely to influence the adoption of advanced technologies and services within the TPA sector. The market's future hinges on effectively addressing the evolving needs of insurers and healthcare providers, which is driving the growth of specialized TPA services and integrated solutions.
Insurance Third Party Administrators Market Company Market Share
Insurance Third Party Administrators Market: A Comprehensive Report (2019-2033)
This dynamic report provides a comprehensive analysis of the Insurance Third Party Administrators (TPA) market, offering invaluable insights for stakeholders seeking to navigate this rapidly evolving landscape. With a study period spanning 2019-2033, a base year of 2025, and a forecast period of 2025-2033, this report delivers crucial data and forecasts to inform strategic decision-making. The market size is projected to reach xx Million by 2033, exhibiting a robust CAGR of xx%.
Insurance Third Party Administrators Market Structure & Competitive Landscape
The Insurance TPA market exhibits a moderately concentrated structure, with key players like Sedgwick Claims Management Services Inc, UMR Inc, Crawford & Company, Gallagher Bassett Services Inc, CorVel Corporation, Helmsman Management Services LLC, ESIS Inc, Healthscope Benefits, and Maritain Health (list not exhaustive) vying for market share. The Herfindahl-Hirschman Index (HHI) for the market in 2024 is estimated at xx, indicating a moderately concentrated market. Innovation, primarily driven by technological advancements in claims processing and data analytics, significantly shapes the competitive dynamics. Stringent regulatory frameworks, particularly concerning data privacy and security, influence operational strategies. Substitutes, such as in-house claims management solutions, pose a competitive threat, although the specialized expertise and scalability offered by TPAs often outweigh these alternatives. End-user segmentation predominantly involves insurance providers (Property & Casualty, Health, Life), with varying needs driving differentiated TPA service offerings. The M&A activity in the market is steadily increasing, with xx major deals recorded between 2019 and 2024, a trend expected to continue due to market consolidation and the pursuit of enhanced market share. The average deal size is approximately xx Million. This trend also illustrates the growth of the market overall.
Insurance Third Party Administrators Market Trends & Opportunities
The Insurance TPA market demonstrates significant growth potential, driven by factors including the increasing complexity of insurance claims, the rising adoption of technology-driven solutions, and the growing demand for cost-effective claims management. Technological shifts, such as the incorporation of artificial intelligence (AI) and machine learning (ML) for faster and more accurate claims processing, are reshaping the industry. The market is currently experiencing a shift toward digitalization and automation, improving efficiency and reducing operational costs. Consumer preference is increasingly leaning toward TPAs offering comprehensive solutions, data-driven insights, and seamless integration with existing insurance systems. Competitive dynamics are intensifying with the emergence of new players leveraging innovative technologies. Market penetration rates are increasing steadily, particularly in developing economies where awareness of TPA services is rising. The overall market size is projected to grow from xx Million in 2024 to xx Million by 2033, representing a CAGR of xx%.
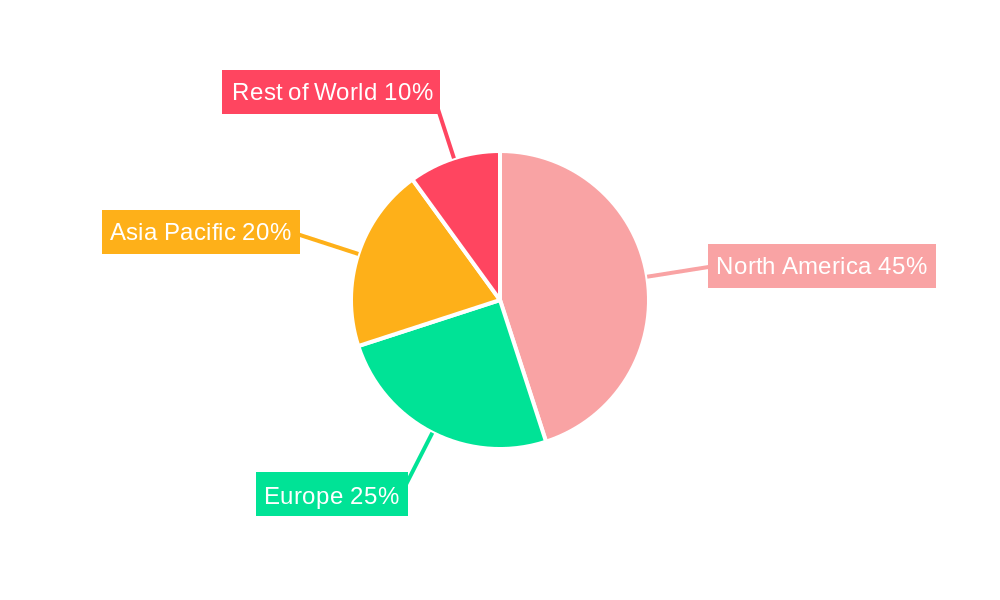
Dominant Markets & Segments in Insurance Third Party Administrators Market
The North American market currently holds the largest share of the global Insurance TPA market, driven by factors including advanced technology adoption and a mature insurance sector. Within North America, the United States maintains dominance due to its large insurance market and the availability of sophisticated TPA services.
- Key Growth Drivers in North America:
- Advanced technological infrastructure facilitating efficient claims processing.
- Robust regulatory environment supporting TPA operations.
- High insurance penetration rates within the region.
- Growing demand for outsourced claims management solutions among insurance providers.
- High per capita disposable income enabling higher insurance premium payouts.
Europe follows North America in market size, with significant growth potential in emerging economies such as India and China. However, regulatory complexities and infrastructure limitations in these regions present challenges for market penetration. The health insurance segment currently dominates the TPA market, owing to the complexity of health claims and the increasing demand for specialized TPA services.
Insurance Third Party Administrators Market Product Analysis
Product innovation within the Insurance TPA market is centered on leveraging technology to enhance efficiency and accuracy. Key offerings include sophisticated claims management software, advanced analytics platforms, and integrated solutions that streamline the entire claims process. Competitive advantages stem from delivering superior data security, compliance with regulatory requirements, and a seamless client experience. Technological advancements like AI-driven fraud detection and real-time claims tracking provide clear advantages, leading to improved customer satisfaction and cost reduction for insurance companies.
Key Drivers, Barriers & Challenges in Insurance Third Party Administrators Market
Key Drivers: The increasing complexity of insurance claims, coupled with the growing demand for cost-effective and efficient claims management, is a major driver of market growth. Technological advancements in AI, ML, and data analytics are significantly contributing to the market's expansion. Furthermore, favorable regulatory environments in several regions support the expansion of TPA services.
Key Barriers & Challenges: Regulatory hurdles and compliance requirements pose challenges, alongside the ongoing need for significant investments in technology and skilled personnel. Supply chain disruptions can affect operational efficiency, and intense competition from established players and emerging tech companies creates pressure on pricing and margins. The estimated cost of regulatory compliance for TPAs is approximately xx Million annually.
Growth Drivers in the Insurance Third Party Administrators Market
Technological advancements (AI, ML), increasing demand for efficient claims management, favorable regulatory environments in key markets, and the rising adoption of outsourced services fuel the growth of the Insurance TPA market.
Challenges Impacting Insurance Third Party Administrators Market Growth
Regulatory complexities, competition from established and emerging companies, and maintaining data security and compliance are significant challenges. Supply chain disruptions due to unforeseen circumstances, such as pandemics, also impact market growth.
Key Players Shaping the Insurance Third Party Administrators Market
- Sedgwick Claims Management Services Inc
- UMR Inc
- Crawford & Company
- Gallagher Bassett Services Inc
- CorVel Corporation
- Helmsman Management Services LLC
- ESIS Inc
- Healthscope Benefits
- Maritain Health
Significant Insurance Third Party Administrators Market Industry Milestones
- December 2022: Sedgwick established a new business unit focused on resource solutions for its UK insurance clients, enhancing its service offerings.
- March 2023: Medi Assist, a health insurance TPA, acquired Raksha Insurance, expanding its retail capabilities and market reach within India.
Future Outlook for Insurance Third Party Administrators Market
The Insurance TPA market is poised for sustained growth, driven by technological innovation, evolving consumer preferences, and increasing demand for efficient claims management solutions. Strategic partnerships and further expansion into emerging markets present significant opportunities for growth. The market is expected to continue to consolidate with further mergers and acquisitions.
Insurance Third Party Administrators Market Segmentation
-
1. Insurance Type
- 1.1. Healthcare Insurance
- 1.2. Retirement Plans
- 1.3. Commercial General Liability Insurance
- 1.4. Others Insurance Types (Motor Insurance)
Insurance Third Party Administrators Market Segmentation By Geography
-
1. North America
- 1.1. United States
- 1.2. Canada
-
2. Europe
- 2.1. United Kingdom
- 2.2. Germany
- 2.3. Rest of Europe
-
3. Asia Pacific
- 3.1. China
- 3.2. India
- 3.3. Rest of Asia Pacific
-
4. Middle East and Africa
- 4.1. United Arab Emirates
- 4.2. Saudi Arabia
- 4.3. Rest of Middle East and Africa
- 5. Rest of the World
Insurance Third Party Administrators Market Regional Market Share
Geographic Coverage of Insurance Third Party Administrators Market
Insurance Third Party Administrators Market REPORT HIGHLIGHTS
| Aspects | Details |
|---|---|
| Study Period | 2020-2034 |
| Base Year | 2025 |
| Estimated Year | 2026 |
| Forecast Period | 2026-2034 |
| Historical Period | 2020-2025 |
| Growth Rate | CAGR of 5.90% from 2020-2034 |
| Segmentation |
|
Table of Contents
- 1. Introduction
- 1.1. Research Scope
- 1.2. Market Segmentation
- 1.3. Research Objective
- 1.4. Definitions and Assumptions
- 2. Executive Summary
- 2.1. Market Snapshot
- 3. Market Dynamics
- 3.1. Market Drivers
- 3.2. Market Restrains
- 3.3. Market Trends
- 3.4. Market Opportunities
- 4. Market Factor Analysis
- 4.1. Porters Five Forces
- 4.1.1. Bargaining Power of Suppliers
- 4.1.2. Bargaining Power of Buyers
- 4.1.3. Threat of New Entrants
- 4.1.4. Threat of Substitutes
- 4.1.5. Competitive Rivalry
- 4.2. PESTEL analysis
- 4.3. BCG Analysis
- 4.3.1. Stars (High Growth, High Market Share)
- 4.3.2. Cash Cows (Low Growth, High Market Share)
- 4.3.3. Question Mark (High Growth, Low Market Share)
- 4.3.4. Dogs (Low Growth, Low Market Share)
- 4.4. Ansoff Matrix Analysis
- 4.5. Supply Chain Analysis
- 4.6. Regulatory Landscape
- 4.7. Current Market Potential and Opportunity Assessment (TAM–SAM–SOM Framework)
- 4.8. TIR Analyst Note
- 4.1. Porters Five Forces
- 5. Market Analysis, Insights and Forecast 2021-2033
- 5.1. Market Analysis, Insights and Forecast - by Insurance Type
- 5.1.1. Healthcare Insurance
- 5.1.2. Retirement Plans
- 5.1.3. Commercial General Liability Insurance
- 5.1.4. Others Insurance Types (Motor Insurance)
- 5.2. Market Analysis, Insights and Forecast - by Region
- 5.2.1. North America
- 5.2.2. Europe
- 5.2.3. Asia Pacific
- 5.2.4. Middle East and Africa
- 5.2.5. Rest of the World
- 5.1. Market Analysis, Insights and Forecast - by Insurance Type
- 6. Global Insurance Third Party Administrators Market Analysis, Insights and Forecast, 2021-2033
- 6.1. Market Analysis, Insights and Forecast - by Insurance Type
- 6.1.1. Healthcare Insurance
- 6.1.2. Retirement Plans
- 6.1.3. Commercial General Liability Insurance
- 6.1.4. Others Insurance Types (Motor Insurance)
- 6.1. Market Analysis, Insights and Forecast - by Insurance Type
- 7. North America Insurance Third Party Administrators Market Analysis, Insights and Forecast, 2020-2032
- 7.1. Market Analysis, Insights and Forecast - by Insurance Type
- 7.1.1. Healthcare Insurance
- 7.1.2. Retirement Plans
- 7.1.3. Commercial General Liability Insurance
- 7.1.4. Others Insurance Types (Motor Insurance)
- 7.1. Market Analysis, Insights and Forecast - by Insurance Type
- 8. Europe Insurance Third Party Administrators Market Analysis, Insights and Forecast, 2020-2032
- 8.1. Market Analysis, Insights and Forecast - by Insurance Type
- 8.1.1. Healthcare Insurance
- 8.1.2. Retirement Plans
- 8.1.3. Commercial General Liability Insurance
- 8.1.4. Others Insurance Types (Motor Insurance)
- 8.1. Market Analysis, Insights and Forecast - by Insurance Type
- 9. Asia Pacific Insurance Third Party Administrators Market Analysis, Insights and Forecast, 2020-2032
- 9.1. Market Analysis, Insights and Forecast - by Insurance Type
- 9.1.1. Healthcare Insurance
- 9.1.2. Retirement Plans
- 9.1.3. Commercial General Liability Insurance
- 9.1.4. Others Insurance Types (Motor Insurance)
- 9.1. Market Analysis, Insights and Forecast - by Insurance Type
- 10. Middle East and Africa Insurance Third Party Administrators Market Analysis, Insights and Forecast, 2020-2032
- 10.1. Market Analysis, Insights and Forecast - by Insurance Type
- 10.1.1. Healthcare Insurance
- 10.1.2. Retirement Plans
- 10.1.3. Commercial General Liability Insurance
- 10.1.4. Others Insurance Types (Motor Insurance)
- 10.1. Market Analysis, Insights and Forecast - by Insurance Type
- 11. Rest of the World Insurance Third Party Administrators Market Analysis, Insights and Forecast, 2020-2032
- 11.1. Market Analysis, Insights and Forecast - by Insurance Type
- 11.1.1. Healthcare Insurance
- 11.1.2. Retirement Plans
- 11.1.3. Commercial General Liability Insurance
- 11.1.4. Others Insurance Types (Motor Insurance)
- 11.1. Market Analysis, Insights and Forecast - by Insurance Type
- 12. Competitive Analysis
- 12.1. Company Profiles
- 12.1.1 Sedgwick Claims Management Services Inc
- 12.1.1.1. Company Overview
- 12.1.1.2. Products
- 12.1.1.3. Company Financials
- 12.1.1.4. SWOT Analysis
- 12.1.2 UMR Inc
- 12.1.2.1. Company Overview
- 12.1.2.2. Products
- 12.1.2.3. Company Financials
- 12.1.2.4. SWOT Analysis
- 12.1.3 Crawford & Company
- 12.1.3.1. Company Overview
- 12.1.3.2. Products
- 12.1.3.3. Company Financials
- 12.1.3.4. SWOT Analysis
- 12.1.4 Gallagher Bassett Services Inc
- 12.1.4.1. Company Overview
- 12.1.4.2. Products
- 12.1.4.3. Company Financials
- 12.1.4.4. SWOT Analysis
- 12.1.5 CorVel Corporation
- 12.1.5.1. Company Overview
- 12.1.5.2. Products
- 12.1.5.3. Company Financials
- 12.1.5.4. SWOT Analysis
- 12.1.6 Helmsman Management Services LLC
- 12.1.6.1. Company Overview
- 12.1.6.2. Products
- 12.1.6.3. Company Financials
- 12.1.6.4. SWOT Analysis
- 12.1.7 ESIS Inc
- 12.1.7.1. Company Overview
- 12.1.7.2. Products
- 12.1.7.3. Company Financials
- 12.1.7.4. SWOT Analysis
- 12.1.8 Healthscope Benefits
- 12.1.8.1. Company Overview
- 12.1.8.2. Products
- 12.1.8.3. Company Financials
- 12.1.8.4. SWOT Analysis
- 12.1.9 Maritain Health**List Not Exhaustive
- 12.1.9.1. Company Overview
- 12.1.9.2. Products
- 12.1.9.3. Company Financials
- 12.1.9.4. SWOT Analysis
- 12.1.1 Sedgwick Claims Management Services Inc
- 12.2. Market Entropy
- 12.2.1 Company's Key Areas Served
- 12.2.2 Recent Developments
- 12.3. Company Market Share Analysis 2025
- 12.3.1 Top 5 Companies Market Share Analysis
- 12.3.2 Top 3 Companies Market Share Analysis
- 12.4. List of Potential Customers
- 13. Research Methodology
List of Figures
- Figure 1: Global Insurance Third Party Administrators Market Revenue Breakdown (Million, %) by Region 2025 & 2033
- Figure 2: Global Insurance Third Party Administrators Market Volume Breakdown (Billion, %) by Region 2025 & 2033
- Figure 3: North America Insurance Third Party Administrators Market Revenue (Million), by Insurance Type 2025 & 2033
- Figure 4: North America Insurance Third Party Administrators Market Volume (Billion), by Insurance Type 2025 & 2033
- Figure 5: North America Insurance Third Party Administrators Market Revenue Share (%), by Insurance Type 2025 & 2033
- Figure 6: North America Insurance Third Party Administrators Market Volume Share (%), by Insurance Type 2025 & 2033
- Figure 7: North America Insurance Third Party Administrators Market Revenue (Million), by Country 2025 & 2033
- Figure 8: North America Insurance Third Party Administrators Market Volume (Billion), by Country 2025 & 2033
- Figure 9: North America Insurance Third Party Administrators Market Revenue Share (%), by Country 2025 & 2033
- Figure 10: North America Insurance Third Party Administrators Market Volume Share (%), by Country 2025 & 2033
- Figure 11: Europe Insurance Third Party Administrators Market Revenue (Million), by Insurance Type 2025 & 2033
- Figure 12: Europe Insurance Third Party Administrators Market Volume (Billion), by Insurance Type 2025 & 2033
- Figure 13: Europe Insurance Third Party Administrators Market Revenue Share (%), by Insurance Type 2025 & 2033
- Figure 14: Europe Insurance Third Party Administrators Market Volume Share (%), by Insurance Type 2025 & 2033
- Figure 15: Europe Insurance Third Party Administrators Market Revenue (Million), by Country 2025 & 2033
- Figure 16: Europe Insurance Third Party Administrators Market Volume (Billion), by Country 2025 & 2033
- Figure 17: Europe Insurance Third Party Administrators Market Revenue Share (%), by Country 2025 & 2033
- Figure 18: Europe Insurance Third Party Administrators Market Volume Share (%), by Country 2025 & 2033
- Figure 19: Asia Pacific Insurance Third Party Administrators Market Revenue (Million), by Insurance Type 2025 & 2033
- Figure 20: Asia Pacific Insurance Third Party Administrators Market Volume (Billion), by Insurance Type 2025 & 2033
- Figure 21: Asia Pacific Insurance Third Party Administrators Market Revenue Share (%), by Insurance Type 2025 & 2033
- Figure 22: Asia Pacific Insurance Third Party Administrators Market Volume Share (%), by Insurance Type 2025 & 2033
- Figure 23: Asia Pacific Insurance Third Party Administrators Market Revenue (Million), by Country 2025 & 2033
- Figure 24: Asia Pacific Insurance Third Party Administrators Market Volume (Billion), by Country 2025 & 2033
- Figure 25: Asia Pacific Insurance Third Party Administrators Market Revenue Share (%), by Country 2025 & 2033
- Figure 26: Asia Pacific Insurance Third Party Administrators Market Volume Share (%), by Country 2025 & 2033
- Figure 27: Middle East and Africa Insurance Third Party Administrators Market Revenue (Million), by Insurance Type 2025 & 2033
- Figure 28: Middle East and Africa Insurance Third Party Administrators Market Volume (Billion), by Insurance Type 2025 & 2033
- Figure 29: Middle East and Africa Insurance Third Party Administrators Market Revenue Share (%), by Insurance Type 2025 & 2033
- Figure 30: Middle East and Africa Insurance Third Party Administrators Market Volume Share (%), by Insurance Type 2025 & 2033
- Figure 31: Middle East and Africa Insurance Third Party Administrators Market Revenue (Million), by Country 2025 & 2033
- Figure 32: Middle East and Africa Insurance Third Party Administrators Market Volume (Billion), by Country 2025 & 2033
- Figure 33: Middle East and Africa Insurance Third Party Administrators Market Revenue Share (%), by Country 2025 & 2033
- Figure 34: Middle East and Africa Insurance Third Party Administrators Market Volume Share (%), by Country 2025 & 2033
- Figure 35: Rest of the World Insurance Third Party Administrators Market Revenue (Million), by Insurance Type 2025 & 2033
- Figure 36: Rest of the World Insurance Third Party Administrators Market Volume (Billion), by Insurance Type 2025 & 2033
- Figure 37: Rest of the World Insurance Third Party Administrators Market Revenue Share (%), by Insurance Type 2025 & 2033
- Figure 38: Rest of the World Insurance Third Party Administrators Market Volume Share (%), by Insurance Type 2025 & 2033
- Figure 39: Rest of the World Insurance Third Party Administrators Market Revenue (Million), by Country 2025 & 2033
- Figure 40: Rest of the World Insurance Third Party Administrators Market Volume (Billion), by Country 2025 & 2033
- Figure 41: Rest of the World Insurance Third Party Administrators Market Revenue Share (%), by Country 2025 & 2033
- Figure 42: Rest of the World Insurance Third Party Administrators Market Volume Share (%), by Country 2025 & 2033
List of Tables
- Table 1: Global Insurance Third Party Administrators Market Revenue Million Forecast, by Insurance Type 2020 & 2033
- Table 2: Global Insurance Third Party Administrators Market Volume Billion Forecast, by Insurance Type 2020 & 2033
- Table 3: Global Insurance Third Party Administrators Market Revenue Million Forecast, by Region 2020 & 2033
- Table 4: Global Insurance Third Party Administrators Market Volume Billion Forecast, by Region 2020 & 2033
- Table 5: Global Insurance Third Party Administrators Market Revenue Million Forecast, by Insurance Type 2020 & 2033
- Table 6: Global Insurance Third Party Administrators Market Volume Billion Forecast, by Insurance Type 2020 & 2033
- Table 7: Global Insurance Third Party Administrators Market Revenue Million Forecast, by Country 2020 & 2033
- Table 8: Global Insurance Third Party Administrators Market Volume Billion Forecast, by Country 2020 & 2033
- Table 9: United States Insurance Third Party Administrators Market Revenue (Million) Forecast, by Application 2020 & 2033
- Table 10: United States Insurance Third Party Administrators Market Volume (Billion) Forecast, by Application 2020 & 2033
- Table 11: Canada Insurance Third Party Administrators Market Revenue (Million) Forecast, by Application 2020 & 2033
- Table 12: Canada Insurance Third Party Administrators Market Volume (Billion) Forecast, by Application 2020 & 2033
- Table 13: Global Insurance Third Party Administrators Market Revenue Million Forecast, by Insurance Type 2020 & 2033
- Table 14: Global Insurance Third Party Administrators Market Volume Billion Forecast, by Insurance Type 2020 & 2033
- Table 15: Global Insurance Third Party Administrators Market Revenue Million Forecast, by Country 2020 & 2033
- Table 16: Global Insurance Third Party Administrators Market Volume Billion Forecast, by Country 2020 & 2033
- Table 17: United Kingdom Insurance Third Party Administrators Market Revenue (Million) Forecast, by Application 2020 & 2033
- Table 18: United Kingdom Insurance Third Party Administrators Market Volume (Billion) Forecast, by Application 2020 & 2033
- Table 19: Germany Insurance Third Party Administrators Market Revenue (Million) Forecast, by Application 2020 & 2033
- Table 20: Germany Insurance Third Party Administrators Market Volume (Billion) Forecast, by Application 2020 & 2033
- Table 21: Rest of Europe Insurance Third Party Administrators Market Revenue (Million) Forecast, by Application 2020 & 2033
- Table 22: Rest of Europe Insurance Third Party Administrators Market Volume (Billion) Forecast, by Application 2020 & 2033
- Table 23: Global Insurance Third Party Administrators Market Revenue Million Forecast, by Insurance Type 2020 & 2033
- Table 24: Global Insurance Third Party Administrators Market Volume Billion Forecast, by Insurance Type 2020 & 2033
- Table 25: Global Insurance Third Party Administrators Market Revenue Million Forecast, by Country 2020 & 2033
- Table 26: Global Insurance Third Party Administrators Market Volume Billion Forecast, by Country 2020 & 2033
- Table 27: China Insurance Third Party Administrators Market Revenue (Million) Forecast, by Application 2020 & 2033
- Table 28: China Insurance Third Party Administrators Market Volume (Billion) Forecast, by Application 2020 & 2033
- Table 29: India Insurance Third Party Administrators Market Revenue (Million) Forecast, by Application 2020 & 2033
- Table 30: India Insurance Third Party Administrators Market Volume (Billion) Forecast, by Application 2020 & 2033
- Table 31: Rest of Asia Pacific Insurance Third Party Administrators Market Revenue (Million) Forecast, by Application 2020 & 2033
- Table 32: Rest of Asia Pacific Insurance Third Party Administrators Market Volume (Billion) Forecast, by Application 2020 & 2033
- Table 33: Global Insurance Third Party Administrators Market Revenue Million Forecast, by Insurance Type 2020 & 2033
- Table 34: Global Insurance Third Party Administrators Market Volume Billion Forecast, by Insurance Type 2020 & 2033
- Table 35: Global Insurance Third Party Administrators Market Revenue Million Forecast, by Country 2020 & 2033
- Table 36: Global Insurance Third Party Administrators Market Volume Billion Forecast, by Country 2020 & 2033
- Table 37: United Arab Emirates Insurance Third Party Administrators Market Revenue (Million) Forecast, by Application 2020 & 2033
- Table 38: United Arab Emirates Insurance Third Party Administrators Market Volume (Billion) Forecast, by Application 2020 & 2033
- Table 39: Saudi Arabia Insurance Third Party Administrators Market Revenue (Million) Forecast, by Application 2020 & 2033
- Table 40: Saudi Arabia Insurance Third Party Administrators Market Volume (Billion) Forecast, by Application 2020 & 2033
- Table 41: Rest of Middle East and Africa Insurance Third Party Administrators Market Revenue (Million) Forecast, by Application 2020 & 2033
- Table 42: Rest of Middle East and Africa Insurance Third Party Administrators Market Volume (Billion) Forecast, by Application 2020 & 2033
- Table 43: Global Insurance Third Party Administrators Market Revenue Million Forecast, by Insurance Type 2020 & 2033
- Table 44: Global Insurance Third Party Administrators Market Volume Billion Forecast, by Insurance Type 2020 & 2033
- Table 45: Global Insurance Third Party Administrators Market Revenue Million Forecast, by Country 2020 & 2033
- Table 46: Global Insurance Third Party Administrators Market Volume Billion Forecast, by Country 2020 & 2033
Frequently Asked Questions
1. What is the projected Compound Annual Growth Rate (CAGR) of the Insurance Third Party Administrators Market?
The projected CAGR is approximately 5.90%.
2. Which companies are prominent players in the Insurance Third Party Administrators Market?
Key companies in the market include Sedgwick Claims Management Services Inc, UMR Inc, Crawford & Company, Gallagher Bassett Services Inc, CorVel Corporation, Helmsman Management Services LLC, ESIS Inc, Healthscope Benefits, Maritain Health**List Not Exhaustive.
3. What are the main segments of the Insurance Third Party Administrators Market?
The market segments include Insurance Type.
4. Can you provide details about the market size?
The market size is estimated to be USD 488.90 Million as of 2022.
5. What are some drivers contributing to market growth?
Increasing Demand for Cost Effective Healthcare Solutions; Rise in Digitalization and Automation is Driving the Market.
6. What are the notable trends driving market growth?
Increasing Healthcare Insurance TPAs is Fuelling the Market.
7. Are there any restraints impacting market growth?
Increasing Demand for Cost Effective Healthcare Solutions; Rise in Digitalization and Automation is Driving the Market.
8. Can you provide examples of recent developments in the market?
March 2023: To grow, Medi Assist, a third-party administrator for health insurance, acquired Raksha Insurance. Medi Assist, based in Bengaluru, will be able to increase significantly its retail capabilities and fortify its position in the nation's interior thanks to the agreement.December 2022: Sedgwick set up a new business unit focused on resource solutions for its insurance clients in the United Kingdom. Sedgwick's experience and technical expertise help clients with temporary and permanent placements across claims handling divisions.
9. What pricing options are available for accessing the report?
Pricing options include single-user, multi-user, and enterprise licenses priced at USD 4750, USD 5250, and USD 8750 respectively.
10. Is the market size provided in terms of value or volume?
The market size is provided in terms of value, measured in Million and volume, measured in Billion.
11. Are there any specific market keywords associated with the report?
Yes, the market keyword associated with the report is "Insurance Third Party Administrators Market," which aids in identifying and referencing the specific market segment covered.
12. How do I determine which pricing option suits my needs best?
The pricing options vary based on user requirements and access needs. Individual users may opt for single-user licenses, while businesses requiring broader access may choose multi-user or enterprise licenses for cost-effective access to the report.
13. Are there any additional resources or data provided in the Insurance Third Party Administrators Market report?
While the report offers comprehensive insights, it's advisable to review the specific contents or supplementary materials provided to ascertain if additional resources or data are available.
14. How can I stay updated on further developments or reports in the Insurance Third Party Administrators Market?
To stay informed about further developments, trends, and reports in the Insurance Third Party Administrators Market, consider subscribing to industry newsletters, following relevant companies and organizations, or regularly checking reputable industry news sources and publications.
Methodology
Step 1 - Identification of Relevant Samples Size from Population Database


Step 2 - Approaches for Defining Global Market Size (Value, Volume* & Price*)

Note*: In applicable scenarios
Step 3 - Data Sources
Primary Research
- Web Analytics
- Survey Reports
- Research Institute
- Latest Research Reports
- Opinion Leaders
Secondary Research
- Annual Reports
- White Paper
- Latest Press Release
- Industry Association
- Paid Database
- Investor Presentations

Step 4 - Data Triangulation
Involves using different sources of information in order to increase the validity of a study
These sources are likely to be stakeholders in a program - participants, other researchers, program staff, other community members, and so on.
Then we put all data in single framework & apply various statistical tools to find out the dynamic on the market.
During the analysis stage, feedback from the stakeholder groups would be compared to determine areas of agreement as well as areas of divergence