

Key Insights
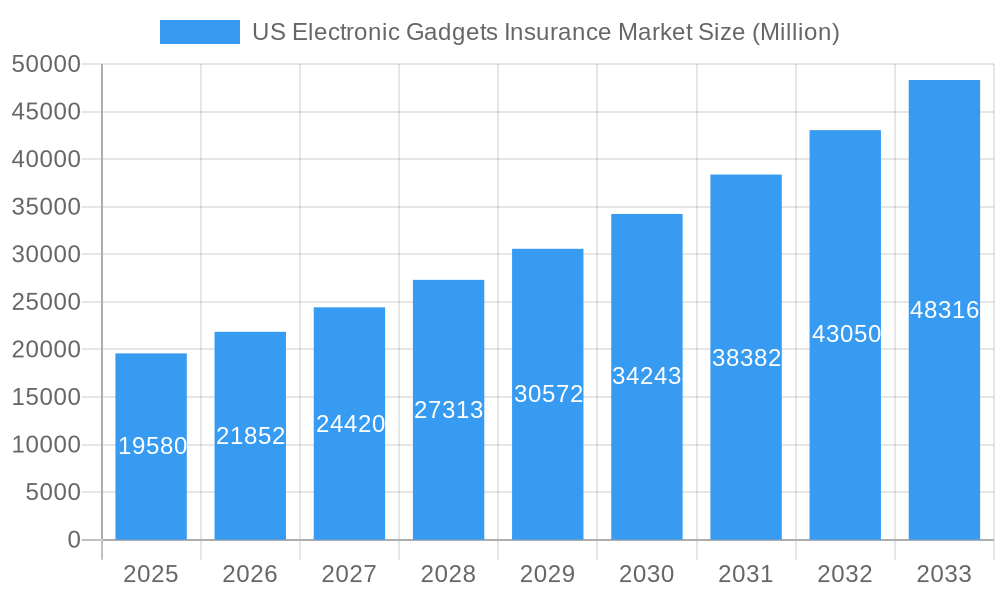
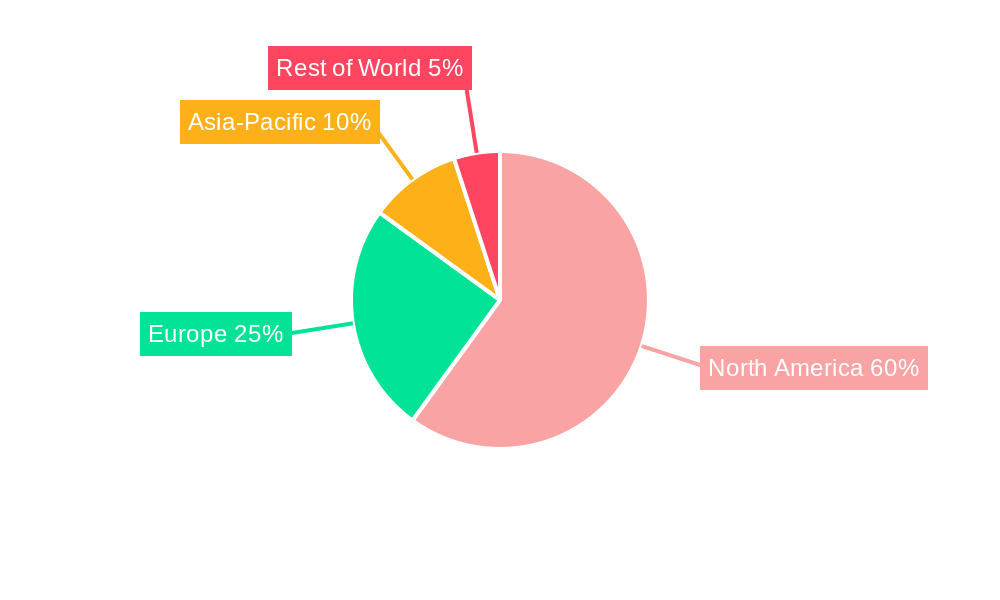
The US electronic gadgets insurance market is experiencing robust growth, projected to reach $19.58 billion in 2025 and maintain a Compound Annual Growth Rate (CAGR) of 11.54% from 2025 to 2033. This expansion is fueled by several key factors. The increasing reliance on electronic devices for both personal and professional use, coupled with rising device costs and a greater awareness of potential risks like accidental damage, theft, and loss, are driving demand for comprehensive insurance coverage. The market is segmented by coverage type (accidental damage, theft and loss), device type (laptops, computers, cameras, mobile devices, drones), and end-users (corporate, individual). The high value of modern electronics and the potential financial burden of replacement incentivize consumers and businesses to seek insurance protection. Furthermore, the growth of e-commerce and the increasing use of mobile payment methods have increased exposure to cyber threats and fraud, further stimulating demand for insurance solutions that address data breaches and online theft. The market's growth is likely to be further amplified by innovative insurance products and services designed to meet the evolving needs of consumers and businesses. Key players like AIG, Progressive, American Fidelity Assurance, Allianz Insurance, Aviva, AXA, Chubb, Assurant Inc, AT&T Inc, and Amica Mutual Insurance are actively shaping the market landscape through competitive offerings and strategic partnerships. The North American region, particularly the United States, currently dominates the market, although growth is expected across various geographical locations as adoption of electronic gadgets increases globally.
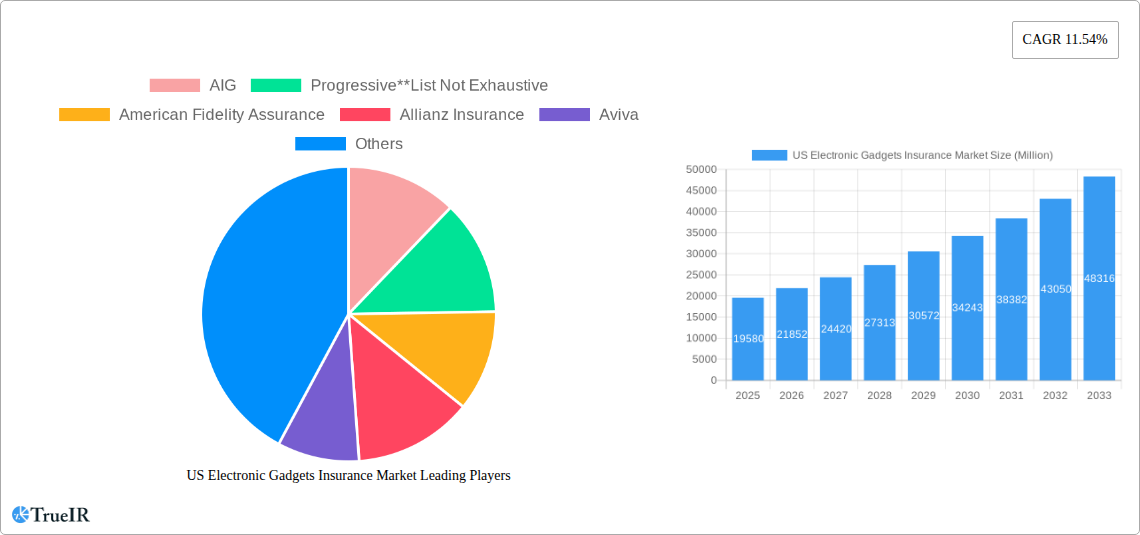
US Electronic Gadgets Insurance Market Market Size (In Billion)
The segment comprising mobile device insurance is projected to hold a significant market share, driven by the ubiquitous nature of smartphones and tablets. The corporate segment also presents substantial growth opportunities due to the high value and critical nature of electronic equipment used in businesses. However, factors such as the relatively low cost of replacing older devices and consumer perceptions of insurance costs as an additional expense could potentially act as restraints to market growth. Insurers are constantly innovating to address these challenges through flexible payment plans and bundled insurance packages that offer comprehensive coverage at competitive prices. The increasing adoption of smart home devices and the Internet of Things (IoT) is also expected to create new avenues for growth in the coming years, leading to a wider range of coverage options and increased market penetration.
US Electronic Gadgets Insurance Market Company Market Share
US Electronic Gadgets Insurance Market: A Comprehensive Report (2019-2033)
This dynamic report provides a detailed analysis of the US Electronic Gadgets Insurance Market, offering invaluable insights for industry stakeholders, investors, and strategists. Covering the period 2019-2033, with a focus on 2025, this research unravels market trends, competitive dynamics, and future growth potential. The report leverages extensive data analysis and expert insights to present a comprehensive overview of this rapidly evolving market. The US Electronic Gadgets Insurance Market is projected to reach xx Million by 2033, exhibiting a CAGR of xx% during the forecast period (2025-2033).
US Electronic Gadgets Insurance Market Market Structure & Competitive Landscape
The US electronic gadgets insurance market exhibits a moderately consolidated structure, with key players such as AIG, Progressive, American Fidelity Assurance, Allianz Insurance, Aviva, AXA, Chubb, Assurant Inc, AT&T Inc, and Amica Mutual Insurance vying for market share. The market concentration ratio (CR4) is estimated at xx%, indicating a presence of both large established players and smaller niche insurers. Innovation is a crucial driver, with companies constantly developing new products and services to cater to evolving consumer needs and technological advancements. Regulatory changes, particularly those related to data privacy and cybersecurity, significantly impact market operations. Product substitutes, such as extended warranties offered by manufacturers, pose a competitive challenge. The market is segmented by coverage type (Accidental Damage, Theft and Loss), device type (Laptops, Computers, Cameras, Mobile Devices, Drones), and end-users (Corporate, Individual). Mergers and acquisitions (M&A) activity has been moderate in recent years, with xx M&A deals recorded between 2019 and 2024, primarily driven by the need for market expansion and technological integration. This activity is expected to increase in the coming years as companies seek to consolidate their market position and expand their product offerings.
US Electronic Gadgets Insurance Market Market Trends & Opportunities
The US electronic gadgets insurance market is experiencing robust growth, fueled by increasing smartphone penetration, rising consumer electronics adoption, and the growing need for protection against device damage, theft, and loss. The market size is estimated at xx Million in 2025 and is projected to reach xx Million by 2033, reflecting a CAGR of xx%. Technological advancements, such as the Internet of Things (IoT) and the proliferation of smart devices, are creating new opportunities for insurers to offer innovative coverage solutions. Consumer preferences are shifting towards comprehensive insurance plans that offer broader coverage and value-added services. The competitive landscape is marked by intense rivalry among established players and the emergence of new entrants, driving innovation and pricing pressures. Market penetration rates for electronic gadgets insurance remain relatively low, indicating significant untapped potential for growth. The rising adoption of cloud-based insurance platforms and digital distribution channels is further driving market expansion.
Dominant Markets & Segments in US Electronic Gadgets Insurance Market
- Leading Region/Country: California, Texas, and New York are currently the leading states due to high population density and technology adoption.
- Leading Coverage Type: Accidental damage insurance holds the largest market share due to the higher frequency of accidental damage incidents compared to theft and loss.
- Leading Device Type: Mobile devices currently dominate the market segment, owing to their widespread use and susceptibility to damage and loss.
- Leading End-User Segment: The individual segment constitutes the major portion of the market, driven by the rising ownership of personal electronic devices.
Key Growth Drivers:
- Increasing disposable incomes and rising consumer spending on electronic gadgets.
- Growing awareness about the risks of electronic gadget damage, theft, and loss.
- Technological advancements leading to more sophisticated insurance products and services.
- Expansion of online and mobile insurance distribution channels.
The dominance of these segments reflects the high volume of electronic devices in use, high incidence of damage and loss, and the growing consumer awareness of insurance products.
US Electronic Gadgets Insurance Market Product Analysis
The market features a diverse range of products, from basic accidental damage coverage to comprehensive plans encompassing theft, loss, and extended warranties. Technological advancements are driving the development of innovative products, including AI-powered claims processing and wearable device tracking for improved risk assessment and fraud detection. These products are tailored to meet specific market needs, with customized options available for various device types and end-user segments. Insurers are increasingly focusing on providing a seamless customer experience through digital platforms and personalized services to gain a competitive edge.
Key Drivers, Barriers & Challenges in US Electronic Gadgets Insurance Market
Key Drivers:
- Increasing smartphone and other electronic gadget adoption, coupled with higher replacement costs.
- Growing consumer awareness of the need for electronic gadget insurance.
- Technological advancements in risk assessment, claims processing, and fraud detection.
Key Challenges:
- Intense competition among established and emerging players, leading to price wars.
- Regulatory uncertainties and evolving data privacy regulations.
- Supply chain disruptions impacting the availability of devices and replacement parts. This has resulted in an estimated xx% increase in claim processing times in the last year.
Growth Drivers in the US Electronic Gadgets Insurance Market Market
The market's expansion is fueled by increasing consumer spending on electronics, technological innovations leading to enhanced product offerings, and evolving regulatory landscapes facilitating the growth of the insurance sector. Government initiatives promoting digitalization and financial inclusion also support market growth.
Challenges Impacting US Electronic Gadgets Insurance Market Growth
Regulatory hurdles, primarily concerning data privacy and cybersecurity, coupled with supply chain disruptions influencing repair times and costs, are key challenges. Intense competition, resulting in price pressure, is also affecting market growth.
Key Players Shaping the US Electronic Gadgets Insurance Market Market
- AIG
- Progressive
- American Fidelity Assurance
- Allianz Insurance
- Aviva
- AXA
- Chubb
- Assurant Inc
- AT&T Inc
- Amica Mutual Insurance
Significant US Electronic Gadgets Insurance Market Industry Milestones
- October 2023: Bolttech and Allianz Partners launched insurance solutions for embedded devices and appliances in the US, expanding coverage to a wider range of electronic gadgets and appliances.
- February 2023: Moonrock Insurance and Apollo Insurance unveiled innovative drone insurance, catering to the growing demand for coverage in the drone industry, including non-standard operations such as BVLOS flights.
Future Outlook for US Electronic Gadgets Insurance Market Market
The US electronic gadgets insurance market is poised for continued growth, driven by sustained consumer electronics adoption, technological advancements, and the growing need for comprehensive device protection. Strategic partnerships, product diversification, and expansion into niche segments present significant opportunities for market players. The market is expected to maintain robust growth in the coming years, driven by the factors outlined above.
US Electronic Gadgets Insurance Market Segmentation
-
1. Coverage Type
- 1.1. Accidental Damage
- 1.2. Theft and Loss
-
2. Device Type
- 2.1. Laptops
- 2.2. Computers
- 2.3. Cameras
- 2.4. Mobile Devices
- 2.5. Drones
-
3. End Users
- 3.1. Corporate
- 3.2. Individual
US Electronic Gadgets Insurance Market Segmentation By Geography
-
1. North America
- 1.1. United States
- 1.2. Canada
- 1.3. Mexico
-
2. South America
- 2.1. Brazil
- 2.2. Argentina
- 2.3. Rest of South America
-
3. Europe
- 3.1. United Kingdom
- 3.2. Germany
- 3.3. France
- 3.4. Italy
- 3.5. Spain
- 3.6. Russia
- 3.7. Benelux
- 3.8. Nordics
- 3.9. Rest of Europe
-
4. Middle East & Africa
- 4.1. Turkey
- 4.2. Israel
- 4.3. GCC
- 4.4. North Africa
- 4.5. South Africa
- 4.6. Rest of Middle East & Africa
-
5. Asia Pacific
- 5.1. China
- 5.2. India
- 5.3. Japan
- 5.4. South Korea
- 5.5. ASEAN
- 5.6. Oceania
- 5.7. Rest of Asia Pacific
US Electronic Gadgets Insurance Market Regional Market Share
Geographic Coverage of US Electronic Gadgets Insurance Market
US Electronic Gadgets Insurance Market REPORT HIGHLIGHTS
| Aspects | Details |
|---|---|
| Study Period | 2020-2034 |
| Base Year | 2025 |
| Estimated Year | 2026 |
| Forecast Period | 2026-2034 |
| Historical Period | 2020-2025 |
| Growth Rate | CAGR of 11.54% from 2020-2034 |
| Segmentation |
|
Table of Contents
- 1. Introduction
- 1.1. Research Scope
- 1.2. Market Segmentation
- 1.3. Research Objective
- 1.4. Definitions and Assumptions
- 2. Executive Summary
- 2.1. Market Snapshot
- 3. Market Dynamics
- 3.1. Market Drivers
- 3.2. Market Restrains
- 3.3. Market Trends
- 3.4. Market Opportunities
- 4. Market Factor Analysis
- 4.1. Porters Five Forces
- 4.1.1. Bargaining Power of Suppliers
- 4.1.2. Bargaining Power of Buyers
- 4.1.3. Threat of New Entrants
- 4.1.4. Threat of Substitutes
- 4.1.5. Competitive Rivalry
- 4.2. PESTEL analysis
- 4.3. BCG Analysis
- 4.3.1. Stars (High Growth, High Market Share)
- 4.3.2. Cash Cows (Low Growth, High Market Share)
- 4.3.3. Question Mark (High Growth, Low Market Share)
- 4.3.4. Dogs (Low Growth, Low Market Share)
- 4.4. Ansoff Matrix Analysis
- 4.5. Supply Chain Analysis
- 4.6. Regulatory Landscape
- 4.7. Current Market Potential and Opportunity Assessment (TAM–SAM–SOM Framework)
- 4.8. TIR Analyst Note
- 4.1. Porters Five Forces
- 5. Market Analysis, Insights and Forecast 2021-2033
- 5.1. Market Analysis, Insights and Forecast - by Coverage Type
- 5.1.1. Accidental Damage
- 5.1.2. Theft and Loss
- 5.2. Market Analysis, Insights and Forecast - by Device Type
- 5.2.1. Laptops
- 5.2.2. Computers
- 5.2.3. Cameras
- 5.2.4. Mobile Devices
- 5.2.5. Drones
- 5.3. Market Analysis, Insights and Forecast - by End Users
- 5.3.1. Corporate
- 5.3.2. Individual
- 5.4. Market Analysis, Insights and Forecast - by Region
- 5.4.1. North America
- 5.4.2. South America
- 5.4.3. Europe
- 5.4.4. Middle East & Africa
- 5.4.5. Asia Pacific
- 5.1. Market Analysis, Insights and Forecast - by Coverage Type
- 6. Global US Electronic Gadgets Insurance Market Analysis, Insights and Forecast, 2021-2033
- 6.1. Market Analysis, Insights and Forecast - by Coverage Type
- 6.1.1. Accidental Damage
- 6.1.2. Theft and Loss
- 6.2. Market Analysis, Insights and Forecast - by Device Type
- 6.2.1. Laptops
- 6.2.2. Computers
- 6.2.3. Cameras
- 6.2.4. Mobile Devices
- 6.2.5. Drones
- 6.3. Market Analysis, Insights and Forecast - by End Users
- 6.3.1. Corporate
- 6.3.2. Individual
- 6.1. Market Analysis, Insights and Forecast - by Coverage Type
- 7. North America US Electronic Gadgets Insurance Market Analysis, Insights and Forecast, 2020-2032
- 7.1. Market Analysis, Insights and Forecast - by Coverage Type
- 7.1.1. Accidental Damage
- 7.1.2. Theft and Loss
- 7.2. Market Analysis, Insights and Forecast - by Device Type
- 7.2.1. Laptops
- 7.2.2. Computers
- 7.2.3. Cameras
- 7.2.4. Mobile Devices
- 7.2.5. Drones
- 7.3. Market Analysis, Insights and Forecast - by End Users
- 7.3.1. Corporate
- 7.3.2. Individual
- 7.1. Market Analysis, Insights and Forecast - by Coverage Type
- 8. South America US Electronic Gadgets Insurance Market Analysis, Insights and Forecast, 2020-2032
- 8.1. Market Analysis, Insights and Forecast - by Coverage Type
- 8.1.1. Accidental Damage
- 8.1.2. Theft and Loss
- 8.2. Market Analysis, Insights and Forecast - by Device Type
- 8.2.1. Laptops
- 8.2.2. Computers
- 8.2.3. Cameras
- 8.2.4. Mobile Devices
- 8.2.5. Drones
- 8.3. Market Analysis, Insights and Forecast - by End Users
- 8.3.1. Corporate
- 8.3.2. Individual
- 8.1. Market Analysis, Insights and Forecast - by Coverage Type
- 9. Europe US Electronic Gadgets Insurance Market Analysis, Insights and Forecast, 2020-2032
- 9.1. Market Analysis, Insights and Forecast - by Coverage Type
- 9.1.1. Accidental Damage
- 9.1.2. Theft and Loss
- 9.2. Market Analysis, Insights and Forecast - by Device Type
- 9.2.1. Laptops
- 9.2.2. Computers
- 9.2.3. Cameras
- 9.2.4. Mobile Devices
- 9.2.5. Drones
- 9.3. Market Analysis, Insights and Forecast - by End Users
- 9.3.1. Corporate
- 9.3.2. Individual
- 9.1. Market Analysis, Insights and Forecast - by Coverage Type
- 10. Middle East & Africa US Electronic Gadgets Insurance Market Analysis, Insights and Forecast, 2020-2032
- 10.1. Market Analysis, Insights and Forecast - by Coverage Type
- 10.1.1. Accidental Damage
- 10.1.2. Theft and Loss
- 10.2. Market Analysis, Insights and Forecast - by Device Type
- 10.2.1. Laptops
- 10.2.2. Computers
- 10.2.3. Cameras
- 10.2.4. Mobile Devices
- 10.2.5. Drones
- 10.3. Market Analysis, Insights and Forecast - by End Users
- 10.3.1. Corporate
- 10.3.2. Individual
- 10.1. Market Analysis, Insights and Forecast - by Coverage Type
- 11. Asia Pacific US Electronic Gadgets Insurance Market Analysis, Insights and Forecast, 2020-2032
- 11.1. Market Analysis, Insights and Forecast - by Coverage Type
- 11.1.1. Accidental Damage
- 11.1.2. Theft and Loss
- 11.2. Market Analysis, Insights and Forecast - by Device Type
- 11.2.1. Laptops
- 11.2.2. Computers
- 11.2.3. Cameras
- 11.2.4. Mobile Devices
- 11.2.5. Drones
- 11.3. Market Analysis, Insights and Forecast - by End Users
- 11.3.1. Corporate
- 11.3.2. Individual
- 11.1. Market Analysis, Insights and Forecast - by Coverage Type
- 12. Competitive Analysis
- 12.1. Company Profiles
- 12.1.1 AIG
- 12.1.1.1. Company Overview
- 12.1.1.2. Products
- 12.1.1.3. Company Financials
- 12.1.1.4. SWOT Analysis
- 12.1.2 Progressive**List Not Exhaustive
- 12.1.2.1. Company Overview
- 12.1.2.2. Products
- 12.1.2.3. Company Financials
- 12.1.2.4. SWOT Analysis
- 12.1.3 American Fidelity Assurance
- 12.1.3.1. Company Overview
- 12.1.3.2. Products
- 12.1.3.3. Company Financials
- 12.1.3.4. SWOT Analysis
- 12.1.4 Allianz Insurance
- 12.1.4.1. Company Overview
- 12.1.4.2. Products
- 12.1.4.3. Company Financials
- 12.1.4.4. SWOT Analysis
- 12.1.5 Aviva
- 12.1.5.1. Company Overview
- 12.1.5.2. Products
- 12.1.5.3. Company Financials
- 12.1.5.4. SWOT Analysis
- 12.1.6 AXA
- 12.1.6.1. Company Overview
- 12.1.6.2. Products
- 12.1.6.3. Company Financials
- 12.1.6.4. SWOT Analysis
- 12.1.7 Chubb
- 12.1.7.1. Company Overview
- 12.1.7.2. Products
- 12.1.7.3. Company Financials
- 12.1.7.4. SWOT Analysis
- 12.1.8 Assurant Inc
- 12.1.8.1. Company Overview
- 12.1.8.2. Products
- 12.1.8.3. Company Financials
- 12.1.8.4. SWOT Analysis
- 12.1.9 AT&T Inc
- 12.1.9.1. Company Overview
- 12.1.9.2. Products
- 12.1.9.3. Company Financials
- 12.1.9.4. SWOT Analysis
- 12.1.10 Amica Mutual Insurance
- 12.1.10.1. Company Overview
- 12.1.10.2. Products
- 12.1.10.3. Company Financials
- 12.1.10.4. SWOT Analysis
- 12.1.1 AIG
- 12.2. Market Entropy
- 12.2.1 Company's Key Areas Served
- 12.2.2 Recent Developments
- 12.3. Company Market Share Analysis 2025
- 12.3.1 Top 5 Companies Market Share Analysis
- 12.3.2 Top 3 Companies Market Share Analysis
- 12.4. List of Potential Customers
- 13. Research Methodology
List of Figures
- Figure 1: Global US Electronic Gadgets Insurance Market Revenue Breakdown (Million, %) by Region 2025 & 2033
- Figure 2: North America US Electronic Gadgets Insurance Market Revenue (Million), by Coverage Type 2025 & 2033
- Figure 3: North America US Electronic Gadgets Insurance Market Revenue Share (%), by Coverage Type 2025 & 2033
- Figure 4: North America US Electronic Gadgets Insurance Market Revenue (Million), by Device Type 2025 & 2033
- Figure 5: North America US Electronic Gadgets Insurance Market Revenue Share (%), by Device Type 2025 & 2033
- Figure 6: North America US Electronic Gadgets Insurance Market Revenue (Million), by End Users 2025 & 2033
- Figure 7: North America US Electronic Gadgets Insurance Market Revenue Share (%), by End Users 2025 & 2033
- Figure 8: North America US Electronic Gadgets Insurance Market Revenue (Million), by Country 2025 & 2033
- Figure 9: North America US Electronic Gadgets Insurance Market Revenue Share (%), by Country 2025 & 2033
- Figure 10: South America US Electronic Gadgets Insurance Market Revenue (Million), by Coverage Type 2025 & 2033
- Figure 11: South America US Electronic Gadgets Insurance Market Revenue Share (%), by Coverage Type 2025 & 2033
- Figure 12: South America US Electronic Gadgets Insurance Market Revenue (Million), by Device Type 2025 & 2033
- Figure 13: South America US Electronic Gadgets Insurance Market Revenue Share (%), by Device Type 2025 & 2033
- Figure 14: South America US Electronic Gadgets Insurance Market Revenue (Million), by End Users 2025 & 2033
- Figure 15: South America US Electronic Gadgets Insurance Market Revenue Share (%), by End Users 2025 & 2033
- Figure 16: South America US Electronic Gadgets Insurance Market Revenue (Million), by Country 2025 & 2033
- Figure 17: South America US Electronic Gadgets Insurance Market Revenue Share (%), by Country 2025 & 2033
- Figure 18: Europe US Electronic Gadgets Insurance Market Revenue (Million), by Coverage Type 2025 & 2033
- Figure 19: Europe US Electronic Gadgets Insurance Market Revenue Share (%), by Coverage Type 2025 & 2033
- Figure 20: Europe US Electronic Gadgets Insurance Market Revenue (Million), by Device Type 2025 & 2033
- Figure 21: Europe US Electronic Gadgets Insurance Market Revenue Share (%), by Device Type 2025 & 2033
- Figure 22: Europe US Electronic Gadgets Insurance Market Revenue (Million), by End Users 2025 & 2033
- Figure 23: Europe US Electronic Gadgets Insurance Market Revenue Share (%), by End Users 2025 & 2033
- Figure 24: Europe US Electronic Gadgets Insurance Market Revenue (Million), by Country 2025 & 2033
- Figure 25: Europe US Electronic Gadgets Insurance Market Revenue Share (%), by Country 2025 & 2033
- Figure 26: Middle East & Africa US Electronic Gadgets Insurance Market Revenue (Million), by Coverage Type 2025 & 2033
- Figure 27: Middle East & Africa US Electronic Gadgets Insurance Market Revenue Share (%), by Coverage Type 2025 & 2033
- Figure 28: Middle East & Africa US Electronic Gadgets Insurance Market Revenue (Million), by Device Type 2025 & 2033
- Figure 29: Middle East & Africa US Electronic Gadgets Insurance Market Revenue Share (%), by Device Type 2025 & 2033
- Figure 30: Middle East & Africa US Electronic Gadgets Insurance Market Revenue (Million), by End Users 2025 & 2033
- Figure 31: Middle East & Africa US Electronic Gadgets Insurance Market Revenue Share (%), by End Users 2025 & 2033
- Figure 32: Middle East & Africa US Electronic Gadgets Insurance Market Revenue (Million), by Country 2025 & 2033
- Figure 33: Middle East & Africa US Electronic Gadgets Insurance Market Revenue Share (%), by Country 2025 & 2033
- Figure 34: Asia Pacific US Electronic Gadgets Insurance Market Revenue (Million), by Coverage Type 2025 & 2033
- Figure 35: Asia Pacific US Electronic Gadgets Insurance Market Revenue Share (%), by Coverage Type 2025 & 2033
- Figure 36: Asia Pacific US Electronic Gadgets Insurance Market Revenue (Million), by Device Type 2025 & 2033
- Figure 37: Asia Pacific US Electronic Gadgets Insurance Market Revenue Share (%), by Device Type 2025 & 2033
- Figure 38: Asia Pacific US Electronic Gadgets Insurance Market Revenue (Million), by End Users 2025 & 2033
- Figure 39: Asia Pacific US Electronic Gadgets Insurance Market Revenue Share (%), by End Users 2025 & 2033
- Figure 40: Asia Pacific US Electronic Gadgets Insurance Market Revenue (Million), by Country 2025 & 2033
- Figure 41: Asia Pacific US Electronic Gadgets Insurance Market Revenue Share (%), by Country 2025 & 2033
List of Tables
- Table 1: Global US Electronic Gadgets Insurance Market Revenue Million Forecast, by Coverage Type 2020 & 2033
- Table 2: Global US Electronic Gadgets Insurance Market Revenue Million Forecast, by Device Type 2020 & 2033
- Table 3: Global US Electronic Gadgets Insurance Market Revenue Million Forecast, by End Users 2020 & 2033
- Table 4: Global US Electronic Gadgets Insurance Market Revenue Million Forecast, by Region 2020 & 2033
- Table 5: Global US Electronic Gadgets Insurance Market Revenue Million Forecast, by Coverage Type 2020 & 2033
- Table 6: Global US Electronic Gadgets Insurance Market Revenue Million Forecast, by Device Type 2020 & 2033
- Table 7: Global US Electronic Gadgets Insurance Market Revenue Million Forecast, by End Users 2020 & 2033
- Table 8: Global US Electronic Gadgets Insurance Market Revenue Million Forecast, by Country 2020 & 2033
- Table 9: United States US Electronic Gadgets Insurance Market Revenue (Million) Forecast, by Application 2020 & 2033
- Table 10: Canada US Electronic Gadgets Insurance Market Revenue (Million) Forecast, by Application 2020 & 2033
- Table 11: Mexico US Electronic Gadgets Insurance Market Revenue (Million) Forecast, by Application 2020 & 2033
- Table 12: Global US Electronic Gadgets Insurance Market Revenue Million Forecast, by Coverage Type 2020 & 2033
- Table 13: Global US Electronic Gadgets Insurance Market Revenue Million Forecast, by Device Type 2020 & 2033
- Table 14: Global US Electronic Gadgets Insurance Market Revenue Million Forecast, by End Users 2020 & 2033
- Table 15: Global US Electronic Gadgets Insurance Market Revenue Million Forecast, by Country 2020 & 2033
- Table 16: Brazil US Electronic Gadgets Insurance Market Revenue (Million) Forecast, by Application 2020 & 2033
- Table 17: Argentina US Electronic Gadgets Insurance Market Revenue (Million) Forecast, by Application 2020 & 2033
- Table 18: Rest of South America US Electronic Gadgets Insurance Market Revenue (Million) Forecast, by Application 2020 & 2033
- Table 19: Global US Electronic Gadgets Insurance Market Revenue Million Forecast, by Coverage Type 2020 & 2033
- Table 20: Global US Electronic Gadgets Insurance Market Revenue Million Forecast, by Device Type 2020 & 2033
- Table 21: Global US Electronic Gadgets Insurance Market Revenue Million Forecast, by End Users 2020 & 2033
- Table 22: Global US Electronic Gadgets Insurance Market Revenue Million Forecast, by Country 2020 & 2033
- Table 23: United Kingdom US Electronic Gadgets Insurance Market Revenue (Million) Forecast, by Application 2020 & 2033
- Table 24: Germany US Electronic Gadgets Insurance Market Revenue (Million) Forecast, by Application 2020 & 2033
- Table 25: France US Electronic Gadgets Insurance Market Revenue (Million) Forecast, by Application 2020 & 2033
- Table 26: Italy US Electronic Gadgets Insurance Market Revenue (Million) Forecast, by Application 2020 & 2033
- Table 27: Spain US Electronic Gadgets Insurance Market Revenue (Million) Forecast, by Application 2020 & 2033
- Table 28: Russia US Electronic Gadgets Insurance Market Revenue (Million) Forecast, by Application 2020 & 2033
- Table 29: Benelux US Electronic Gadgets Insurance Market Revenue (Million) Forecast, by Application 2020 & 2033
- Table 30: Nordics US Electronic Gadgets Insurance Market Revenue (Million) Forecast, by Application 2020 & 2033
- Table 31: Rest of Europe US Electronic Gadgets Insurance Market Revenue (Million) Forecast, by Application 2020 & 2033
- Table 32: Global US Electronic Gadgets Insurance Market Revenue Million Forecast, by Coverage Type 2020 & 2033
- Table 33: Global US Electronic Gadgets Insurance Market Revenue Million Forecast, by Device Type 2020 & 2033
- Table 34: Global US Electronic Gadgets Insurance Market Revenue Million Forecast, by End Users 2020 & 2033
- Table 35: Global US Electronic Gadgets Insurance Market Revenue Million Forecast, by Country 2020 & 2033
- Table 36: Turkey US Electronic Gadgets Insurance Market Revenue (Million) Forecast, by Application 2020 & 2033
- Table 37: Israel US Electronic Gadgets Insurance Market Revenue (Million) Forecast, by Application 2020 & 2033
- Table 38: GCC US Electronic Gadgets Insurance Market Revenue (Million) Forecast, by Application 2020 & 2033
- Table 39: North Africa US Electronic Gadgets Insurance Market Revenue (Million) Forecast, by Application 2020 & 2033
- Table 40: South Africa US Electronic Gadgets Insurance Market Revenue (Million) Forecast, by Application 2020 & 2033
- Table 41: Rest of Middle East & Africa US Electronic Gadgets Insurance Market Revenue (Million) Forecast, by Application 2020 & 2033
- Table 42: Global US Electronic Gadgets Insurance Market Revenue Million Forecast, by Coverage Type 2020 & 2033
- Table 43: Global US Electronic Gadgets Insurance Market Revenue Million Forecast, by Device Type 2020 & 2033
- Table 44: Global US Electronic Gadgets Insurance Market Revenue Million Forecast, by End Users 2020 & 2033
- Table 45: Global US Electronic Gadgets Insurance Market Revenue Million Forecast, by Country 2020 & 2033
- Table 46: China US Electronic Gadgets Insurance Market Revenue (Million) Forecast, by Application 2020 & 2033
- Table 47: India US Electronic Gadgets Insurance Market Revenue (Million) Forecast, by Application 2020 & 2033
- Table 48: Japan US Electronic Gadgets Insurance Market Revenue (Million) Forecast, by Application 2020 & 2033
- Table 49: South Korea US Electronic Gadgets Insurance Market Revenue (Million) Forecast, by Application 2020 & 2033
- Table 50: ASEAN US Electronic Gadgets Insurance Market Revenue (Million) Forecast, by Application 2020 & 2033
- Table 51: Oceania US Electronic Gadgets Insurance Market Revenue (Million) Forecast, by Application 2020 & 2033
- Table 52: Rest of Asia Pacific US Electronic Gadgets Insurance Market Revenue (Million) Forecast, by Application 2020 & 2033
Frequently Asked Questions
1. What is the projected Compound Annual Growth Rate (CAGR) of the US Electronic Gadgets Insurance Market?
The projected CAGR is approximately 11.54%.
2. Which companies are prominent players in the US Electronic Gadgets Insurance Market?
Key companies in the market include AIG, Progressive**List Not Exhaustive, American Fidelity Assurance, Allianz Insurance, Aviva, AXA, Chubb, Assurant Inc, AT&T Inc, Amica Mutual Insurance.
3. What are the main segments of the US Electronic Gadgets Insurance Market?
The market segments include Coverage Type, Device Type, End Users.
4. Can you provide details about the market size?
The market size is estimated to be USD 19.58 Million as of 2022.
5. What are some drivers contributing to market growth?
Increse in Consumer spending for Electronic gadgets.; Rising living living standard of the the people.
6. What are the notable trends driving market growth?
Increase In Demand For Electronic Gadget Post Pandemic.
7. Are there any restraints impacting market growth?
Fluctuation in price of electronic gadgets raw material.; Fragmented market in electronic gadgets insurance business.
8. Can you provide examples of recent developments in the market?
In October 2023, Bolttech and Allianz Partners partnered to launch insurance solutions for embedded devices and appliances in the United States.
9. What pricing options are available for accessing the report?
Pricing options include single-user, multi-user, and enterprise licenses priced at USD 3800, USD 4500, and USD 5800 respectively.
10. Is the market size provided in terms of value or volume?
The market size is provided in terms of value, measured in Million.
11. Are there any specific market keywords associated with the report?
Yes, the market keyword associated with the report is "US Electronic Gadgets Insurance Market," which aids in identifying and referencing the specific market segment covered.
12. How do I determine which pricing option suits my needs best?
The pricing options vary based on user requirements and access needs. Individual users may opt for single-user licenses, while businesses requiring broader access may choose multi-user or enterprise licenses for cost-effective access to the report.
13. Are there any additional resources or data provided in the US Electronic Gadgets Insurance Market report?
While the report offers comprehensive insights, it's advisable to review the specific contents or supplementary materials provided to ascertain if additional resources or data are available.
14. How can I stay updated on further developments or reports in the US Electronic Gadgets Insurance Market?
To stay informed about further developments, trends, and reports in the US Electronic Gadgets Insurance Market, consider subscribing to industry newsletters, following relevant companies and organizations, or regularly checking reputable industry news sources and publications.
Methodology
Step 1 - Identification of Relevant Samples Size from Population Database


Step 2 - Approaches for Defining Global Market Size (Value, Volume* & Price*)

Note*: In applicable scenarios
Step 3 - Data Sources
Primary Research
- Web Analytics
- Survey Reports
- Research Institute
- Latest Research Reports
- Opinion Leaders
Secondary Research
- Annual Reports
- White Paper
- Latest Press Release
- Industry Association
- Paid Database
- Investor Presentations

Step 4 - Data Triangulation
Involves using different sources of information in order to increase the validity of a study
These sources are likely to be stakeholders in a program - participants, other researchers, program staff, other community members, and so on.
Then we put all data in single framework & apply various statistical tools to find out the dynamic on the market.
During the analysis stage, feedback from the stakeholder groups would be compared to determine areas of agreement as well as areas of divergence