

Key Insights
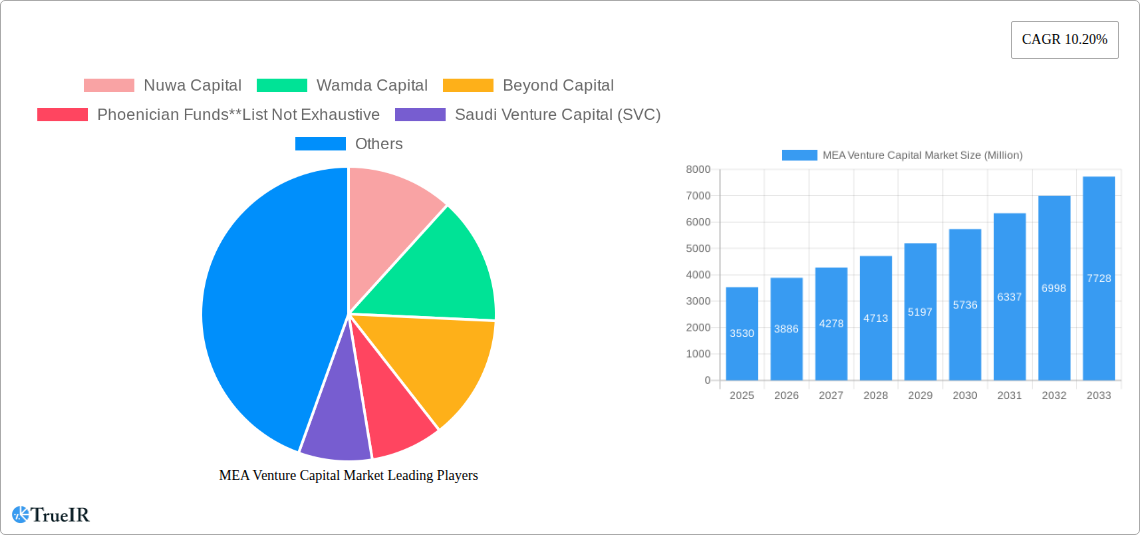
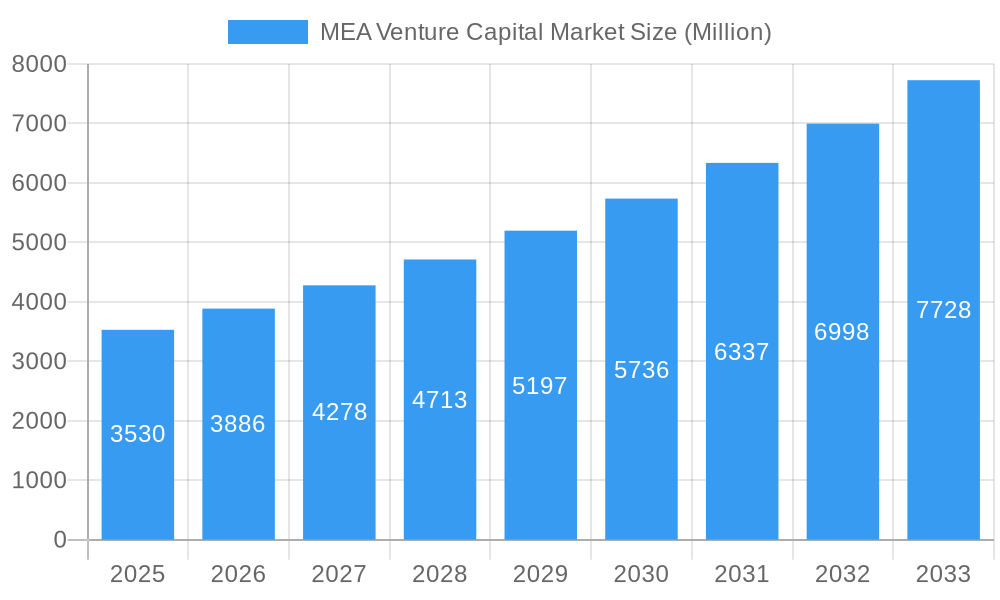
The Middle East and Africa (MEA) venture capital market exhibits robust growth, projected to reach \$3.53 billion in 2025 and maintain a Compound Annual Growth Rate (CAGR) of 10.20% from 2025 to 2033. This expansion is fueled by several key drivers. Firstly, burgeoning entrepreneurial ecosystems in countries like the UAE, Saudi Arabia, and South Africa are fostering innovation and attracting significant investment. Government initiatives promoting digital transformation and diversification of national economies are further incentivizing VC activity. Secondly, the increasing availability of high-growth potential startups across diverse sectors—including real estate, fintech, food & beverage, healthcare, and technology—provides ample investment opportunities for both local and international investors. Finally, a growing pool of experienced venture capital firms, both regional and international (such as Nuwa Capital, Wamda Capital, and Global Ventures), is actively deploying capital, fostering competition and driving deal flow. The market's segmentation reflects this diversity, with significant investment across various industries.
MEA Venture Capital Market Market Size (In Billion)
However, the MEA VC market also faces challenges. Regulatory hurdles, inconsistent access to funding for early-stage companies, and a relatively nascent startup ecosystem in certain MEA countries pose potential constraints. Furthermore, macroeconomic volatility and geopolitical uncertainty within the region can influence investor sentiment and investment decisions. Despite these challenges, the long-term outlook remains positive, given the region’s young and growing population, rising digital adoption, and government support for innovation. The continued growth is expected to be driven by a combination of factors, including further government support for entrepreneurship, an increase in the number of high-growth startups, and increased participation of international venture capital firms in the region. The forecast period (2025-2033) suggests a considerable expansion, with opportunities likely concentrated in the UAE, Saudi Arabia, and South Africa, followed by other emerging markets within MEA.
MEA Venture Capital Market Company Market Share
MEA Venture Capital Market: A Comprehensive Report (2019-2033)
This dynamic report provides a detailed analysis of the Middle East and Africa (MEA) Venture Capital market, offering invaluable insights for investors, entrepreneurs, and industry stakeholders. Covering the period from 2019 to 2033, with a focus on 2025, this study meticulously examines market structure, competitive dynamics, growth drivers, and future trends. Leveraging extensive research and data analysis, the report equips you with the knowledge needed to navigate this rapidly evolving landscape.
MEA Venture Capital Market Market Structure & Competitive Landscape
This section delves into the MEA venture capital market's structure, analyzing market concentration, innovation, regulatory impacts, and competitive dynamics. We examine the competitive landscape, identifying key players and analyzing their market share. The report also explores mergers and acquisitions (M&A) trends, providing quantitative data on M&A volumes and qualitative insights into driving forces. The level of market concentration will be assessed using concentration ratios (e.g., CR4, CR8), highlighting the dominance of specific players and the overall competitiveness of the market. We will also analyze the impact of regulatory frameworks, analyzing their effect on market entry, investment decisions, and overall market growth. Innovation drivers, such as technological advancements and entrepreneurial activity, will be examined, and the potential impact of substitute products and services will be considered. Finally, end-user segmentation will be explored to understand the diverse needs and preferences of different investor types within the MEA region. We estimate the CR4 for the MEA Venture Capital market in 2025 to be xx%. The total M&A volume in the MEA Venture Capital market from 2019 to 2024 is estimated at xx Million USD.
- Market Concentration: Analysis of concentration ratios (CR4, CR8) and market share distribution.
- Innovation Drivers: Exploration of technological advancements, entrepreneurial ecosystems, and government initiatives.
- Regulatory Impacts: Evaluation of regulations influencing investment flows and market activity.
- Product Substitutes: Assessment of alternative investment options and their impact on market share.
- End-User Segmentation: Analysis of investor types (e.g., angel investors, institutional investors) and their investment strategies.
- M&A Trends: Examination of M&A activity, volumes, and their implications for market consolidation.
MEA Venture Capital Market Market Trends & Opportunities
This section analyzes the key trends and opportunities shaping the MEA venture capital market. We'll examine market size and growth, projecting the Compound Annual Growth Rate (CAGR) for the forecast period (2025-2033). Technological shifts, such as the rise of fintech and digital transformation, will be explored, alongside their impact on investment patterns and market opportunities. Changing consumer preferences, evolving investment strategies, and emerging market segments will be analyzed. Finally, we'll dissect the competitive dynamics, including the strategies of key players and the emergence of new entrants. The estimated market size of the MEA Venture Capital market in 2025 is xx Million USD, with a projected CAGR of xx% from 2025 to 2033. Market penetration rate in key segments will also be analyzed.
Dominant Markets & Segments in MEA Venture Capital Market
This section pinpoints the leading regions, countries, and segments within the MEA venture capital market. We analyze performance by investor type (Local vs. International) and by industry sector (Real Estate, Financial Services, Food & Beverage, Healthcare, Transport and Logistics, IT and ITeS, Education, Other Industries). Key growth drivers for each dominant segment will be identified and analyzed.
- By Type:
- Local Investors: Analysis of investment patterns, preferred sectors, and impact on market growth.
- International Investors: Assessment of investment strategies, geographical focus, and contribution to market expansion.
- By Industry:
- IT and ITeS: Analysis of growth drivers such as digital transformation and technological advancements.
- Financial Services: Evaluation of the impact of fintech innovations and regulatory changes.
- Healthcare: Examination of the growth potential driven by rising healthcare expenditure and technological disruption.
- Other Industries: Analysis of investment trends in diverse sectors, including energy, and their growth prospects.
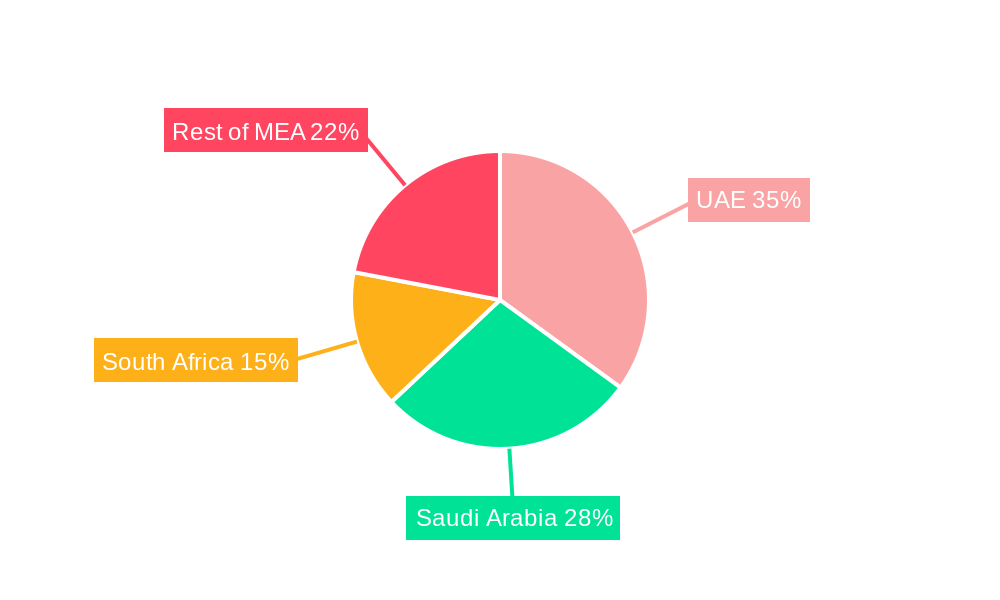
The UAE and Saudi Arabia are projected as the dominant markets in 2025 due to factors such as robust government support, favorable regulatory frameworks, and a thriving entrepreneurial ecosystem.
MEA Venture Capital Market Product Analysis
This section briefly summarizes product innovations, applications, and competitive advantages within the MEA venture capital market. We will highlight technological advancements that are transforming the investment landscape and analyze the market fit of new products and services. The focus will be on efficiency improvements, risk management tools, and data analytics solutions.
Key Drivers, Barriers & Challenges in MEA Venture Capital Market
This section outlines the key factors driving market growth and the challenges hindering its expansion.
Key Drivers:
- Government initiatives and supportive policies: Incentives and regulations promoting investments.
- Technological advancements: Fintech innovations and digital transformation enhancing investment processes.
- Growing entrepreneurial activity: A surge in startups and innovative businesses creating investment opportunities.
Challenges and Restraints:
- Regulatory complexities: Bureaucratic hurdles and inconsistent regulatory frameworks.
- Supply chain disruptions: Global economic instability affecting investment flows.
- Competitive pressures: Intense competition among venture capitalists for promising investment opportunities. A quantified impact of these challenges on market growth will be provided.
Growth Drivers in the MEA Venture Capital Market Market
This section reiterates the key drivers discussed previously, emphasizing their significance for future market growth. We will focus on the continued role of government support, advancements in technology driving efficiency and access, and the evolving entrepreneurial landscape with emphasis on the growing number of scalable businesses.
Challenges Impacting MEA Venture Capital Market Growth
This section reiterates the key challenges discussed previously, stressing their potential impact on future growth, specifically the need for regulatory harmonization to attract further investment, the mitigation of supply chain risks to ensure a stable investment climate and the need for strategies to address competitive pressures through specialization and unique value propositions.
Key Players Shaping the MEA Venture Capital Market Market
- Nuwa Capital
- Wamda Capital
- Beyond Capital
- Phoenician Funds
- Saudi Venture Capital (SVC)
- Falt6Labs Bahrain
- Global ventures
- Vision Ventures
- Algebra Ventures
- 500 Startups
Significant MEA Venture Capital Market Industry Milestones
- February 2023: Saudi Venture Capital Investment Company launches a USD 1 Million income growth fund (SVC Sukuk Fund). This highlights growing interest in Sharia-compliant investment options.
- February 2023: Flat6Labs completes the first close of its USD 20 Million 'Startup Seed Fund' in Saudi Arabia, with participation from the Saudi Venture Capital Company (SVC) and the Jada Fund of Funds (PIF). This demonstrates the increasing collaboration between public and private entities to boost the startup ecosystem.
Future Outlook for MEA Venture Capital Market Market
The MEA venture capital market is poised for significant growth, driven by a confluence of factors. Continued government support, technological advancements, and a burgeoning entrepreneurial landscape present substantial opportunities. Strategic investments in emerging sectors like fintech, e-commerce, and renewable energy will play a crucial role in shaping the market’s trajectory. The market is expected to experience sustained growth, driven by the increased participation of both local and international investors. Addressing the challenges outlined will be crucial to unlocking the market's full potential.
MEA Venture Capital Market Segmentation
-
1. Type
- 1.1. Local Investors
- 1.2. International Investors
-
2. Industry
- 2.1. Real Estate
- 2.2. Financial Services
- 2.3. Food & Beverage
- 2.4. Healthcare
- 2.5. Transport and Logistics
- 2.6. IT and ITeS
- 2.7. Education
- 2.8. Other Industries (Energy, etc.)
MEA Venture Capital Market Segmentation By Geography
-
1. North America
- 1.1. United States
- 1.2. Canada
- 1.3. Mexico
-
2. South America
- 2.1. Brazil
- 2.2. Argentina
- 2.3. Rest of South America
-
3. Europe
- 3.1. United Kingdom
- 3.2. Germany
- 3.3. France
- 3.4. Italy
- 3.5. Spain
- 3.6. Russia
- 3.7. Benelux
- 3.8. Nordics
- 3.9. Rest of Europe
-
4. Middle East & Africa
- 4.1. Turkey
- 4.2. Israel
- 4.3. GCC
- 4.4. North Africa
- 4.5. South Africa
- 4.6. Rest of Middle East & Africa
-
5. Asia Pacific
- 5.1. China
- 5.2. India
- 5.3. Japan
- 5.4. South Korea
- 5.5. ASEAN
- 5.6. Oceania
- 5.7. Rest of Asia Pacific
MEA Venture Capital Market Regional Market Share
Geographic Coverage of MEA Venture Capital Market
MEA Venture Capital Market REPORT HIGHLIGHTS
| Aspects | Details |
|---|---|
| Study Period | 2020-2034 |
| Base Year | 2025 |
| Estimated Year | 2026 |
| Forecast Period | 2026-2034 |
| Historical Period | 2020-2025 |
| Growth Rate | CAGR of 10.20% from 2020-2034 |
| Segmentation |
|
Table of Contents
- 1. Introduction
- 1.1. Research Scope
- 1.2. Market Segmentation
- 1.3. Research Objective
- 1.4. Definitions and Assumptions
- 2. Executive Summary
- 2.1. Market Snapshot
- 3. Market Dynamics
- 3.1. Market Drivers
- 3.2. Market Restrains
- 3.3. Market Trends
- 3.4. Market Opportunities
- 4. Market Factor Analysis
- 4.1. Porters Five Forces
- 4.1.1. Bargaining Power of Suppliers
- 4.1.2. Bargaining Power of Buyers
- 4.1.3. Threat of New Entrants
- 4.1.4. Threat of Substitutes
- 4.1.5. Competitive Rivalry
- 4.2. PESTEL analysis
- 4.3. BCG Analysis
- 4.3.1. Stars (High Growth, High Market Share)
- 4.3.2. Cash Cows (Low Growth, High Market Share)
- 4.3.3. Question Mark (High Growth, Low Market Share)
- 4.3.4. Dogs (Low Growth, Low Market Share)
- 4.4. Ansoff Matrix Analysis
- 4.5. Supply Chain Analysis
- 4.6. Regulatory Landscape
- 4.7. Current Market Potential and Opportunity Assessment (TAM–SAM–SOM Framework)
- 4.8. TIR Analyst Note
- 4.1. Porters Five Forces
- 5. Market Analysis, Insights and Forecast 2021-2033
- 5.1. Market Analysis, Insights and Forecast - by Type
- 5.1.1. Local Investors
- 5.1.2. International Investors
- 5.2. Market Analysis, Insights and Forecast - by Industry
- 5.2.1. Real Estate
- 5.2.2. Financial Services
- 5.2.3. Food & Beverage
- 5.2.4. Healthcare
- 5.2.5. Transport and Logistics
- 5.2.6. IT and ITeS
- 5.2.7. Education
- 5.2.8. Other Industries (Energy, etc.)
- 5.3. Market Analysis, Insights and Forecast - by Region
- 5.3.1. North America
- 5.3.2. South America
- 5.3.3. Europe
- 5.3.4. Middle East & Africa
- 5.3.5. Asia Pacific
- 5.1. Market Analysis, Insights and Forecast - by Type
- 6. Global MEA Venture Capital Market Analysis, Insights and Forecast, 2021-2033
- 6.1. Market Analysis, Insights and Forecast - by Type
- 6.1.1. Local Investors
- 6.1.2. International Investors
- 6.2. Market Analysis, Insights and Forecast - by Industry
- 6.2.1. Real Estate
- 6.2.2. Financial Services
- 6.2.3. Food & Beverage
- 6.2.4. Healthcare
- 6.2.5. Transport and Logistics
- 6.2.6. IT and ITeS
- 6.2.7. Education
- 6.2.8. Other Industries (Energy, etc.)
- 6.1. Market Analysis, Insights and Forecast - by Type
- 7. North America MEA Venture Capital Market Analysis, Insights and Forecast, 2020-2032
- 7.1. Market Analysis, Insights and Forecast - by Type
- 7.1.1. Local Investors
- 7.1.2. International Investors
- 7.2. Market Analysis, Insights and Forecast - by Industry
- 7.2.1. Real Estate
- 7.2.2. Financial Services
- 7.2.3. Food & Beverage
- 7.2.4. Healthcare
- 7.2.5. Transport and Logistics
- 7.2.6. IT and ITeS
- 7.2.7. Education
- 7.2.8. Other Industries (Energy, etc.)
- 7.1. Market Analysis, Insights and Forecast - by Type
- 8. South America MEA Venture Capital Market Analysis, Insights and Forecast, 2020-2032
- 8.1. Market Analysis, Insights and Forecast - by Type
- 8.1.1. Local Investors
- 8.1.2. International Investors
- 8.2. Market Analysis, Insights and Forecast - by Industry
- 8.2.1. Real Estate
- 8.2.2. Financial Services
- 8.2.3. Food & Beverage
- 8.2.4. Healthcare
- 8.2.5. Transport and Logistics
- 8.2.6. IT and ITeS
- 8.2.7. Education
- 8.2.8. Other Industries (Energy, etc.)
- 8.1. Market Analysis, Insights and Forecast - by Type
- 9. Europe MEA Venture Capital Market Analysis, Insights and Forecast, 2020-2032
- 9.1. Market Analysis, Insights and Forecast - by Type
- 9.1.1. Local Investors
- 9.1.2. International Investors
- 9.2. Market Analysis, Insights and Forecast - by Industry
- 9.2.1. Real Estate
- 9.2.2. Financial Services
- 9.2.3. Food & Beverage
- 9.2.4. Healthcare
- 9.2.5. Transport and Logistics
- 9.2.6. IT and ITeS
- 9.2.7. Education
- 9.2.8. Other Industries (Energy, etc.)
- 9.1. Market Analysis, Insights and Forecast - by Type
- 10. Middle East & Africa MEA Venture Capital Market Analysis, Insights and Forecast, 2020-2032
- 10.1. Market Analysis, Insights and Forecast - by Type
- 10.1.1. Local Investors
- 10.1.2. International Investors
- 10.2. Market Analysis, Insights and Forecast - by Industry
- 10.2.1. Real Estate
- 10.2.2. Financial Services
- 10.2.3. Food & Beverage
- 10.2.4. Healthcare
- 10.2.5. Transport and Logistics
- 10.2.6. IT and ITeS
- 10.2.7. Education
- 10.2.8. Other Industries (Energy, etc.)
- 10.1. Market Analysis, Insights and Forecast - by Type
- 11. Asia Pacific MEA Venture Capital Market Analysis, Insights and Forecast, 2020-2032
- 11.1. Market Analysis, Insights and Forecast - by Type
- 11.1.1. Local Investors
- 11.1.2. International Investors
- 11.2. Market Analysis, Insights and Forecast - by Industry
- 11.2.1. Real Estate
- 11.2.2. Financial Services
- 11.2.3. Food & Beverage
- 11.2.4. Healthcare
- 11.2.5. Transport and Logistics
- 11.2.6. IT and ITeS
- 11.2.7. Education
- 11.2.8. Other Industries (Energy, etc.)
- 11.1. Market Analysis, Insights and Forecast - by Type
- 12. Competitive Analysis
- 12.1. Company Profiles
- 12.1.1 Nuwa Capital
- 12.1.1.1. Company Overview
- 12.1.1.2. Products
- 12.1.1.3. Company Financials
- 12.1.1.4. SWOT Analysis
- 12.1.2 Wamda Capital
- 12.1.2.1. Company Overview
- 12.1.2.2. Products
- 12.1.2.3. Company Financials
- 12.1.2.4. SWOT Analysis
- 12.1.3 Beyond Capital
- 12.1.3.1. Company Overview
- 12.1.3.2. Products
- 12.1.3.3. Company Financials
- 12.1.3.4. SWOT Analysis
- 12.1.4 Phoenician Funds**List Not Exhaustive
- 12.1.4.1. Company Overview
- 12.1.4.2. Products
- 12.1.4.3. Company Financials
- 12.1.4.4. SWOT Analysis
- 12.1.5 Saudi Venture Capital (SVC)
- 12.1.5.1. Company Overview
- 12.1.5.2. Products
- 12.1.5.3. Company Financials
- 12.1.5.4. SWOT Analysis
- 12.1.6 Falt6Labs Bahrain
- 12.1.6.1. Company Overview
- 12.1.6.2. Products
- 12.1.6.3. Company Financials
- 12.1.6.4. SWOT Analysis
- 12.1.7 Global ventures
- 12.1.7.1. Company Overview
- 12.1.7.2. Products
- 12.1.7.3. Company Financials
- 12.1.7.4. SWOT Analysis
- 12.1.8 Vision Ventures
- 12.1.8.1. Company Overview
- 12.1.8.2. Products
- 12.1.8.3. Company Financials
- 12.1.8.4. SWOT Analysis
- 12.1.9 Algebra Ventures
- 12.1.9.1. Company Overview
- 12.1.9.2. Products
- 12.1.9.3. Company Financials
- 12.1.9.4. SWOT Analysis
- 12.1.10 500 Startups
- 12.1.10.1. Company Overview
- 12.1.10.2. Products
- 12.1.10.3. Company Financials
- 12.1.10.4. SWOT Analysis
- 12.1.1 Nuwa Capital
- 12.2. Market Entropy
- 12.2.1 Company's Key Areas Served
- 12.2.2 Recent Developments
- 12.3. Company Market Share Analysis 2025
- 12.3.1 Top 5 Companies Market Share Analysis
- 12.3.2 Top 3 Companies Market Share Analysis
- 12.4. List of Potential Customers
- 13. Research Methodology
List of Figures
- Figure 1: Global MEA Venture Capital Market Revenue Breakdown (Million, %) by Region 2025 & 2033
- Figure 2: North America MEA Venture Capital Market Revenue (Million), by Type 2025 & 2033
- Figure 3: North America MEA Venture Capital Market Revenue Share (%), by Type 2025 & 2033
- Figure 4: North America MEA Venture Capital Market Revenue (Million), by Industry 2025 & 2033
- Figure 5: North America MEA Venture Capital Market Revenue Share (%), by Industry 2025 & 2033
- Figure 6: North America MEA Venture Capital Market Revenue (Million), by Country 2025 & 2033
- Figure 7: North America MEA Venture Capital Market Revenue Share (%), by Country 2025 & 2033
- Figure 8: South America MEA Venture Capital Market Revenue (Million), by Type 2025 & 2033
- Figure 9: South America MEA Venture Capital Market Revenue Share (%), by Type 2025 & 2033
- Figure 10: South America MEA Venture Capital Market Revenue (Million), by Industry 2025 & 2033
- Figure 11: South America MEA Venture Capital Market Revenue Share (%), by Industry 2025 & 2033
- Figure 12: South America MEA Venture Capital Market Revenue (Million), by Country 2025 & 2033
- Figure 13: South America MEA Venture Capital Market Revenue Share (%), by Country 2025 & 2033
- Figure 14: Europe MEA Venture Capital Market Revenue (Million), by Type 2025 & 2033
- Figure 15: Europe MEA Venture Capital Market Revenue Share (%), by Type 2025 & 2033
- Figure 16: Europe MEA Venture Capital Market Revenue (Million), by Industry 2025 & 2033
- Figure 17: Europe MEA Venture Capital Market Revenue Share (%), by Industry 2025 & 2033
- Figure 18: Europe MEA Venture Capital Market Revenue (Million), by Country 2025 & 2033
- Figure 19: Europe MEA Venture Capital Market Revenue Share (%), by Country 2025 & 2033
- Figure 20: Middle East & Africa MEA Venture Capital Market Revenue (Million), by Type 2025 & 2033
- Figure 21: Middle East & Africa MEA Venture Capital Market Revenue Share (%), by Type 2025 & 2033
- Figure 22: Middle East & Africa MEA Venture Capital Market Revenue (Million), by Industry 2025 & 2033
- Figure 23: Middle East & Africa MEA Venture Capital Market Revenue Share (%), by Industry 2025 & 2033
- Figure 24: Middle East & Africa MEA Venture Capital Market Revenue (Million), by Country 2025 & 2033
- Figure 25: Middle East & Africa MEA Venture Capital Market Revenue Share (%), by Country 2025 & 2033
- Figure 26: Asia Pacific MEA Venture Capital Market Revenue (Million), by Type 2025 & 2033
- Figure 27: Asia Pacific MEA Venture Capital Market Revenue Share (%), by Type 2025 & 2033
- Figure 28: Asia Pacific MEA Venture Capital Market Revenue (Million), by Industry 2025 & 2033
- Figure 29: Asia Pacific MEA Venture Capital Market Revenue Share (%), by Industry 2025 & 2033
- Figure 30: Asia Pacific MEA Venture Capital Market Revenue (Million), by Country 2025 & 2033
- Figure 31: Asia Pacific MEA Venture Capital Market Revenue Share (%), by Country 2025 & 2033
List of Tables
- Table 1: Global MEA Venture Capital Market Revenue Million Forecast, by Type 2020 & 2033
- Table 2: Global MEA Venture Capital Market Revenue Million Forecast, by Industry 2020 & 2033
- Table 3: Global MEA Venture Capital Market Revenue Million Forecast, by Region 2020 & 2033
- Table 4: Global MEA Venture Capital Market Revenue Million Forecast, by Type 2020 & 2033
- Table 5: Global MEA Venture Capital Market Revenue Million Forecast, by Industry 2020 & 2033
- Table 6: Global MEA Venture Capital Market Revenue Million Forecast, by Country 2020 & 2033
- Table 7: United States MEA Venture Capital Market Revenue (Million) Forecast, by Application 2020 & 2033
- Table 8: Canada MEA Venture Capital Market Revenue (Million) Forecast, by Application 2020 & 2033
- Table 9: Mexico MEA Venture Capital Market Revenue (Million) Forecast, by Application 2020 & 2033
- Table 10: Global MEA Venture Capital Market Revenue Million Forecast, by Type 2020 & 2033
- Table 11: Global MEA Venture Capital Market Revenue Million Forecast, by Industry 2020 & 2033
- Table 12: Global MEA Venture Capital Market Revenue Million Forecast, by Country 2020 & 2033
- Table 13: Brazil MEA Venture Capital Market Revenue (Million) Forecast, by Application 2020 & 2033
- Table 14: Argentina MEA Venture Capital Market Revenue (Million) Forecast, by Application 2020 & 2033
- Table 15: Rest of South America MEA Venture Capital Market Revenue (Million) Forecast, by Application 2020 & 2033
- Table 16: Global MEA Venture Capital Market Revenue Million Forecast, by Type 2020 & 2033
- Table 17: Global MEA Venture Capital Market Revenue Million Forecast, by Industry 2020 & 2033
- Table 18: Global MEA Venture Capital Market Revenue Million Forecast, by Country 2020 & 2033
- Table 19: United Kingdom MEA Venture Capital Market Revenue (Million) Forecast, by Application 2020 & 2033
- Table 20: Germany MEA Venture Capital Market Revenue (Million) Forecast, by Application 2020 & 2033
- Table 21: France MEA Venture Capital Market Revenue (Million) Forecast, by Application 2020 & 2033
- Table 22: Italy MEA Venture Capital Market Revenue (Million) Forecast, by Application 2020 & 2033
- Table 23: Spain MEA Venture Capital Market Revenue (Million) Forecast, by Application 2020 & 2033
- Table 24: Russia MEA Venture Capital Market Revenue (Million) Forecast, by Application 2020 & 2033
- Table 25: Benelux MEA Venture Capital Market Revenue (Million) Forecast, by Application 2020 & 2033
- Table 26: Nordics MEA Venture Capital Market Revenue (Million) Forecast, by Application 2020 & 2033
- Table 27: Rest of Europe MEA Venture Capital Market Revenue (Million) Forecast, by Application 2020 & 2033
- Table 28: Global MEA Venture Capital Market Revenue Million Forecast, by Type 2020 & 2033
- Table 29: Global MEA Venture Capital Market Revenue Million Forecast, by Industry 2020 & 2033
- Table 30: Global MEA Venture Capital Market Revenue Million Forecast, by Country 2020 & 2033
- Table 31: Turkey MEA Venture Capital Market Revenue (Million) Forecast, by Application 2020 & 2033
- Table 32: Israel MEA Venture Capital Market Revenue (Million) Forecast, by Application 2020 & 2033
- Table 33: GCC MEA Venture Capital Market Revenue (Million) Forecast, by Application 2020 & 2033
- Table 34: North Africa MEA Venture Capital Market Revenue (Million) Forecast, by Application 2020 & 2033
- Table 35: South Africa MEA Venture Capital Market Revenue (Million) Forecast, by Application 2020 & 2033
- Table 36: Rest of Middle East & Africa MEA Venture Capital Market Revenue (Million) Forecast, by Application 2020 & 2033
- Table 37: Global MEA Venture Capital Market Revenue Million Forecast, by Type 2020 & 2033
- Table 38: Global MEA Venture Capital Market Revenue Million Forecast, by Industry 2020 & 2033
- Table 39: Global MEA Venture Capital Market Revenue Million Forecast, by Country 2020 & 2033
- Table 40: China MEA Venture Capital Market Revenue (Million) Forecast, by Application 2020 & 2033
- Table 41: India MEA Venture Capital Market Revenue (Million) Forecast, by Application 2020 & 2033
- Table 42: Japan MEA Venture Capital Market Revenue (Million) Forecast, by Application 2020 & 2033
- Table 43: South Korea MEA Venture Capital Market Revenue (Million) Forecast, by Application 2020 & 2033
- Table 44: ASEAN MEA Venture Capital Market Revenue (Million) Forecast, by Application 2020 & 2033
- Table 45: Oceania MEA Venture Capital Market Revenue (Million) Forecast, by Application 2020 & 2033
- Table 46: Rest of Asia Pacific MEA Venture Capital Market Revenue (Million) Forecast, by Application 2020 & 2033
Frequently Asked Questions
1. What is the projected Compound Annual Growth Rate (CAGR) of the MEA Venture Capital Market?
The projected CAGR is approximately 10.20%.
2. Which companies are prominent players in the MEA Venture Capital Market?
Key companies in the market include Nuwa Capital, Wamda Capital, Beyond Capital, Phoenician Funds**List Not Exhaustive, Saudi Venture Capital (SVC), Falt6Labs Bahrain, Global ventures, Vision Ventures, Algebra Ventures, 500 Startups.
3. What are the main segments of the MEA Venture Capital Market?
The market segments include Type, Industry.
4. Can you provide details about the market size?
The market size is estimated to be USD 3.53 Million as of 2022.
5. What are some drivers contributing to market growth?
Leading Share of Passenger Vehicles in Car Sales; Quick Processing of Loan through Digital Banking.
6. What are the notable trends driving market growth?
The United Arab Emirates Attracts Higher Investments in the region.
7. Are there any restraints impacting market growth?
Rising Interest Rates Affecting New Auto Buyers Demand for Loan.
8. Can you provide examples of recent developments in the market?
February 2023: Saudi Venture Capital Investment Company launches a USD 1 million income growth fund. The Company launched a close-ended income and capital growth fund - SVC Sukuk Fund.
9. What pricing options are available for accessing the report?
Pricing options include single-user, multi-user, and enterprise licenses priced at USD 4750, USD 4950, and USD 6800 respectively.
10. Is the market size provided in terms of value or volume?
The market size is provided in terms of value, measured in Million.
11. Are there any specific market keywords associated with the report?
Yes, the market keyword associated with the report is "MEA Venture Capital Market," which aids in identifying and referencing the specific market segment covered.
12. How do I determine which pricing option suits my needs best?
The pricing options vary based on user requirements and access needs. Individual users may opt for single-user licenses, while businesses requiring broader access may choose multi-user or enterprise licenses for cost-effective access to the report.
13. Are there any additional resources or data provided in the MEA Venture Capital Market report?
While the report offers comprehensive insights, it's advisable to review the specific contents or supplementary materials provided to ascertain if additional resources or data are available.
14. How can I stay updated on further developments or reports in the MEA Venture Capital Market?
To stay informed about further developments, trends, and reports in the MEA Venture Capital Market, consider subscribing to industry newsletters, following relevant companies and organizations, or regularly checking reputable industry news sources and publications.
Methodology
Step 1 - Identification of Relevant Samples Size from Population Database


Step 2 - Approaches for Defining Global Market Size (Value, Volume* & Price*)

Note*: In applicable scenarios
Step 3 - Data Sources
Primary Research
- Web Analytics
- Survey Reports
- Research Institute
- Latest Research Reports
- Opinion Leaders
Secondary Research
- Annual Reports
- White Paper
- Latest Press Release
- Industry Association
- Paid Database
- Investor Presentations

Step 4 - Data Triangulation
Involves using different sources of information in order to increase the validity of a study
These sources are likely to be stakeholders in a program - participants, other researchers, program staff, other community members, and so on.
Then we put all data in single framework & apply various statistical tools to find out the dynamic on the market.
During the analysis stage, feedback from the stakeholder groups would be compared to determine areas of agreement as well as areas of divergence