

Key Insights
The global Web Accessibility Evaluation Tools market is poised for significant expansion, projected to reach $665 million by 2025. This growth is fueled by a burgeoning awareness of digital inclusivity and the increasing regulatory landscape mandating web accessibility standards. Companies are investing in these tools to ensure their websites are usable by individuals with disabilities, a move that not only aligns with ethical considerations but also broadens their customer base and enhances brand reputation. The market's compound annual growth rate (CAGR) is estimated at 6.9% over the forecast period, indicating a sustained and robust demand for solutions that can effectively identify and rectify accessibility barriers. Key drivers include government mandates like the Americans with Disabilities Act (ADA) in the US and the European Accessibility Act, alongside growing corporate social responsibility initiatives. The market is segmented by application, with website owners and developers being primary users, and by type, encompassing both automated and manual evaluation tools, highlighting a dual approach to achieving comprehensive accessibility. Major players like Google, Siteimprove, and Deque are at the forefront, offering innovative solutions that cater to the evolving needs of businesses and organizations worldwide.
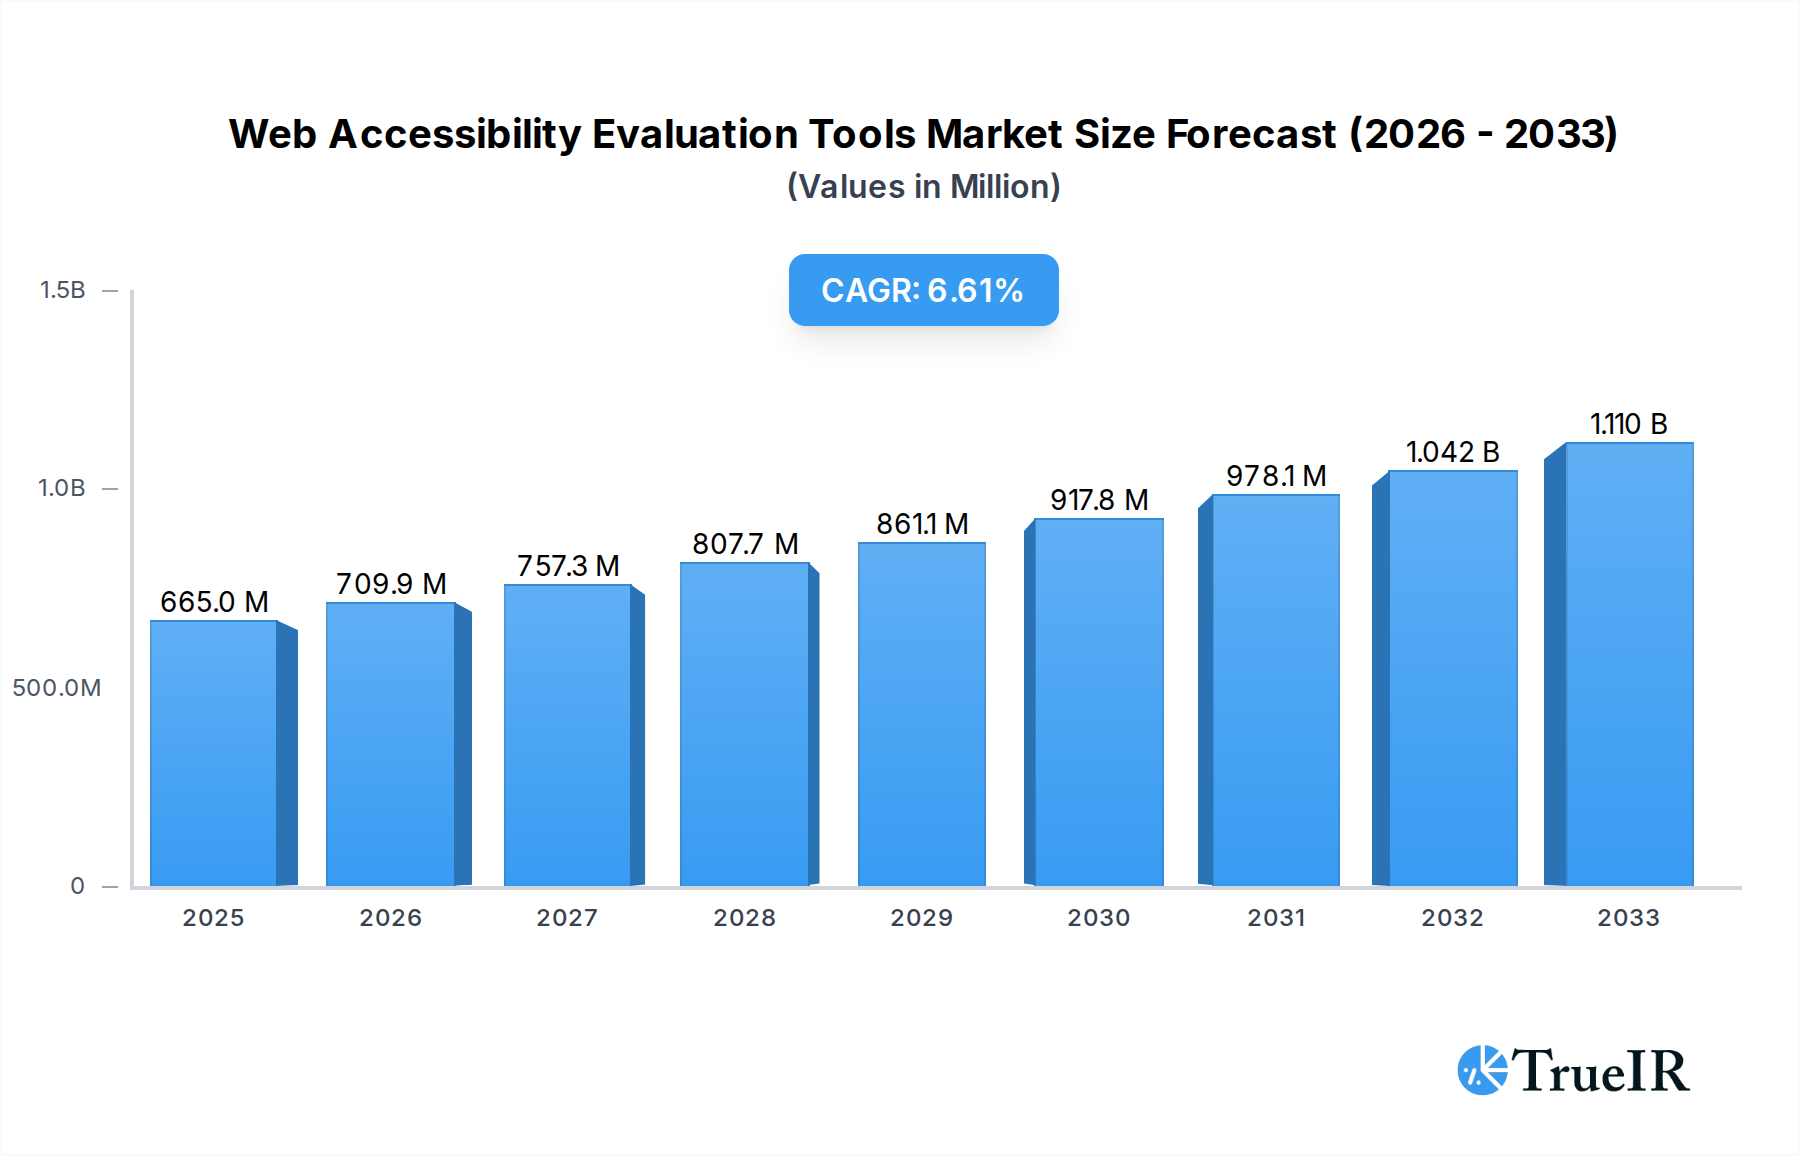
Web Accessibility Evaluation Tools Market Size (In Million)
The web accessibility evaluation tools market is experiencing a dynamic shift driven by evolving digital inclusion imperatives and stringent regulatory frameworks. Beyond compliance, businesses are recognizing the commercial advantage of accessible websites, which translate into improved user experience, enhanced SEO, and a wider market reach. This surge in demand is further propelled by advancements in AI and machine learning, which are making automated evaluation tools more sophisticated and efficient in identifying complex accessibility issues. While automated tools offer speed and scalability, the continued reliance on manual evaluation underscores the nuanced nature of accessibility, requiring human oversight for a truly inclusive digital experience. Geographically, North America and Europe are leading the adoption, driven by well-established legal precedents and a strong ethical commitment to digital accessibility. However, the Asia Pacific region is expected to witness rapid growth, spurred by increasing internet penetration and a growing understanding of the importance of inclusive digital platforms. The market's trajectory is set to create substantial opportunities for tool providers to innovate and deliver comprehensive solutions that empower organizations to create truly accessible web environments.

Web Accessibility Evaluation Tools Company Market Share
Gain deep insights into the rapidly expanding web accessibility evaluation tools market, a critical sector for digital compliance and user experience. This comprehensive report, spanning from 2019 to a forecast period extending to 2033, provides an in-depth analysis of market dynamics, technological advancements, and competitive strategies. With millions of websites and applications requiring robust accessibility solutions, understanding this market is paramount for website owners, developers, and sales teams aiming to maximize their digital reach and avoid costly non-compliance penalties.
Web Accessibility Evaluation Tools Market Structure & Competitive Landscape
The web accessibility evaluation tools market exhibits a dynamic structure characterized by a blend of established players and emerging innovators. Market concentration is moderate, with a few dominant companies vying for market share, while a significant number of smaller, specialized firms contribute to the competitive intensity. Innovation drivers are primarily fueled by evolving accessibility standards (e.g., WCAG updates), increasing regulatory mandates globally, and a growing awareness among businesses of the business imperative for digital inclusivity. Product substitutes, such as in-house accessibility teams or manual testing, are present but often prove less efficient and scalable compared to dedicated evaluation tools. The end-user segmentation highlights a strong demand from Website Owners and Website Developers, who are directly responsible for website compliance and user experience. Sales Teams also leverage these tools to demonstrate compliance and identify sales opportunities. Mergers and acquisitions (M&A) trends are gradually increasing as larger entities seek to consolidate their offerings and expand their market presence. The estimated volume of M&A activities within the historical period of 2019-2024 was approximately XX million, indicating a consolidating market. Concentration ratios are projected to shift as strategic partnerships and acquisitions continue to shape the landscape.
Web Accessibility Evaluation Tools Market Trends & Opportunities
The global web accessibility evaluation tools market is experiencing an unprecedented surge, projected to reach over $XX million by the base year 2025, with a projected Compound Annual Growth Rate (CAGR) of XX% during the forecast period of 2025–2033. This robust growth is intrinsically linked to the escalating digital footprint of businesses and the intensifying regulatory landscape. Technological shifts are a significant trend, with a pronounced move towards AI-powered and automated accessibility testing solutions. These tools offer enhanced speed, accuracy, and comprehensive scanning capabilities, reducing the reliance on manual audits, which are often resource-intensive and time-consuming. Consumer preferences are increasingly leaning towards accessible digital experiences. Users with disabilities, comprising over XX million globally, are actively seeking out and patronizing businesses that prioritize digital inclusion. This growing user base, coupled with increasing awareness campaigns, is compelling businesses to invest in accessibility tools. Competitive dynamics are intensifying, with companies like Google, Siteimprove, and Deque investing heavily in research and development to offer more sophisticated and integrated accessibility solutions. The market penetration rate of advanced automation evaluation tools is projected to exceed XX% by 2033, signifying a paradigm shift in how accessibility is managed. Furthermore, the growing adoption of these tools by small and medium-sized enterprises (SMEs), alongside large enterprises, presents a vast untapped opportunity, estimated to involve over XX million potential new customers by the end of the forecast period. The evolving nature of web content, including rich media, dynamic applications, and progressive web apps, necessitates continuous and adaptive accessibility evaluation, further fueling market expansion. The historical period from 2019 to 2024 saw an average market growth of XX% annually, laying a strong foundation for the projected accelerated growth.
Dominant Markets & Segments in Web Accessibility Evaluation Tools
The Automation Evaluation Tools segment is unequivocally dominant within the web accessibility evaluation tools market, driven by its inherent efficiency, scalability, and cost-effectiveness in identifying accessibility barriers. This segment is projected to capture over XX% of the total market share by 2033. The application of these tools by Website Owners is particularly significant, as they are directly accountable for the accessibility of their digital assets and face potential legal repercussions for non-compliance. Website Developers also constitute a critical segment, integrating accessibility testing into their development workflows to ensure compliant and inclusive websites from the outset. The market dominance of automation tools is further amplified by their ability to conduct frequent, comprehensive scans, identifying issues across millions of web pages within a given timeframe.
Key Growth Drivers in the Automation Evaluation Tools Segment:
- Scalability: Ability to scan vast numbers of web pages and applications rapidly.
- Cost-Effectiveness: Reduced labor costs compared to extensive manual testing.
- Speed of Detection: Quick identification of accessibility violations.
- Integration Capabilities: Seamless integration into CI/CD pipelines and development workflows.
- Regulatory Compliance Demands: The increasing legal necessity for compliance, pushing organizations towards automated solutions for broader coverage.
The North America region stands out as the leading market for web accessibility evaluation tools, largely due to a stringent regulatory environment, particularly in the United States, with laws like the Americans with Disabilities Act (ADA) and Section 508 of the Rehabilitation Act. This region is expected to contribute approximately XX% to the global market revenue by 2033. The United States as a country spearheads this dominance, with a high concentration of businesses actively investing in compliance solutions. The strong presence of technology companies and a heightened awareness of digital inclusivity further bolster its leading position. The Website Owners application segment within North America is the largest consumer of these tools, driven by the need to mitigate legal risks and enhance customer engagement. The robust adoption of automation evaluation tools by over XX million businesses in the US alone underscores its market leadership.
Web Accessibility Evaluation Tools Product Analysis
Product innovations in web accessibility evaluation tools are sharply focused on enhancing AI-driven diagnostics, expanding automated scanning capabilities across diverse digital interfaces, and offering more comprehensive reporting for compliance. Tools are increasingly integrating machine learning algorithms to identify complex accessibility issues, such as those related to keyboard navigation and screen reader compatibility. Competitive advantages lie in the depth of analysis, the ease of integration with existing development workflows, and the clarity of actionable remediation guidance provided. Platforms like those offered by Deque, Siteimprove, and UserWay Inc. are at the forefront, delivering sophisticated solutions that cater to the evolving demands of website developers and owners seeking robust, reliable accessibility assessments.
Key Drivers, Barriers & Challenges in Web Accessibility Evaluation Tools
Key Drivers:
- Increasing Regulatory Scrutiny: Global mandates and legal precedents are compelling organizations to prioritize accessibility.
- Growing Awareness of Digital Inclusion: Businesses recognize the ethical and commercial benefits of accessible websites, expanding their customer base to include over XX million individuals with disabilities.
- Technological Advancements: AI and automation are making evaluation tools more efficient and comprehensive.
- Rise of E-commerce and Digital Services: The shift to online platforms necessitates accessible user experiences for a broader audience.
Challenges Impacting Web Accessibility Evaluation Tools Growth:
- Complexity of Web Technologies: The ever-evolving nature of web development, including dynamic content and single-page applications, poses ongoing challenges for consistent evaluation.
- Cost of Implementation and Maintenance: While automation reduces costs, initial investment and ongoing subscription fees can be a barrier for smaller organizations, potentially impacting the adoption for XX% of SMEs.
- Lack of Skilled Professionals: A shortage of accessibility experts for manual auditing and remediation.
- Resistance to Change: Overcoming organizational inertia and integrating accessibility into existing workflows requires significant effort.
- Varying International Standards: Navigating diverse accessibility guidelines across different regions can create complexity.
Growth Drivers in the Web Accessibility Evaluation Tools Market
Key growth drivers include the escalating legal and regulatory pressures worldwide, such as stricter enforcement of the Americans with Disabilities Act (ADA) in the US and similar legislation in Europe and Asia. The growing understanding among businesses of the significant commercial advantages of digital inclusivity, including expanded market reach to approximately XX million potential customers with disabilities and enhanced brand reputation, is a major impetus. Technological advancements, particularly in AI and machine learning, are leading to more sophisticated and efficient automated evaluation tools, making accessibility compliance more attainable. The increasing volume of web content and the complexity of digital platforms necessitate continuous and automated monitoring, further fueling demand for these solutions.
Challenges Impacting Web Accessibility Evaluation Tools Growth
Despite strong growth, the market faces significant challenges. The evolving landscape of web development, with its constant introduction of new technologies and frameworks, requires continuous adaptation of evaluation tools. Regulatory complexities and the lack of a universally standardized accessibility framework across all regions can create confusion and compliance hurdles for global businesses. Furthermore, the upfront cost of implementing advanced evaluation tools and the ongoing need for skilled accessibility professionals for remediation can be substantial, particularly for smaller organizations. Competitive pressures also drive down prices, while supply chain issues, though less prevalent for software, can impact the development and delivery of integrated hardware-software solutions for some vendors.
Key Players Shaping the Web Accessibility Evaluation Tools Market
- Siteimprove
- DYNO Mapper
- Deque
- BoIA
- Crownpeak
- Level Access
- DubBot
- Monsido
- Silktide
- UserWay Inc.
Significant Web Accessibility Evaluation Tools Industry Milestones
- 2019: W3C publishes WCAG 2.1, introducing new success criteria and expanding guidelines for mobile and cognitive accessibility.
- 2020: Increased legal settlements and a surge in accessibility lawsuits, prompting greater market adoption.
- 2021: Major technology companies like Google enhance their accessibility testing tools within developer ecosystems.
- 2022: The rise of AI and machine learning in automated accessibility testing gains significant traction.
- 2023: Growing emphasis on inclusive design principles and the integration of accessibility throughout the product lifecycle.
- 2024: Expansion of accessibility regulations in emerging markets, creating new opportunities.
Future Outlook for Web Accessibility Evaluation Tools Market
The future outlook for the web accessibility evaluation tools market is exceptionally bright, driven by sustained regulatory pressure, increasing corporate social responsibility, and a profound shift in consumer expectations. The market is poised for continued exponential growth, projected to exceed $XX million by 2033. Strategic opportunities lie in developing more sophisticated AI-powered solutions that offer predictive analytics and seamless integration into development and content management systems. The expansion into emerging markets and the development of specialized tools for new digital formats like virtual reality and augmented reality will also be key growth catalysts. The market will increasingly focus on providing end-to-end accessibility solutions, from initial evaluation to ongoing monitoring and remediation support, ensuring truly inclusive digital experiences for millions worldwide.
Web Accessibility Evaluation Tools Segmentation
-
1. Application
- 1.1. Website Owners
- 1.2. Website Developers
- 1.3. Sales Teams
-
2. Type
- 2.1. Automation Evaluation Tools
- 2.2. Manual Evaluation Tools
Web Accessibility Evaluation Tools Segmentation By Geography
-
1. North America
- 1.1. United States
- 1.2. Canada
- 1.3. Mexico
-
2. South America
- 2.1. Brazil
- 2.2. Argentina
- 2.3. Rest of South America
-
3. Europe
- 3.1. United Kingdom
- 3.2. Germany
- 3.3. France
- 3.4. Italy
- 3.5. Spain
- 3.6. Russia
- 3.7. Benelux
- 3.8. Nordics
- 3.9. Rest of Europe
-
4. Middle East & Africa
- 4.1. Turkey
- 4.2. Israel
- 4.3. GCC
- 4.4. North Africa
- 4.5. South Africa
- 4.6. Rest of Middle East & Africa
-
5. Asia Pacific
- 5.1. China
- 5.2. India
- 5.3. Japan
- 5.4. South Korea
- 5.5. ASEAN
- 5.6. Oceania
- 5.7. Rest of Asia Pacific

Web Accessibility Evaluation Tools Regional Market Share
Geographic Coverage of Web Accessibility Evaluation Tools
Web Accessibility Evaluation Tools REPORT HIGHLIGHTS
| Aspects | Details |
|---|---|
| Study Period | 2020-2034 |
| Base Year | 2025 |
| Estimated Year | 2026 |
| Forecast Period | 2026-2034 |
| Historical Period | 2020-2025 |
| Growth Rate | CAGR of 6.9% from 2020-2034 |
| Segmentation |
|
Table of Contents
- 1. Introduction
- 1.1. Research Scope
- 1.2. Market Segmentation
- 1.3. Research Methodology
- 1.4. Definitions and Assumptions
- 2. Executive Summary
- 2.1. Introduction
- 3. Market Dynamics
- 3.1. Introduction
- 3.2. Market Drivers
- 3.3. Market Restrains
- 3.4. Market Trends
- 4. Market Factor Analysis
- 4.1. Porters Five Forces
- 4.2. Supply/Value Chain
- 4.3. PESTEL analysis
- 4.4. Market Entropy
- 4.5. Patent/Trademark Analysis
- 5. Global Web Accessibility Evaluation Tools Analysis, Insights and Forecast, 2020-2032
- 5.1. Market Analysis, Insights and Forecast - by Application
- 5.1.1. Website Owners
- 5.1.2. Website Developers
- 5.1.3. Sales Teams
- 5.2. Market Analysis, Insights and Forecast - by Type
- 5.2.1. Automation Evaluation Tools
- 5.2.2. Manual Evaluation Tools
- 5.3. Market Analysis, Insights and Forecast - by Region
- 5.3.1. North America
- 5.3.2. South America
- 5.3.3. Europe
- 5.3.4. Middle East & Africa
- 5.3.5. Asia Pacific
- 5.1. Market Analysis, Insights and Forecast - by Application
- 6. North America Web Accessibility Evaluation Tools Analysis, Insights and Forecast, 2020-2032
- 6.1. Market Analysis, Insights and Forecast - by Application
- 6.1.1. Website Owners
- 6.1.2. Website Developers
- 6.1.3. Sales Teams
- 6.2. Market Analysis, Insights and Forecast - by Type
- 6.2.1. Automation Evaluation Tools
- 6.2.2. Manual Evaluation Tools
- 6.1. Market Analysis, Insights and Forecast - by Application
- 7. South America Web Accessibility Evaluation Tools Analysis, Insights and Forecast, 2020-2032
- 7.1. Market Analysis, Insights and Forecast - by Application
- 7.1.1. Website Owners
- 7.1.2. Website Developers
- 7.1.3. Sales Teams
- 7.2. Market Analysis, Insights and Forecast - by Type
- 7.2.1. Automation Evaluation Tools
- 7.2.2. Manual Evaluation Tools
- 7.1. Market Analysis, Insights and Forecast - by Application
- 8. Europe Web Accessibility Evaluation Tools Analysis, Insights and Forecast, 2020-2032
- 8.1. Market Analysis, Insights and Forecast - by Application
- 8.1.1. Website Owners
- 8.1.2. Website Developers
- 8.1.3. Sales Teams
- 8.2. Market Analysis, Insights and Forecast - by Type
- 8.2.1. Automation Evaluation Tools
- 8.2.2. Manual Evaluation Tools
- 8.1. Market Analysis, Insights and Forecast - by Application
- 9. Middle East & Africa Web Accessibility Evaluation Tools Analysis, Insights and Forecast, 2020-2032
- 9.1. Market Analysis, Insights and Forecast - by Application
- 9.1.1. Website Owners
- 9.1.2. Website Developers
- 9.1.3. Sales Teams
- 9.2. Market Analysis, Insights and Forecast - by Type
- 9.2.1. Automation Evaluation Tools
- 9.2.2. Manual Evaluation Tools
- 9.1. Market Analysis, Insights and Forecast - by Application
- 10. Asia Pacific Web Accessibility Evaluation Tools Analysis, Insights and Forecast, 2020-2032
- 10.1. Market Analysis, Insights and Forecast - by Application
- 10.1.1. Website Owners
- 10.1.2. Website Developers
- 10.1.3. Sales Teams
- 10.2. Market Analysis, Insights and Forecast - by Type
- 10.2.1. Automation Evaluation Tools
- 10.2.2. Manual Evaluation Tools
- 10.1. Market Analysis, Insights and Forecast - by Application
- 11. Competitive Analysis
- 11.1. Global Market Share Analysis 2025
- 11.2. Company Profiles
- 11.2.1 Google
- 11.2.1.1. Overview
- 11.2.1.2. Products
- 11.2.1.3. SWOT Analysis
- 11.2.1.4. Recent Developments
- 11.2.1.5. Financials (Based on Availability)
- 11.2.2 Siteimprove
- 11.2.2.1. Overview
- 11.2.2.2. Products
- 11.2.2.3. SWOT Analysis
- 11.2.2.4. Recent Developments
- 11.2.2.5. Financials (Based on Availability)
- 11.2.3 DYNO Mapper
- 11.2.3.1. Overview
- 11.2.3.2. Products
- 11.2.3.3. SWOT Analysis
- 11.2.3.4. Recent Developments
- 11.2.3.5. Financials (Based on Availability)
- 11.2.4 Deque
- 11.2.4.1. Overview
- 11.2.4.2. Products
- 11.2.4.3. SWOT Analysis
- 11.2.4.4. Recent Developments
- 11.2.4.5. Financials (Based on Availability)
- 11.2.5 BoIA
- 11.2.5.1. Overview
- 11.2.5.2. Products
- 11.2.5.3. SWOT Analysis
- 11.2.5.4. Recent Developments
- 11.2.5.5. Financials (Based on Availability)
- 11.2.6 Crownpeak
- 11.2.6.1. Overview
- 11.2.6.2. Products
- 11.2.6.3. SWOT Analysis
- 11.2.6.4. Recent Developments
- 11.2.6.5. Financials (Based on Availability)
- 11.2.7 Level Access
- 11.2.7.1. Overview
- 11.2.7.2. Products
- 11.2.7.3. SWOT Analysis
- 11.2.7.4. Recent Developments
- 11.2.7.5. Financials (Based on Availability)
- 11.2.8 DubBot
- 11.2.8.1. Overview
- 11.2.8.2. Products
- 11.2.8.3. SWOT Analysis
- 11.2.8.4. Recent Developments
- 11.2.8.5. Financials (Based on Availability)
- 11.2.9 Monsido
- 11.2.9.1. Overview
- 11.2.9.2. Products
- 11.2.9.3. SWOT Analysis
- 11.2.9.4. Recent Developments
- 11.2.9.5. Financials (Based on Availability)
- 11.2.10 Silktide
- 11.2.10.1. Overview
- 11.2.10.2. Products
- 11.2.10.3. SWOT Analysis
- 11.2.10.4. Recent Developments
- 11.2.10.5. Financials (Based on Availability)
- 11.2.11 UserWay Inc.
- 11.2.11.1. Overview
- 11.2.11.2. Products
- 11.2.11.3. SWOT Analysis
- 11.2.11.4. Recent Developments
- 11.2.11.5. Financials (Based on Availability)
- 11.2.1 Google
List of Figures
- Figure 1: Global Web Accessibility Evaluation Tools Revenue Breakdown (million, %) by Region 2025 & 2033
- Figure 2: North America Web Accessibility Evaluation Tools Revenue (million), by Application 2025 & 2033
- Figure 3: North America Web Accessibility Evaluation Tools Revenue Share (%), by Application 2025 & 2033
- Figure 4: North America Web Accessibility Evaluation Tools Revenue (million), by Type 2025 & 2033
- Figure 5: North America Web Accessibility Evaluation Tools Revenue Share (%), by Type 2025 & 2033
- Figure 6: North America Web Accessibility Evaluation Tools Revenue (million), by Country 2025 & 2033
- Figure 7: North America Web Accessibility Evaluation Tools Revenue Share (%), by Country 2025 & 2033
- Figure 8: South America Web Accessibility Evaluation Tools Revenue (million), by Application 2025 & 2033
- Figure 9: South America Web Accessibility Evaluation Tools Revenue Share (%), by Application 2025 & 2033
- Figure 10: South America Web Accessibility Evaluation Tools Revenue (million), by Type 2025 & 2033
- Figure 11: South America Web Accessibility Evaluation Tools Revenue Share (%), by Type 2025 & 2033
- Figure 12: South America Web Accessibility Evaluation Tools Revenue (million), by Country 2025 & 2033
- Figure 13: South America Web Accessibility Evaluation Tools Revenue Share (%), by Country 2025 & 2033
- Figure 14: Europe Web Accessibility Evaluation Tools Revenue (million), by Application 2025 & 2033
- Figure 15: Europe Web Accessibility Evaluation Tools Revenue Share (%), by Application 2025 & 2033
- Figure 16: Europe Web Accessibility Evaluation Tools Revenue (million), by Type 2025 & 2033
- Figure 17: Europe Web Accessibility Evaluation Tools Revenue Share (%), by Type 2025 & 2033
- Figure 18: Europe Web Accessibility Evaluation Tools Revenue (million), by Country 2025 & 2033
- Figure 19: Europe Web Accessibility Evaluation Tools Revenue Share (%), by Country 2025 & 2033
- Figure 20: Middle East & Africa Web Accessibility Evaluation Tools Revenue (million), by Application 2025 & 2033
- Figure 21: Middle East & Africa Web Accessibility Evaluation Tools Revenue Share (%), by Application 2025 & 2033
- Figure 22: Middle East & Africa Web Accessibility Evaluation Tools Revenue (million), by Type 2025 & 2033
- Figure 23: Middle East & Africa Web Accessibility Evaluation Tools Revenue Share (%), by Type 2025 & 2033
- Figure 24: Middle East & Africa Web Accessibility Evaluation Tools Revenue (million), by Country 2025 & 2033
- Figure 25: Middle East & Africa Web Accessibility Evaluation Tools Revenue Share (%), by Country 2025 & 2033
- Figure 26: Asia Pacific Web Accessibility Evaluation Tools Revenue (million), by Application 2025 & 2033
- Figure 27: Asia Pacific Web Accessibility Evaluation Tools Revenue Share (%), by Application 2025 & 2033
- Figure 28: Asia Pacific Web Accessibility Evaluation Tools Revenue (million), by Type 2025 & 2033
- Figure 29: Asia Pacific Web Accessibility Evaluation Tools Revenue Share (%), by Type 2025 & 2033
- Figure 30: Asia Pacific Web Accessibility Evaluation Tools Revenue (million), by Country 2025 & 2033
- Figure 31: Asia Pacific Web Accessibility Evaluation Tools Revenue Share (%), by Country 2025 & 2033
List of Tables
- Table 1: Global Web Accessibility Evaluation Tools Revenue million Forecast, by Application 2020 & 2033
- Table 2: Global Web Accessibility Evaluation Tools Revenue million Forecast, by Type 2020 & 2033
- Table 3: Global Web Accessibility Evaluation Tools Revenue million Forecast, by Region 2020 & 2033
- Table 4: Global Web Accessibility Evaluation Tools Revenue million Forecast, by Application 2020 & 2033
- Table 5: Global Web Accessibility Evaluation Tools Revenue million Forecast, by Type 2020 & 2033
- Table 6: Global Web Accessibility Evaluation Tools Revenue million Forecast, by Country 2020 & 2033
- Table 7: United States Web Accessibility Evaluation Tools Revenue (million) Forecast, by Application 2020 & 2033
- Table 8: Canada Web Accessibility Evaluation Tools Revenue (million) Forecast, by Application 2020 & 2033
- Table 9: Mexico Web Accessibility Evaluation Tools Revenue (million) Forecast, by Application 2020 & 2033
- Table 10: Global Web Accessibility Evaluation Tools Revenue million Forecast, by Application 2020 & 2033
- Table 11: Global Web Accessibility Evaluation Tools Revenue million Forecast, by Type 2020 & 2033
- Table 12: Global Web Accessibility Evaluation Tools Revenue million Forecast, by Country 2020 & 2033
- Table 13: Brazil Web Accessibility Evaluation Tools Revenue (million) Forecast, by Application 2020 & 2033
- Table 14: Argentina Web Accessibility Evaluation Tools Revenue (million) Forecast, by Application 2020 & 2033
- Table 15: Rest of South America Web Accessibility Evaluation Tools Revenue (million) Forecast, by Application 2020 & 2033
- Table 16: Global Web Accessibility Evaluation Tools Revenue million Forecast, by Application 2020 & 2033
- Table 17: Global Web Accessibility Evaluation Tools Revenue million Forecast, by Type 2020 & 2033
- Table 18: Global Web Accessibility Evaluation Tools Revenue million Forecast, by Country 2020 & 2033
- Table 19: United Kingdom Web Accessibility Evaluation Tools Revenue (million) Forecast, by Application 2020 & 2033
- Table 20: Germany Web Accessibility Evaluation Tools Revenue (million) Forecast, by Application 2020 & 2033
- Table 21: France Web Accessibility Evaluation Tools Revenue (million) Forecast, by Application 2020 & 2033
- Table 22: Italy Web Accessibility Evaluation Tools Revenue (million) Forecast, by Application 2020 & 2033
- Table 23: Spain Web Accessibility Evaluation Tools Revenue (million) Forecast, by Application 2020 & 2033
- Table 24: Russia Web Accessibility Evaluation Tools Revenue (million) Forecast, by Application 2020 & 2033
- Table 25: Benelux Web Accessibility Evaluation Tools Revenue (million) Forecast, by Application 2020 & 2033
- Table 26: Nordics Web Accessibility Evaluation Tools Revenue (million) Forecast, by Application 2020 & 2033
- Table 27: Rest of Europe Web Accessibility Evaluation Tools Revenue (million) Forecast, by Application 2020 & 2033
- Table 28: Global Web Accessibility Evaluation Tools Revenue million Forecast, by Application 2020 & 2033
- Table 29: Global Web Accessibility Evaluation Tools Revenue million Forecast, by Type 2020 & 2033
- Table 30: Global Web Accessibility Evaluation Tools Revenue million Forecast, by Country 2020 & 2033
- Table 31: Turkey Web Accessibility Evaluation Tools Revenue (million) Forecast, by Application 2020 & 2033
- Table 32: Israel Web Accessibility Evaluation Tools Revenue (million) Forecast, by Application 2020 & 2033
- Table 33: GCC Web Accessibility Evaluation Tools Revenue (million) Forecast, by Application 2020 & 2033
- Table 34: North Africa Web Accessibility Evaluation Tools Revenue (million) Forecast, by Application 2020 & 2033
- Table 35: South Africa Web Accessibility Evaluation Tools Revenue (million) Forecast, by Application 2020 & 2033
- Table 36: Rest of Middle East & Africa Web Accessibility Evaluation Tools Revenue (million) Forecast, by Application 2020 & 2033
- Table 37: Global Web Accessibility Evaluation Tools Revenue million Forecast, by Application 2020 & 2033
- Table 38: Global Web Accessibility Evaluation Tools Revenue million Forecast, by Type 2020 & 2033
- Table 39: Global Web Accessibility Evaluation Tools Revenue million Forecast, by Country 2020 & 2033
- Table 40: China Web Accessibility Evaluation Tools Revenue (million) Forecast, by Application 2020 & 2033
- Table 41: India Web Accessibility Evaluation Tools Revenue (million) Forecast, by Application 2020 & 2033
- Table 42: Japan Web Accessibility Evaluation Tools Revenue (million) Forecast, by Application 2020 & 2033
- Table 43: South Korea Web Accessibility Evaluation Tools Revenue (million) Forecast, by Application 2020 & 2033
- Table 44: ASEAN Web Accessibility Evaluation Tools Revenue (million) Forecast, by Application 2020 & 2033
- Table 45: Oceania Web Accessibility Evaluation Tools Revenue (million) Forecast, by Application 2020 & 2033
- Table 46: Rest of Asia Pacific Web Accessibility Evaluation Tools Revenue (million) Forecast, by Application 2020 & 2033
Frequently Asked Questions
1. What is the projected Compound Annual Growth Rate (CAGR) of the Web Accessibility Evaluation Tools?
The projected CAGR is approximately 6.9%.
2. Which companies are prominent players in the Web Accessibility Evaluation Tools?
Key companies in the market include Google, Siteimprove, DYNO Mapper, Deque, BoIA, Crownpeak, Level Access, DubBot, Monsido, Silktide, UserWay Inc..
3. What are the main segments of the Web Accessibility Evaluation Tools?
The market segments include Application, Type.
4. Can you provide details about the market size?
The market size is estimated to be USD 665 million as of 2022.
5. What are some drivers contributing to market growth?
N/A
6. What are the notable trends driving market growth?
N/A
7. Are there any restraints impacting market growth?
N/A
8. Can you provide examples of recent developments in the market?
N/A
9. What pricing options are available for accessing the report?
Pricing options include single-user, multi-user, and enterprise licenses priced at USD 3950.00, USD 5925.00, and USD 7900.00 respectively.
10. Is the market size provided in terms of value or volume?
The market size is provided in terms of value, measured in million.
11. Are there any specific market keywords associated with the report?
Yes, the market keyword associated with the report is "Web Accessibility Evaluation Tools," which aids in identifying and referencing the specific market segment covered.
12. How do I determine which pricing option suits my needs best?
The pricing options vary based on user requirements and access needs. Individual users may opt for single-user licenses, while businesses requiring broader access may choose multi-user or enterprise licenses for cost-effective access to the report.
13. Are there any additional resources or data provided in the Web Accessibility Evaluation Tools report?
While the report offers comprehensive insights, it's advisable to review the specific contents or supplementary materials provided to ascertain if additional resources or data are available.
14. How can I stay updated on further developments or reports in the Web Accessibility Evaluation Tools?
To stay informed about further developments, trends, and reports in the Web Accessibility Evaluation Tools, consider subscribing to industry newsletters, following relevant companies and organizations, or regularly checking reputable industry news sources and publications.
Methodology
Step 1 - Identification of Relevant Samples Size from Population Database


Step 2 - Approaches for Defining Global Market Size (Value, Volume* & Price*)

Note*: In applicable scenarios
Step 3 - Data Sources
Primary Research
- Web Analytics
- Survey Reports
- Research Institute
- Latest Research Reports
- Opinion Leaders
Secondary Research
- Annual Reports
- White Paper
- Latest Press Release
- Industry Association
- Paid Database
- Investor Presentations

Step 4 - Data Triangulation
Involves using different sources of information in order to increase the validity of a study
These sources are likely to be stakeholders in a program - participants, other researchers, program staff, other community members, and so on.
Then we put all data in single framework & apply various statistical tools to find out the dynamic on the market.
During the analysis stage, feedback from the stakeholder groups would be compared to determine areas of agreement as well as areas of divergence