

Key Insights
The global wood pulp market, valued at approximately $166.65 billion in 2025, is projected to expand at a compound annual growth rate (CAGR) of 2.7% from 2025 to 2033. This growth is primarily propelled by the escalating demand for sustainable packaging solutions, especially within the burgeoning e-commerce sector, and the sustained expansion of the paper manufacturing industry. Key market drivers include the increasing adoption of sustainable forestry practices, the development of advanced pulp varieties with superior characteristics, and growing global awareness regarding the environmental impact of plastic waste.
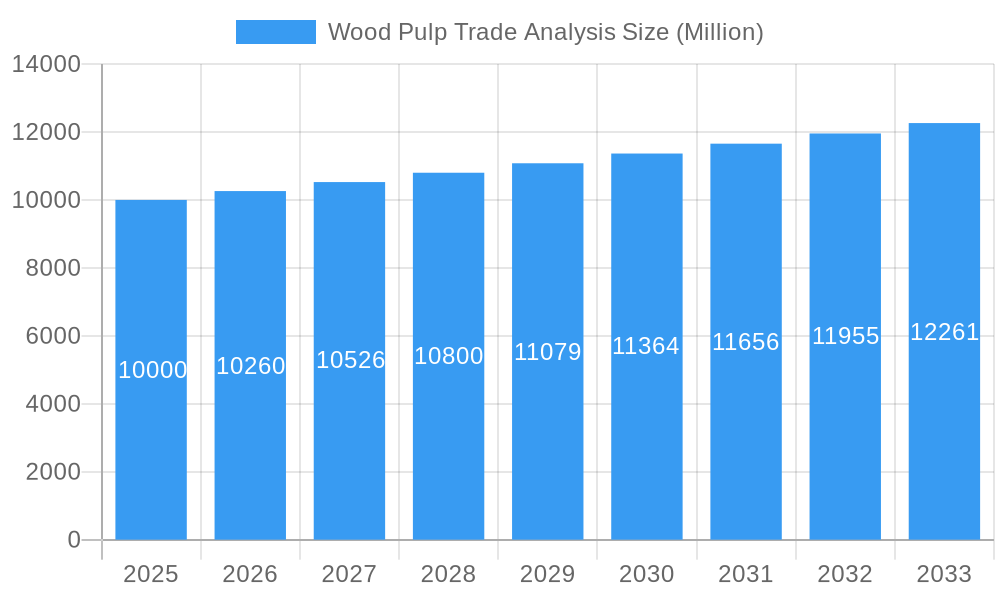
Wood Pulp Trade Analysis Market Size (In Billion)
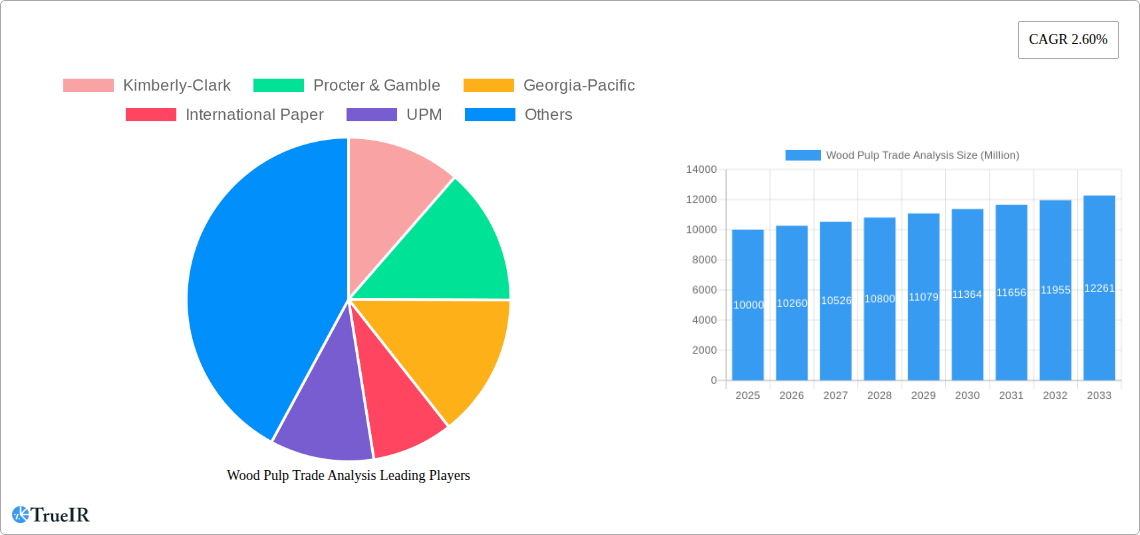
However, the market faces potential restraints such as volatile raw material pricing, stringent environmental regulations, and competition from alternative materials like recycled fibers and synthetic substitutes. The market is segmented by product type, including chemical pulp, mechanical pulp, and dissolving pulp, and by end-use industry, such as packaging, paper manufacturing, and textiles. Leading companies, including Kimberly-Clark, Procter & Gamble, Georgia-Pacific, International Paper, and UPM, are influencing market dynamics through strategic investments in capacity enhancement and product innovation.
Wood Pulp Trade Analysis Company Market Share
Regional analysis indicates substantial growth potential in the Asia-Pacific region, driven by rapid economic development and increasing consumer spending in key markets like China and India. North America and Europe, despite being mature markets, will continue to be significant contributors to global demand, supported by well-established infrastructure and enduring consumer preferences. The market's trajectory will be significantly shaped by its ability to address resource sustainability and environmental concerns. Companies are prioritizing eco-friendly sourcing and production methods to maintain a competitive advantage. Technological advancements in pulp processing are also expected to enhance operational efficiency and reduce production costs. The persistent growth in e-commerce and the rising demand for sustainable packaging present considerable opportunities for wood pulp producers. This market segmentation offers valuable insights for strategic planning and investment decisions across various product segments and geographical regions.
Wood Pulp Trade Analysis: A Comprehensive Market Report (2019-2033)
This dynamic report provides an in-depth analysis of the wood pulp trade market, offering crucial insights for industry stakeholders, investors, and researchers. The study period spans from 2019 to 2033, with a focus on the forecast period of 2025-2033 and a base year of 2025. We delve into market size, segmentation, competitive dynamics, and future growth prospects, incorporating both quantitative and qualitative data to provide a holistic view of this evolving industry. This report incorporates data valued in Millions.
Wood Pulp Trade Analysis Market Structure & Competitive Landscape
This section undertakes a deep dive into the competitive intricacies of the global wood pulp market. We meticulously analyze market concentration, identify key innovation drivers, evaluate the multifaceted impact of regulatory frameworks, and highlight prevailing industry trends. Our analysis extends to the profound influence of mergers and acquisitions (M&A) activity, the dynamic landscape of product substitution, and a granular examination of end-user segmentation across critical sectors including Packaging, Paper Manufacturing, and Textiles. Market concentration is rigorously assessed through various industry ratios, underscoring the substantial influence of leading entities such as Kimberly-Clark, Procter & Gamble, Georgia-Pacific, International Paper, and UPM. The report quantifies M&A transactions within the historical period (2019-2024) and provides projections for the forecast period (2025-2033), estimating the volume at approximately [Insert Specific Number] Million deals. Qualitative insights further illuminate how evolving regulatory changes shape market access and foster competition, complemented by a thorough analysis of innovation patterns and the strategic introduction of substitute materials. The evolving end-user segmentation vividly illustrates shifts in demand, with projections for Packaging at approximately [Insert Specific Number] Million, Paper Manufacturing at approximately [Insert Specific Number] Million, and Textiles at approximately [Insert Specific Number] Million.
Wood Pulp Trade Analysis Market Trends & Opportunities
This section offers a comprehensive and forward-looking overview of the wood pulp trade market's trajectory, encompassing critical trends and emerging opportunities throughout the study period (2019-2033). The market is projected to experience a robust Compound Annual Growth Rate (CAGR) of approximately [Insert Specific Percentage]% during the forecast period (2025-2033). This growth is primarily fueled by the escalating demand for innovative packaging solutions, particularly from rapidly expanding sectors like e-commerce and Fast-Moving Consumer Goods (FMCG). We delve into significant technological shifts, including advancements in pulp production techniques and processing technologies, and their ripple effects on overall market dynamics. Furthermore, we examine the growing consumer preference for sustainable and environmentally responsible products and their consequent influence on market segmentation and product development. The competitive dynamics segment provides a critical evaluation of the strategic maneuvers employed by major industry players, including Kimberly-Clark, Procter & Gamble, Georgia-Pacific, International Paper, and UPM, as they adeptly navigate evolving market landscapes. The market penetration rate for key product categories – Chemical Pulp, Mechanical Pulp, and Dissolving Pulp – is meticulously assessed, spotlighting significant growth potential across diverse market segments.
Dominant Markets & Segments in Wood Pulp Trade Analysis
This section identifies the leading regions, countries, and segments within the wood pulp market. The analysis examines growth drivers specific to each segment: Product Type (Chemical Pulp, Mechanical Pulp, Dissolving Pulp) and End-Use Industry (Packaging, Paper Manufacturing, Textiles).
- Packaging: Growth is driven by the booming e-commerce sector and increasing demand for sustainable packaging solutions. The market size is projected to reach xx Million by 2033.
- Paper Manufacturing: While facing challenges from digitization, this segment remains significant, particularly for specialized paper types. The market size is estimated at xx Million in 2025.
- Textiles: This segment's growth is linked to the demand for sustainable textiles and specialized applications. The market size is predicted to be xx Million by 2033.
- Chemical Pulp: This segment benefits from advancements in pulp production technology and its versatility across various end-use applications. The projected market size is xx Million in 2033.
- Mechanical Pulp: This segment's performance is closely tied to the demand for newsprint and printing papers. The market size for 2025 is estimated at xx Million.
- Dissolving Pulp: This segment is crucial for producing viscose fiber and other specialty products. The estimated market size for 2025 is xx Million.
The report details the specific factors contributing to the dominance of particular regions or countries, considering infrastructure development, government policies, and economic growth.
Wood Pulp Trade Analysis Product Analysis
This section focuses on the innovation and application of wood pulp products, analyzing the competitive advantages of various types. Technological advancements, such as the development of sustainable and high-performance pulps, are examined along with their impact on market fit and consumer acceptance. The analysis emphasizes the increasing adoption of eco-friendly pulps and their role in meeting the growing demand for sustainable materials across diverse industries.
Key Drivers, Barriers & Challenges in Wood Pulp Trade Analysis
Key Drivers: The wood pulp trade market is propelled by several influential factors. Paramount among these are ongoing technological advancements in pulp production, which enhance efficiency and sustainability. The surging demand for packaging materials, intrinsically linked to the growth of e-commerce and the FMCG sector, provides a consistent and expanding market. Moreover, government policies actively promoting sustainable forestry practices create a more favorable and responsible operating environment. The pronounced global shift towards sustainable packaging solutions is a particularly significant catalyst, stimulating innovation and encouraging substantial investment in eco-friendly pulp alternatives.
Key Challenges and Restraints: The market faces notable headwinds. Fluctuations in raw material prices can significantly impact production costs and profitability. Stringent environmental regulations, while essential for sustainability, can impose operational constraints on pulp production. Intense competition among established major players further shapes market dynamics and pricing. Supply chain disruptions, particularly those affecting raw material sourcing and logistics, can negatively impact production capacity and hinder timely delivery. Regulatory hurdles in specific geographic regions and the increasing price volatility inherent in raw material markets also present constraints on overall market expansion. The predicted impact of these aggregated challenges on the market growth is estimated to be a reduction of approximately [Insert Specific Percentage]%.
Growth Drivers in the Wood Pulp Trade Analysis Market
The key growth drivers include the rising demand for sustainable packaging solutions, advancements in pulp production technology leading to improved quality and efficiency, and supportive government policies in key regions fostering the sustainable development of the forestry industry. Increased demand from emerging economies, especially in Asia, also contributes to market expansion.
Challenges Impacting Wood Pulp Trade Analysis Growth
Challenges impacting growth include fluctuating raw material prices, environmental regulations, and intensifying competition. Supply chain vulnerabilities, geopolitical uncertainties, and the potential for substitute materials to gain market share pose significant risks to the industry's long-term growth trajectory.
Key Players Shaping the Wood Pulp Trade Analysis Market
- Kimberly-Clark: A global leader in hygiene products, with significant wood pulp consumption and production.
- Procter & Gamble: A major consumer goods company whose diverse product portfolio relies heavily on pulp-based materials.
- Georgia-Pacific: A prominent manufacturer of paper, packaging, and building products, deeply integrated into the pulp supply chain.
- International Paper: One of the world's largest producers of fiber-based packaging and pulp, a key influencer in the market.
- UPM: A Finnish company renowned for its sustainable forest-based solutions, including pulp and paper production.
Significant Wood Pulp Trade Analysis Industry Milestones
- April 2022: ICRA report highlights a paradigm shift in the Indian paper industry, with declining demand for newsprint and printing papers but strong growth in packaging paper due to e-commerce and FMCG expansion.
- December 2022: IIT Roorkee and Shah Paper Mills Limited launch a joint project focused on advanced packaging research and skill development, boosting innovation within the Indian paper industry.
Future Outlook for Wood Pulp Trade Analysis Market
The global wood pulp trade market is strategically positioned for sustained and significant growth in the coming years. This upward trajectory is fundamentally underpinned by the escalating global demand for sustainable packaging solutions, driven by both consumer awareness and corporate responsibility initiatives. Concurrently, ongoing advancements in pulp production technologies are continuously enhancing efficiency, reducing environmental impact, and enabling the development of novel pulp applications. Strategic collaborations among industry stakeholders and sustained investments in cutting-edge research and development will be pivotal in shaping the future landscape of the wood pulp industry. These efforts are expected to unlock new avenues for growth, foster groundbreaking innovations, and create a more resilient and sustainable market. The market is projected to achieve a substantial valuation of approximately [Insert Specific Number] Million by 2033, signifying a considerable expansion in its overall market size and economic impact.
Wood Pulp Trade Analysis Segmentation
- 1. Production Analysis
- 2. Consumption Analysis
- 3. Import Market Analysis (Value & Volume)
- 4. Export Market Analysis (Value & Volume)
- 5. Price Trend Analysis
Wood Pulp Trade Analysis Segmentation By Geography
-
1. North America
- 1.1. United States
- 1.2. Canada
- 1.3. Mexico
-
2. Europe
- 2.1. Germany
- 2.2. United Kingdom
- 2.3. Italy
- 2.4. France
- 2.5. Netherlands
- 2.6. Sweden
- 2.7. Russia
-
3. Asia Pacific
- 3.1. China
- 3.2. Australia
- 3.3. India
- 3.4. South Korea
- 3.5. Japan
- 3.6. Indonesia
-
4. South America
- 4.1. Brazil
- 4.2. Chile
-
5. Africa
- 5.1. South Africa
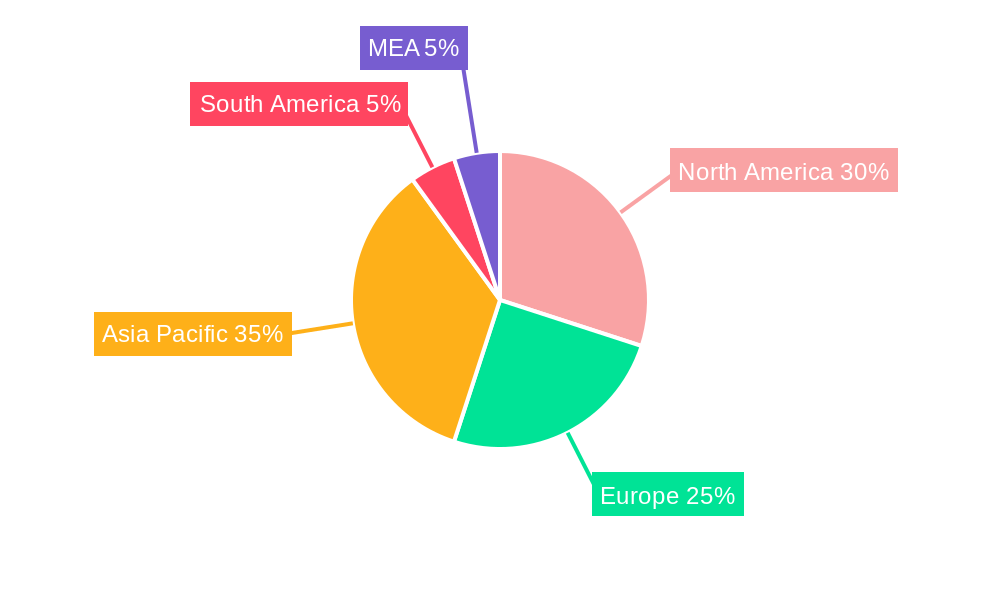
Wood Pulp Trade Analysis Regional Market Share
Geographic Coverage of Wood Pulp Trade Analysis
Wood Pulp Trade Analysis REPORT HIGHLIGHTS
| Aspects | Details |
|---|---|
| Study Period | 2020-2034 |
| Base Year | 2025 |
| Estimated Year | 2026 |
| Forecast Period | 2026-2034 |
| Historical Period | 2020-2025 |
| Growth Rate | CAGR of 2.7% from 2020-2034 |
| Segmentation |
|
Table of Contents
- 1. Introduction
- 1.1. Research Scope
- 1.2. Market Segmentation
- 1.3. Research Methodology
- 1.4. Definitions and Assumptions
- 2. Executive Summary
- 2.1. Introduction
- 3. Market Dynamics
- 3.1. Introduction
- 3.2. Market Drivers
- 3.2.1. ; Increasing Food Security Concerns; Inclination Toward a Healthy Lifestyle
- 3.3. Market Restrains
- 3.3.1. ; Unfavorable Climatic Conditions; Higher Market Entry Cost
- 3.4. Market Trends
- 3.4.1. Huge Demand in Packaging and Industrial Papers
- 4. Market Factor Analysis
- 4.1. Porters Five Forces
- 4.2. Supply/Value Chain
- 4.3. PESTEL analysis
- 4.4. Market Entropy
- 4.5. Patent/Trademark Analysis
- 5. Global Wood Pulp Trade Analysis Analysis, Insights and Forecast, 2020-2032
- 5.1. Market Analysis, Insights and Forecast - by Production Analysis
- 5.2. Market Analysis, Insights and Forecast - by Consumption Analysis
- 5.3. Market Analysis, Insights and Forecast - by Import Market Analysis (Value & Volume)
- 5.4. Market Analysis, Insights and Forecast - by Export Market Analysis (Value & Volume)
- 5.5. Market Analysis, Insights and Forecast - by Price Trend Analysis
- 5.6. Market Analysis, Insights and Forecast - by Region
- 5.6.1. North America
- 5.6.2. Europe
- 5.6.3. Asia Pacific
- 5.6.4. South America
- 5.6.5. Africa
- 5.1. Market Analysis, Insights and Forecast - by Production Analysis
- 6. North America Wood Pulp Trade Analysis Analysis, Insights and Forecast, 2020-2032
- 6.1. Market Analysis, Insights and Forecast - by Production Analysis
- 6.2. Market Analysis, Insights and Forecast - by Consumption Analysis
- 6.3. Market Analysis, Insights and Forecast - by Import Market Analysis (Value & Volume)
- 6.4. Market Analysis, Insights and Forecast - by Export Market Analysis (Value & Volume)
- 6.5. Market Analysis, Insights and Forecast - by Price Trend Analysis
- 6.1. Market Analysis, Insights and Forecast - by Production Analysis
- 7. Europe Wood Pulp Trade Analysis Analysis, Insights and Forecast, 2020-2032
- 7.1. Market Analysis, Insights and Forecast - by Production Analysis
- 7.2. Market Analysis, Insights and Forecast - by Consumption Analysis
- 7.3. Market Analysis, Insights and Forecast - by Import Market Analysis (Value & Volume)
- 7.4. Market Analysis, Insights and Forecast - by Export Market Analysis (Value & Volume)
- 7.5. Market Analysis, Insights and Forecast - by Price Trend Analysis
- 7.1. Market Analysis, Insights and Forecast - by Production Analysis
- 8. Asia Pacific Wood Pulp Trade Analysis Analysis, Insights and Forecast, 2020-2032
- 8.1. Market Analysis, Insights and Forecast - by Production Analysis
- 8.2. Market Analysis, Insights and Forecast - by Consumption Analysis
- 8.3. Market Analysis, Insights and Forecast - by Import Market Analysis (Value & Volume)
- 8.4. Market Analysis, Insights and Forecast - by Export Market Analysis (Value & Volume)
- 8.5. Market Analysis, Insights and Forecast - by Price Trend Analysis
- 8.1. Market Analysis, Insights and Forecast - by Production Analysis
- 9. South America Wood Pulp Trade Analysis Analysis, Insights and Forecast, 2020-2032
- 9.1. Market Analysis, Insights and Forecast - by Production Analysis
- 9.2. Market Analysis, Insights and Forecast - by Consumption Analysis
- 9.3. Market Analysis, Insights and Forecast - by Import Market Analysis (Value & Volume)
- 9.4. Market Analysis, Insights and Forecast - by Export Market Analysis (Value & Volume)
- 9.5. Market Analysis, Insights and Forecast - by Price Trend Analysis
- 9.1. Market Analysis, Insights and Forecast - by Production Analysis
- 10. Africa Wood Pulp Trade Analysis Analysis, Insights and Forecast, 2020-2032
- 10.1. Market Analysis, Insights and Forecast - by Production Analysis
- 10.2. Market Analysis, Insights and Forecast - by Consumption Analysis
- 10.3. Market Analysis, Insights and Forecast - by Import Market Analysis (Value & Volume)
- 10.4. Market Analysis, Insights and Forecast - by Export Market Analysis (Value & Volume)
- 10.5. Market Analysis, Insights and Forecast - by Price Trend Analysis
- 10.1. Market Analysis, Insights and Forecast - by Production Analysis
- 11. Competitive Analysis
- 11.1. Global Market Share Analysis 2025
- 11.2. Company Profiles
- 11.2.1 Kimberly-Clark
- 11.2.1.1. Overview
- 11.2.1.2. Products
- 11.2.1.3. SWOT Analysis
- 11.2.1.4. Recent Developments
- 11.2.1.5. Financials (Based on Availability)
- 11.2.2 Procter & Gamble
- 11.2.2.1. Overview
- 11.2.2.2. Products
- 11.2.2.3. SWOT Analysis
- 11.2.2.4. Recent Developments
- 11.2.2.5. Financials (Based on Availability)
- 11.2.3 Georgia-Pacific
- 11.2.3.1. Overview
- 11.2.3.2. Products
- 11.2.3.3. SWOT Analysis
- 11.2.3.4. Recent Developments
- 11.2.3.5. Financials (Based on Availability)
- 11.2.4 International Paper
- 11.2.4.1. Overview
- 11.2.4.2. Products
- 11.2.4.3. SWOT Analysis
- 11.2.4.4. Recent Developments
- 11.2.4.5. Financials (Based on Availability)
- 11.2.5 UPM
- 11.2.5.1. Overview
- 11.2.5.2. Products
- 11.2.5.3. SWOT Analysis
- 11.2.5.4. Recent Developments
- 11.2.5.5. Financials (Based on Availability)
- 11.2.1 Kimberly-Clark
List of Figures
- Figure 1: Global Wood Pulp Trade Analysis Revenue Breakdown (billion, %) by Region 2025 & 2033
- Figure 2: North America Wood Pulp Trade Analysis Revenue (billion), by Production Analysis 2025 & 2033
- Figure 3: North America Wood Pulp Trade Analysis Revenue Share (%), by Production Analysis 2025 & 2033
- Figure 4: North America Wood Pulp Trade Analysis Revenue (billion), by Consumption Analysis 2025 & 2033
- Figure 5: North America Wood Pulp Trade Analysis Revenue Share (%), by Consumption Analysis 2025 & 2033
- Figure 6: North America Wood Pulp Trade Analysis Revenue (billion), by Import Market Analysis (Value & Volume) 2025 & 2033
- Figure 7: North America Wood Pulp Trade Analysis Revenue Share (%), by Import Market Analysis (Value & Volume) 2025 & 2033
- Figure 8: North America Wood Pulp Trade Analysis Revenue (billion), by Export Market Analysis (Value & Volume) 2025 & 2033
- Figure 9: North America Wood Pulp Trade Analysis Revenue Share (%), by Export Market Analysis (Value & Volume) 2025 & 2033
- Figure 10: North America Wood Pulp Trade Analysis Revenue (billion), by Price Trend Analysis 2025 & 2033
- Figure 11: North America Wood Pulp Trade Analysis Revenue Share (%), by Price Trend Analysis 2025 & 2033
- Figure 12: North America Wood Pulp Trade Analysis Revenue (billion), by Country 2025 & 2033
- Figure 13: North America Wood Pulp Trade Analysis Revenue Share (%), by Country 2025 & 2033
- Figure 14: Europe Wood Pulp Trade Analysis Revenue (billion), by Production Analysis 2025 & 2033
- Figure 15: Europe Wood Pulp Trade Analysis Revenue Share (%), by Production Analysis 2025 & 2033
- Figure 16: Europe Wood Pulp Trade Analysis Revenue (billion), by Consumption Analysis 2025 & 2033
- Figure 17: Europe Wood Pulp Trade Analysis Revenue Share (%), by Consumption Analysis 2025 & 2033
- Figure 18: Europe Wood Pulp Trade Analysis Revenue (billion), by Import Market Analysis (Value & Volume) 2025 & 2033
- Figure 19: Europe Wood Pulp Trade Analysis Revenue Share (%), by Import Market Analysis (Value & Volume) 2025 & 2033
- Figure 20: Europe Wood Pulp Trade Analysis Revenue (billion), by Export Market Analysis (Value & Volume) 2025 & 2033
- Figure 21: Europe Wood Pulp Trade Analysis Revenue Share (%), by Export Market Analysis (Value & Volume) 2025 & 2033
- Figure 22: Europe Wood Pulp Trade Analysis Revenue (billion), by Price Trend Analysis 2025 & 2033
- Figure 23: Europe Wood Pulp Trade Analysis Revenue Share (%), by Price Trend Analysis 2025 & 2033
- Figure 24: Europe Wood Pulp Trade Analysis Revenue (billion), by Country 2025 & 2033
- Figure 25: Europe Wood Pulp Trade Analysis Revenue Share (%), by Country 2025 & 2033
- Figure 26: Asia Pacific Wood Pulp Trade Analysis Revenue (billion), by Production Analysis 2025 & 2033
- Figure 27: Asia Pacific Wood Pulp Trade Analysis Revenue Share (%), by Production Analysis 2025 & 2033
- Figure 28: Asia Pacific Wood Pulp Trade Analysis Revenue (billion), by Consumption Analysis 2025 & 2033
- Figure 29: Asia Pacific Wood Pulp Trade Analysis Revenue Share (%), by Consumption Analysis 2025 & 2033
- Figure 30: Asia Pacific Wood Pulp Trade Analysis Revenue (billion), by Import Market Analysis (Value & Volume) 2025 & 2033
- Figure 31: Asia Pacific Wood Pulp Trade Analysis Revenue Share (%), by Import Market Analysis (Value & Volume) 2025 & 2033
- Figure 32: Asia Pacific Wood Pulp Trade Analysis Revenue (billion), by Export Market Analysis (Value & Volume) 2025 & 2033
- Figure 33: Asia Pacific Wood Pulp Trade Analysis Revenue Share (%), by Export Market Analysis (Value & Volume) 2025 & 2033
- Figure 34: Asia Pacific Wood Pulp Trade Analysis Revenue (billion), by Price Trend Analysis 2025 & 2033
- Figure 35: Asia Pacific Wood Pulp Trade Analysis Revenue Share (%), by Price Trend Analysis 2025 & 2033
- Figure 36: Asia Pacific Wood Pulp Trade Analysis Revenue (billion), by Country 2025 & 2033
- Figure 37: Asia Pacific Wood Pulp Trade Analysis Revenue Share (%), by Country 2025 & 2033
- Figure 38: South America Wood Pulp Trade Analysis Revenue (billion), by Production Analysis 2025 & 2033
- Figure 39: South America Wood Pulp Trade Analysis Revenue Share (%), by Production Analysis 2025 & 2033
- Figure 40: South America Wood Pulp Trade Analysis Revenue (billion), by Consumption Analysis 2025 & 2033
- Figure 41: South America Wood Pulp Trade Analysis Revenue Share (%), by Consumption Analysis 2025 & 2033
- Figure 42: South America Wood Pulp Trade Analysis Revenue (billion), by Import Market Analysis (Value & Volume) 2025 & 2033
- Figure 43: South America Wood Pulp Trade Analysis Revenue Share (%), by Import Market Analysis (Value & Volume) 2025 & 2033
- Figure 44: South America Wood Pulp Trade Analysis Revenue (billion), by Export Market Analysis (Value & Volume) 2025 & 2033
- Figure 45: South America Wood Pulp Trade Analysis Revenue Share (%), by Export Market Analysis (Value & Volume) 2025 & 2033
- Figure 46: South America Wood Pulp Trade Analysis Revenue (billion), by Price Trend Analysis 2025 & 2033
- Figure 47: South America Wood Pulp Trade Analysis Revenue Share (%), by Price Trend Analysis 2025 & 2033
- Figure 48: South America Wood Pulp Trade Analysis Revenue (billion), by Country 2025 & 2033
- Figure 49: South America Wood Pulp Trade Analysis Revenue Share (%), by Country 2025 & 2033
- Figure 50: Africa Wood Pulp Trade Analysis Revenue (billion), by Production Analysis 2025 & 2033
- Figure 51: Africa Wood Pulp Trade Analysis Revenue Share (%), by Production Analysis 2025 & 2033
- Figure 52: Africa Wood Pulp Trade Analysis Revenue (billion), by Consumption Analysis 2025 & 2033
- Figure 53: Africa Wood Pulp Trade Analysis Revenue Share (%), by Consumption Analysis 2025 & 2033
- Figure 54: Africa Wood Pulp Trade Analysis Revenue (billion), by Import Market Analysis (Value & Volume) 2025 & 2033
- Figure 55: Africa Wood Pulp Trade Analysis Revenue Share (%), by Import Market Analysis (Value & Volume) 2025 & 2033
- Figure 56: Africa Wood Pulp Trade Analysis Revenue (billion), by Export Market Analysis (Value & Volume) 2025 & 2033
- Figure 57: Africa Wood Pulp Trade Analysis Revenue Share (%), by Export Market Analysis (Value & Volume) 2025 & 2033
- Figure 58: Africa Wood Pulp Trade Analysis Revenue (billion), by Price Trend Analysis 2025 & 2033
- Figure 59: Africa Wood Pulp Trade Analysis Revenue Share (%), by Price Trend Analysis 2025 & 2033
- Figure 60: Africa Wood Pulp Trade Analysis Revenue (billion), by Country 2025 & 2033
- Figure 61: Africa Wood Pulp Trade Analysis Revenue Share (%), by Country 2025 & 2033
List of Tables
- Table 1: Global Wood Pulp Trade Analysis Revenue billion Forecast, by Production Analysis 2020 & 2033
- Table 2: Global Wood Pulp Trade Analysis Revenue billion Forecast, by Consumption Analysis 2020 & 2033
- Table 3: Global Wood Pulp Trade Analysis Revenue billion Forecast, by Import Market Analysis (Value & Volume) 2020 & 2033
- Table 4: Global Wood Pulp Trade Analysis Revenue billion Forecast, by Export Market Analysis (Value & Volume) 2020 & 2033
- Table 5: Global Wood Pulp Trade Analysis Revenue billion Forecast, by Price Trend Analysis 2020 & 2033
- Table 6: Global Wood Pulp Trade Analysis Revenue billion Forecast, by Region 2020 & 2033
- Table 7: Global Wood Pulp Trade Analysis Revenue billion Forecast, by Production Analysis 2020 & 2033
- Table 8: Global Wood Pulp Trade Analysis Revenue billion Forecast, by Consumption Analysis 2020 & 2033
- Table 9: Global Wood Pulp Trade Analysis Revenue billion Forecast, by Import Market Analysis (Value & Volume) 2020 & 2033
- Table 10: Global Wood Pulp Trade Analysis Revenue billion Forecast, by Export Market Analysis (Value & Volume) 2020 & 2033
- Table 11: Global Wood Pulp Trade Analysis Revenue billion Forecast, by Price Trend Analysis 2020 & 2033
- Table 12: Global Wood Pulp Trade Analysis Revenue billion Forecast, by Country 2020 & 2033
- Table 13: United States Wood Pulp Trade Analysis Revenue (billion) Forecast, by Application 2020 & 2033
- Table 14: Canada Wood Pulp Trade Analysis Revenue (billion) Forecast, by Application 2020 & 2033
- Table 15: Mexico Wood Pulp Trade Analysis Revenue (billion) Forecast, by Application 2020 & 2033
- Table 16: Global Wood Pulp Trade Analysis Revenue billion Forecast, by Production Analysis 2020 & 2033
- Table 17: Global Wood Pulp Trade Analysis Revenue billion Forecast, by Consumption Analysis 2020 & 2033
- Table 18: Global Wood Pulp Trade Analysis Revenue billion Forecast, by Import Market Analysis (Value & Volume) 2020 & 2033
- Table 19: Global Wood Pulp Trade Analysis Revenue billion Forecast, by Export Market Analysis (Value & Volume) 2020 & 2033
- Table 20: Global Wood Pulp Trade Analysis Revenue billion Forecast, by Price Trend Analysis 2020 & 2033
- Table 21: Global Wood Pulp Trade Analysis Revenue billion Forecast, by Country 2020 & 2033
- Table 22: Germany Wood Pulp Trade Analysis Revenue (billion) Forecast, by Application 2020 & 2033
- Table 23: United Kingdom Wood Pulp Trade Analysis Revenue (billion) Forecast, by Application 2020 & 2033
- Table 24: Italy Wood Pulp Trade Analysis Revenue (billion) Forecast, by Application 2020 & 2033
- Table 25: France Wood Pulp Trade Analysis Revenue (billion) Forecast, by Application 2020 & 2033
- Table 26: Netherlands Wood Pulp Trade Analysis Revenue (billion) Forecast, by Application 2020 & 2033
- Table 27: Sweden Wood Pulp Trade Analysis Revenue (billion) Forecast, by Application 2020 & 2033
- Table 28: Russia Wood Pulp Trade Analysis Revenue (billion) Forecast, by Application 2020 & 2033
- Table 29: Global Wood Pulp Trade Analysis Revenue billion Forecast, by Production Analysis 2020 & 2033
- Table 30: Global Wood Pulp Trade Analysis Revenue billion Forecast, by Consumption Analysis 2020 & 2033
- Table 31: Global Wood Pulp Trade Analysis Revenue billion Forecast, by Import Market Analysis (Value & Volume) 2020 & 2033
- Table 32: Global Wood Pulp Trade Analysis Revenue billion Forecast, by Export Market Analysis (Value & Volume) 2020 & 2033
- Table 33: Global Wood Pulp Trade Analysis Revenue billion Forecast, by Price Trend Analysis 2020 & 2033
- Table 34: Global Wood Pulp Trade Analysis Revenue billion Forecast, by Country 2020 & 2033
- Table 35: China Wood Pulp Trade Analysis Revenue (billion) Forecast, by Application 2020 & 2033
- Table 36: Australia Wood Pulp Trade Analysis Revenue (billion) Forecast, by Application 2020 & 2033
- Table 37: India Wood Pulp Trade Analysis Revenue (billion) Forecast, by Application 2020 & 2033
- Table 38: South Korea Wood Pulp Trade Analysis Revenue (billion) Forecast, by Application 2020 & 2033
- Table 39: Japan Wood Pulp Trade Analysis Revenue (billion) Forecast, by Application 2020 & 2033
- Table 40: Indonesia Wood Pulp Trade Analysis Revenue (billion) Forecast, by Application 2020 & 2033
- Table 41: Global Wood Pulp Trade Analysis Revenue billion Forecast, by Production Analysis 2020 & 2033
- Table 42: Global Wood Pulp Trade Analysis Revenue billion Forecast, by Consumption Analysis 2020 & 2033
- Table 43: Global Wood Pulp Trade Analysis Revenue billion Forecast, by Import Market Analysis (Value & Volume) 2020 & 2033
- Table 44: Global Wood Pulp Trade Analysis Revenue billion Forecast, by Export Market Analysis (Value & Volume) 2020 & 2033
- Table 45: Global Wood Pulp Trade Analysis Revenue billion Forecast, by Price Trend Analysis 2020 & 2033
- Table 46: Global Wood Pulp Trade Analysis Revenue billion Forecast, by Country 2020 & 2033
- Table 47: Brazil Wood Pulp Trade Analysis Revenue (billion) Forecast, by Application 2020 & 2033
- Table 48: Chile Wood Pulp Trade Analysis Revenue (billion) Forecast, by Application 2020 & 2033
- Table 49: Global Wood Pulp Trade Analysis Revenue billion Forecast, by Production Analysis 2020 & 2033
- Table 50: Global Wood Pulp Trade Analysis Revenue billion Forecast, by Consumption Analysis 2020 & 2033
- Table 51: Global Wood Pulp Trade Analysis Revenue billion Forecast, by Import Market Analysis (Value & Volume) 2020 & 2033
- Table 52: Global Wood Pulp Trade Analysis Revenue billion Forecast, by Export Market Analysis (Value & Volume) 2020 & 2033
- Table 53: Global Wood Pulp Trade Analysis Revenue billion Forecast, by Price Trend Analysis 2020 & 2033
- Table 54: Global Wood Pulp Trade Analysis Revenue billion Forecast, by Country 2020 & 2033
- Table 55: South Africa Wood Pulp Trade Analysis Revenue (billion) Forecast, by Application 2020 & 2033
Frequently Asked Questions
1. What is the projected Compound Annual Growth Rate (CAGR) of the Wood Pulp Trade Analysis?
The projected CAGR is approximately 2.7%.
2. Which companies are prominent players in the Wood Pulp Trade Analysis?
Key companies in the market include Kimberly-Clark , Procter & Gamble , Georgia-Pacific, International Paper , UPM .
3. What are the main segments of the Wood Pulp Trade Analysis?
The market segments include Production Analysis, Consumption Analysis, Import Market Analysis (Value & Volume), Export Market Analysis (Value & Volume), Price Trend Analysis.
4. Can you provide details about the market size?
The market size is estimated to be USD 166.65 billion as of 2022.
5. What are some drivers contributing to market growth?
; Increasing Food Security Concerns; Inclination Toward a Healthy Lifestyle.
6. What are the notable trends driving market growth?
Huge Demand in Packaging and Industrial Papers.
7. Are there any restraints impacting market growth?
; Unfavorable Climatic Conditions; Higher Market Entry Cost.
8. Can you provide examples of recent developments in the market?
December 2022: The Indian Institute of Technology (IIT) Roorkee, in association with Shah Paper Mills Limited, launched a new project to develop the advanced packaging research laboratory and skill development program at the Department of Paper Technology, Saharanpur Campus. The institute has been fostering collaboration with paper industries from India, focusing on providing cutting-edge innovation research and skill development globally.
9. What pricing options are available for accessing the report?
Pricing options include single-user, multi-user, and enterprise licenses priced at USD 4750, USD 5250, and USD 8750 respectively.
10. Is the market size provided in terms of value or volume?
The market size is provided in terms of value, measured in billion.
11. Are there any specific market keywords associated with the report?
Yes, the market keyword associated with the report is "Wood Pulp Trade Analysis," which aids in identifying and referencing the specific market segment covered.
12. How do I determine which pricing option suits my needs best?
The pricing options vary based on user requirements and access needs. Individual users may opt for single-user licenses, while businesses requiring broader access may choose multi-user or enterprise licenses for cost-effective access to the report.
13. Are there any additional resources or data provided in the Wood Pulp Trade Analysis report?
While the report offers comprehensive insights, it's advisable to review the specific contents or supplementary materials provided to ascertain if additional resources or data are available.
14. How can I stay updated on further developments or reports in the Wood Pulp Trade Analysis?
To stay informed about further developments, trends, and reports in the Wood Pulp Trade Analysis, consider subscribing to industry newsletters, following relevant companies and organizations, or regularly checking reputable industry news sources and publications.
Methodology
Step 1 - Identification of Relevant Samples Size from Population Database


Step 2 - Approaches for Defining Global Market Size (Value, Volume* & Price*)

Note*: In applicable scenarios
Step 3 - Data Sources
Primary Research
- Web Analytics
- Survey Reports
- Research Institute
- Latest Research Reports
- Opinion Leaders
Secondary Research
- Annual Reports
- White Paper
- Latest Press Release
- Industry Association
- Paid Database
- Investor Presentations

Step 4 - Data Triangulation
Involves using different sources of information in order to increase the validity of a study
These sources are likely to be stakeholders in a program - participants, other researchers, program staff, other community members, and so on.
Then we put all data in single framework & apply various statistical tools to find out the dynamic on the market.
During the analysis stage, feedback from the stakeholder groups would be compared to determine areas of agreement as well as areas of divergence