

Key Insights
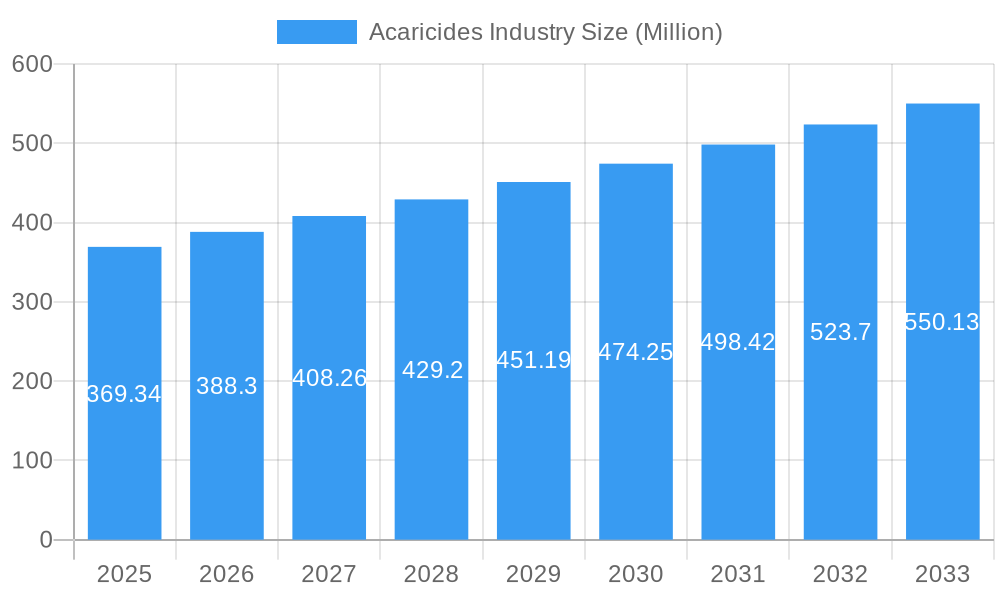
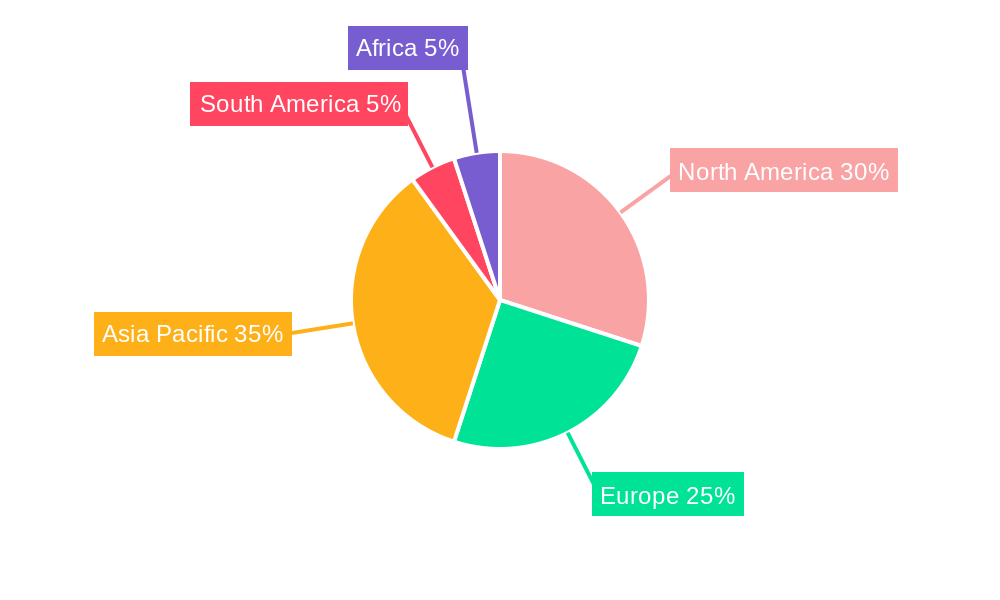
The global acaricide market, valued at $369.34 million in 2025, is projected to experience robust growth, driven by a compound annual growth rate (CAGR) of 5.00% from 2025 to 2033. This expansion is fueled by several key factors. The increasing prevalence of acaricide-resistant mites and ticks necessitates the development and adoption of new and effective acaricides, stimulating market growth. Furthermore, the rising demand for high-yield agricultural products and the growing awareness of vector-borne diseases are pushing the use of acaricides in both agricultural and public health sectors. Significant advancements in acaricide technology, including the development of more targeted and environmentally friendly formulations, further contribute to market expansion. The market is segmented by chemical type (organophosphates, carbamates, organochlorines, pyrethrins, pyrethroids, and others) and application (spray, dipping, hand dressing, and others). Organophosphates and pyrethroids currently dominate the market due to their efficacy and cost-effectiveness, however, the growing concerns regarding environmental impact and resistance are driving the demand for alternative acaricides. The geographical distribution reflects a significant market presence in North America and Europe, driven by established agricultural practices and stringent regulations. However, the Asia-Pacific region is expected to witness substantial growth in the coming years due to increasing agricultural activities and rising disposable incomes.
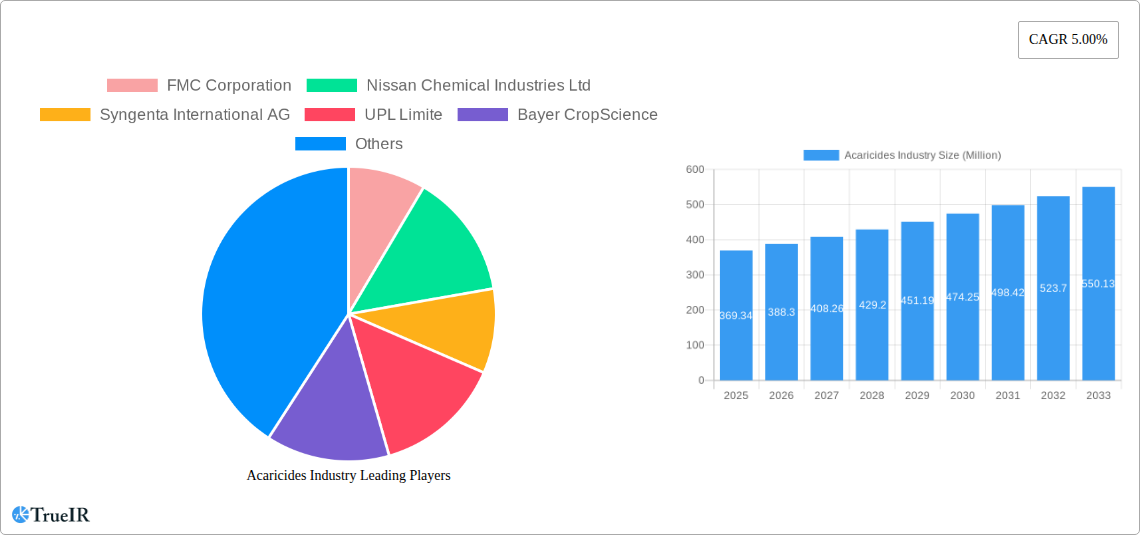
Acaricides Industry Market Size (In Million)
The competitive landscape is characterized by the presence of major players like FMC Corporation, Nissan Chemical Industries Ltd, Syngenta International AG, UPL Limited, Bayer CropScience, Corteva Agriscience, and BASF SE. These companies are actively involved in research and development, focusing on innovative acaricide formulations and expanding their market reach through strategic partnerships and acquisitions. The future of the acaricide market is anticipated to be shaped by factors like stricter environmental regulations, the ongoing development of integrated pest management strategies, and the continuous emergence of acaricide-resistant pests. Companies will need to adapt to these challenges by investing in sustainable and effective acaricide solutions and engaging in responsible product stewardship. The market is poised for growth as the demand for pest control solutions continues to increase globally.
Acaricides Industry Company Market Share
This comprehensive report provides an in-depth analysis of the global acaricide market, projecting a robust growth trajectory from 2025 to 2033. Valued at $XX Million in 2025, the market is poised for significant expansion, driven by technological advancements, evolving agricultural practices, and increasing pest infestations. This report offers critical insights into market segmentation, competitive dynamics, and future trends, equipping stakeholders with actionable intelligence for informed decision-making.
Acaricides Industry Market Structure & Competitive Landscape
The acaricide market exhibits a moderately concentrated structure, with a few key players holding significant market share. FMC Corporation, Nissan Chemical Industries Ltd, Syngenta International AG, UPL Limited, Bayer CropScience, Corteva Agriscience, and BASF SE are amongst the dominant players, shaping the competitive landscape through continuous innovation and strategic acquisitions. The Herfindahl-Hirschman Index (HHI) for the market is estimated at XX, indicating a moderately concentrated industry. Innovation in acaricide formulations, driven by the need for enhanced efficacy and reduced environmental impact, is a key driver. Stringent regulatory frameworks concerning pesticide usage and environmental protection significantly impact market dynamics. The presence of bio-acaricides and other natural alternatives presents a competitive pressure, yet also indicates opportunities for sustainable solutions. Mergers and acquisitions (M&A) activity has been relatively high in the recent years (XX Million in value over the past five years), as companies seek to expand their product portfolio and geographic reach. The market is further segmented by end-users such as large-scale farms, smallholder farmers and greenhouse cultivators, each with unique needs and preferences.
Acaricides Industry Market Trends & Opportunities
The global acaricide market is experiencing robust growth, projected to achieve a Compound Annual Growth Rate (CAGR) of XX% during the forecast period (2025-2033), with an estimated market value reaching $XX Million by 2033. This upward trajectory is propelled by a confluence of critical factors. The escalating prevalence of acaricide-resistant mite species is a significant driver, spurring innovation and the adoption of novel, highly effective acaricide formulations. Simultaneously, the intensifying global demand for high-yielding crops necessitates advanced pest control solutions to maximize agricultural productivity and profitability. Growing farmer awareness regarding the vital importance of comprehensive crop protection further reinforces the adoption of acaricide treatments to mitigate crop losses. Technological advancements are revolutionizing the sector, with the emergence of sophisticated delivery systems and advanced formulations like nano-acaricides and targeted delivery mechanisms designed to enhance efficacy while minimizing environmental impact. Despite these promising trends, the market navigates significant challenges, including increasingly stringent regulatory frameworks governing pesticide use, a discernible consumer shift towards organically produced food, and growing societal concerns regarding the sustainability of chemical interventions in agriculture.
Market penetration rates for different acaricide types exhibit considerable regional and crop-specific variations. Higher penetration is typically observed in the cultivation of high-value crops and in geographical areas where acaricide resistance is a more prevalent issue.
Dominant Markets & Segments in Acaricides Industry
The acaricide market displays regional variations in dominance. Asia-Pacific is currently the largest market, followed by North America and Europe. Within chemical types, Pyrethroids currently hold the largest market share, owing to their high efficacy and relatively lower environmental impact compared to some older generations of acaricides, though Organophosphates and Carbamates still hold relevance in certain regions and applications. However, the “Other Chemical Types” segment, encompassing newer technologies and bio-pesticides, is expected to demonstrate the fastest growth in coming years.
Key Growth Drivers:
- Asia-Pacific: Rapidly expanding agricultural sector, high crop yields, increasing pest infestation and favorable regulatory climate.
- Pyrethroids: High efficacy against broad spectrum of mites, relatively lower environmental impact compared to organophosphates.
- Spray Application: Most common application method, owing to its efficiency and wide applicability across different farm sizes and landscapes.
Further analysis reveals that while spray application is the leading method, dipping and hand dressing methods maintain significance in specific segments, and other methods represent newer and emerging trends within the industry.
Acaricides Industry Product Analysis
Recent product innovations focus on enhancing efficacy, reducing environmental impact, and improving target specificity. This includes the development of novel formulations (e.g., microencapsulated acaricides), targeted delivery systems (e.g., systemic acaricides), and the integration of acaricides with other pest control agents. These advancements improve pest control efficacy and reduce off-target effects, aligning with the growing consumer demand for safer and more sustainable pest management solutions.
Key Drivers, Barriers & Challenges in Acaricides Industry
Key Drivers:
- The escalating global demand for high-yield crops to ensure food security for a growing population.
- The increasing challenge posed by pest resistance, necessitating the development and deployment of effective and adaptive pest management solutions.
- Continuous technological advancements in both acaricide formulations and sophisticated delivery systems, enhancing product performance and application efficiency.
- A growing global emphasis on protecting crop yields against mite infestations, particularly in staple and high-value agricultural produce.
Challenges and Restraints:
- Stringent regulatory frameworks worldwide, which impose higher registration costs and extend lead times for new product approvals. This directly impacts the pace of innovation and increases the overall cost of bringing new solutions to market.
- Vulnerability to supply chain disruptions and volatile raw material prices, which significantly influence production costs and market stability. For instance, raw material costs saw an average increase of XX% in 2024, impacting profit margins.
- The burgeoning consumer preference for organically grown and sustainably produced food, driving a demand for bio-acaricides and other environmentally benign alternatives.
- Concerns about potential environmental impacts and the development of resistance in non-target organisms, necessitating careful product stewardship and research into integrated pest management strategies.
Growth Drivers in the Acaricides Industry Market
The market growth is primarily fueled by factors such as the expanding agricultural sector globally, leading to an increase in the demand for efficient pest management solutions. Technological advancements in acaricide formulations and delivery methods are enabling more targeted and environmentally friendly pest control. Moreover, favorable government regulations and policies in several regions are promoting the adoption of acaricide solutions.
Challenges Impacting Acaricides Industry Growth
Major challenges include stringent environmental regulations hindering the introduction of new products, increasing costs associated with new product registration and approval processes. Fluctuations in raw material prices add to the uncertainty in the market. Growing consumer preference for sustainable and organic farming poses additional challenges to conventional acaricide-based solutions.
Key Players Shaping the Acaricides Industry Market
- FMC Corporation
- Nissan Chemical Industries Ltd.
- Syngenta International AG
- UPL Limited
- Bayer CropScience
- Corteva Agriscience
- BASF SE
- Sumitomo Chemical Co., Ltd.
- Valent Biosciences Corporation
Significant Acaricides Industry Milestones
- 2022: Launch of a new pyrethroid-based acaricide with enhanced efficacy and reduced environmental impact by FMC Corporation.
- 2023: Acquisition of a smaller acaricide manufacturer by Syngenta, expanding its product portfolio and market reach.
- 2024: Introduction of stricter environmental regulations in the European Union affecting the registration of certain acaricide formulations.
Future Outlook for Acaricides Industry Market
The acaricide market is poised for sustained expansion, fueled by persistent challenges such as increasing pest resistance, ongoing technological innovations, and the unwavering global demand for food security. Strategic collaborations, significant investments in research and development, and a concerted effort towards developing more sustainable and environmentally conscious acaricide solutions will be paramount in shaping the future landscape of this market. A notable trend anticipated is a gradual shift towards the increased adoption of biopesticides and other eco-friendly alternatives, running in parallel with continued innovation in conventional acaricide formulations. The industry's future will likely be characterized by a dual approach: enhancing the efficacy and sustainability of existing chemical solutions while actively developing and integrating biological control agents and integrated pest management (IPM) strategies to meet evolving regulatory, environmental, and consumer expectations.
Acaricides Industry Segmentation
- 1. Production Analysis
- 2. Consumption Analysis
- 3. Import Market Analysis (Value & Volume)
- 4. Export Market Analysis (Value & Volume)
- 5. Price Trend Analysis
Acaricides Industry Segmentation By Geography
-
1. North America
- 1.1. United States
- 1.2. Canada
- 1.3. Mexico
-
2. South America
- 2.1. Brazil
- 2.2. Argentina
- 2.3. Rest of South America
-
3. Europe
- 3.1. United Kingdom
- 3.2. Germany
- 3.3. France
- 3.4. Italy
- 3.5. Spain
- 3.6. Russia
- 3.7. Benelux
- 3.8. Nordics
- 3.9. Rest of Europe
-
4. Middle East & Africa
- 4.1. Turkey
- 4.2. Israel
- 4.3. GCC
- 4.4. North Africa
- 4.5. South Africa
- 4.6. Rest of Middle East & Africa
-
5. Asia Pacific
- 5.1. China
- 5.2. India
- 5.3. Japan
- 5.4. South Korea
- 5.5. ASEAN
- 5.6. Oceania
- 5.7. Rest of Asia Pacific
Acaricides Industry Regional Market Share
Geographic Coverage of Acaricides Industry
Acaricides Industry REPORT HIGHLIGHTS
| Aspects | Details |
|---|---|
| Study Period | 2020-2034 |
| Base Year | 2025 |
| Estimated Year | 2026 |
| Forecast Period | 2026-2034 |
| Historical Period | 2020-2025 |
| Growth Rate | CAGR of 5.00% from 2020-2034 |
| Segmentation |
|
Table of Contents
- 1. Introduction
- 1.1. Research Scope
- 1.2. Market Segmentation
- 1.3. Research Methodology
- 1.4. Definitions and Assumptions
- 2. Executive Summary
- 2.1. Introduction
- 3. Market Dynamics
- 3.1. Introduction
- 3.2. Market Drivers
- 3.2.1. Shortage of Skilled Labor; Government Support to Enhance Farm Mechanization
- 3.3. Market Restrains
- 3.3.1. Heavy Initial Procurement Cost and High Expenditure on Maintenance
- 3.4. Market Trends
- 3.4.1. Increasing Demand for Natural Products
- 4. Market Factor Analysis
- 4.1. Porters Five Forces
- 4.2. Supply/Value Chain
- 4.3. PESTEL analysis
- 4.4. Market Entropy
- 4.5. Patent/Trademark Analysis
- 5. Global Acaricides Industry Analysis, Insights and Forecast, 2020-2032
- 5.1. Market Analysis, Insights and Forecast - by Production Analysis
- 5.2. Market Analysis, Insights and Forecast - by Consumption Analysis
- 5.3. Market Analysis, Insights and Forecast - by Import Market Analysis (Value & Volume)
- 5.4. Market Analysis, Insights and Forecast - by Export Market Analysis (Value & Volume)
- 5.5. Market Analysis, Insights and Forecast - by Price Trend Analysis
- 5.6. Market Analysis, Insights and Forecast - by Region
- 5.6.1. North America
- 5.6.2. South America
- 5.6.3. Europe
- 5.6.4. Middle East & Africa
- 5.6.5. Asia Pacific
- 5.1. Market Analysis, Insights and Forecast - by Production Analysis
- 6. North America Acaricides Industry Analysis, Insights and Forecast, 2020-2032
- 6.1. Market Analysis, Insights and Forecast - by Production Analysis
- 6.2. Market Analysis, Insights and Forecast - by Consumption Analysis
- 6.3. Market Analysis, Insights and Forecast - by Import Market Analysis (Value & Volume)
- 6.4. Market Analysis, Insights and Forecast - by Export Market Analysis (Value & Volume)
- 6.5. Market Analysis, Insights and Forecast - by Price Trend Analysis
- 6.1. Market Analysis, Insights and Forecast - by Production Analysis
- 7. South America Acaricides Industry Analysis, Insights and Forecast, 2020-2032
- 7.1. Market Analysis, Insights and Forecast - by Production Analysis
- 7.2. Market Analysis, Insights and Forecast - by Consumption Analysis
- 7.3. Market Analysis, Insights and Forecast - by Import Market Analysis (Value & Volume)
- 7.4. Market Analysis, Insights and Forecast - by Export Market Analysis (Value & Volume)
- 7.5. Market Analysis, Insights and Forecast - by Price Trend Analysis
- 7.1. Market Analysis, Insights and Forecast - by Production Analysis
- 8. Europe Acaricides Industry Analysis, Insights and Forecast, 2020-2032
- 8.1. Market Analysis, Insights and Forecast - by Production Analysis
- 8.2. Market Analysis, Insights and Forecast - by Consumption Analysis
- 8.3. Market Analysis, Insights and Forecast - by Import Market Analysis (Value & Volume)
- 8.4. Market Analysis, Insights and Forecast - by Export Market Analysis (Value & Volume)
- 8.5. Market Analysis, Insights and Forecast - by Price Trend Analysis
- 8.1. Market Analysis, Insights and Forecast - by Production Analysis
- 9. Middle East & Africa Acaricides Industry Analysis, Insights and Forecast, 2020-2032
- 9.1. Market Analysis, Insights and Forecast - by Production Analysis
- 9.2. Market Analysis, Insights and Forecast - by Consumption Analysis
- 9.3. Market Analysis, Insights and Forecast - by Import Market Analysis (Value & Volume)
- 9.4. Market Analysis, Insights and Forecast - by Export Market Analysis (Value & Volume)
- 9.5. Market Analysis, Insights and Forecast - by Price Trend Analysis
- 9.1. Market Analysis, Insights and Forecast - by Production Analysis
- 10. Asia Pacific Acaricides Industry Analysis, Insights and Forecast, 2020-2032
- 10.1. Market Analysis, Insights and Forecast - by Production Analysis
- 10.2. Market Analysis, Insights and Forecast - by Consumption Analysis
- 10.3. Market Analysis, Insights and Forecast - by Import Market Analysis (Value & Volume)
- 10.4. Market Analysis, Insights and Forecast - by Export Market Analysis (Value & Volume)
- 10.5. Market Analysis, Insights and Forecast - by Price Trend Analysis
- 10.1. Market Analysis, Insights and Forecast - by Production Analysis
- 11. Competitive Analysis
- 11.1. Global Market Share Analysis 2025
- 11.2. Company Profiles
- 11.2.1 FMC Corporation
- 11.2.1.1. Overview
- 11.2.1.2. Products
- 11.2.1.3. SWOT Analysis
- 11.2.1.4. Recent Developments
- 11.2.1.5. Financials (Based on Availability)
- 11.2.2 Nissan Chemical Industries Ltd
- 11.2.2.1. Overview
- 11.2.2.2. Products
- 11.2.2.3. SWOT Analysis
- 11.2.2.4. Recent Developments
- 11.2.2.5. Financials (Based on Availability)
- 11.2.3 Syngenta International AG
- 11.2.3.1. Overview
- 11.2.3.2. Products
- 11.2.3.3. SWOT Analysis
- 11.2.3.4. Recent Developments
- 11.2.3.5. Financials (Based on Availability)
- 11.2.4 UPL Limite
- 11.2.4.1. Overview
- 11.2.4.2. Products
- 11.2.4.3. SWOT Analysis
- 11.2.4.4. Recent Developments
- 11.2.4.5. Financials (Based on Availability)
- 11.2.5 Bayer CropScience
- 11.2.5.1. Overview
- 11.2.5.2. Products
- 11.2.5.3. SWOT Analysis
- 11.2.5.4. Recent Developments
- 11.2.5.5. Financials (Based on Availability)
- 11.2.6 Corteva Agriscience
- 11.2.6.1. Overview
- 11.2.6.2. Products
- 11.2.6.3. SWOT Analysis
- 11.2.6.4. Recent Developments
- 11.2.6.5. Financials (Based on Availability)
- 11.2.7 BASF SE
- 11.2.7.1. Overview
- 11.2.7.2. Products
- 11.2.7.3. SWOT Analysis
- 11.2.7.4. Recent Developments
- 11.2.7.5. Financials (Based on Availability)
- 11.2.1 FMC Corporation
List of Figures
- Figure 1: Global Acaricides Industry Revenue Breakdown (Million, %) by Region 2025 & 2033
- Figure 2: North America Acaricides Industry Revenue (Million), by Production Analysis 2025 & 2033
- Figure 3: North America Acaricides Industry Revenue Share (%), by Production Analysis 2025 & 2033
- Figure 4: North America Acaricides Industry Revenue (Million), by Consumption Analysis 2025 & 2033
- Figure 5: North America Acaricides Industry Revenue Share (%), by Consumption Analysis 2025 & 2033
- Figure 6: North America Acaricides Industry Revenue (Million), by Import Market Analysis (Value & Volume) 2025 & 2033
- Figure 7: North America Acaricides Industry Revenue Share (%), by Import Market Analysis (Value & Volume) 2025 & 2033
- Figure 8: North America Acaricides Industry Revenue (Million), by Export Market Analysis (Value & Volume) 2025 & 2033
- Figure 9: North America Acaricides Industry Revenue Share (%), by Export Market Analysis (Value & Volume) 2025 & 2033
- Figure 10: North America Acaricides Industry Revenue (Million), by Price Trend Analysis 2025 & 2033
- Figure 11: North America Acaricides Industry Revenue Share (%), by Price Trend Analysis 2025 & 2033
- Figure 12: North America Acaricides Industry Revenue (Million), by Country 2025 & 2033
- Figure 13: North America Acaricides Industry Revenue Share (%), by Country 2025 & 2033
- Figure 14: South America Acaricides Industry Revenue (Million), by Production Analysis 2025 & 2033
- Figure 15: South America Acaricides Industry Revenue Share (%), by Production Analysis 2025 & 2033
- Figure 16: South America Acaricides Industry Revenue (Million), by Consumption Analysis 2025 & 2033
- Figure 17: South America Acaricides Industry Revenue Share (%), by Consumption Analysis 2025 & 2033
- Figure 18: South America Acaricides Industry Revenue (Million), by Import Market Analysis (Value & Volume) 2025 & 2033
- Figure 19: South America Acaricides Industry Revenue Share (%), by Import Market Analysis (Value & Volume) 2025 & 2033
- Figure 20: South America Acaricides Industry Revenue (Million), by Export Market Analysis (Value & Volume) 2025 & 2033
- Figure 21: South America Acaricides Industry Revenue Share (%), by Export Market Analysis (Value & Volume) 2025 & 2033
- Figure 22: South America Acaricides Industry Revenue (Million), by Price Trend Analysis 2025 & 2033
- Figure 23: South America Acaricides Industry Revenue Share (%), by Price Trend Analysis 2025 & 2033
- Figure 24: South America Acaricides Industry Revenue (Million), by Country 2025 & 2033
- Figure 25: South America Acaricides Industry Revenue Share (%), by Country 2025 & 2033
- Figure 26: Europe Acaricides Industry Revenue (Million), by Production Analysis 2025 & 2033
- Figure 27: Europe Acaricides Industry Revenue Share (%), by Production Analysis 2025 & 2033
- Figure 28: Europe Acaricides Industry Revenue (Million), by Consumption Analysis 2025 & 2033
- Figure 29: Europe Acaricides Industry Revenue Share (%), by Consumption Analysis 2025 & 2033
- Figure 30: Europe Acaricides Industry Revenue (Million), by Import Market Analysis (Value & Volume) 2025 & 2033
- Figure 31: Europe Acaricides Industry Revenue Share (%), by Import Market Analysis (Value & Volume) 2025 & 2033
- Figure 32: Europe Acaricides Industry Revenue (Million), by Export Market Analysis (Value & Volume) 2025 & 2033
- Figure 33: Europe Acaricides Industry Revenue Share (%), by Export Market Analysis (Value & Volume) 2025 & 2033
- Figure 34: Europe Acaricides Industry Revenue (Million), by Price Trend Analysis 2025 & 2033
- Figure 35: Europe Acaricides Industry Revenue Share (%), by Price Trend Analysis 2025 & 2033
- Figure 36: Europe Acaricides Industry Revenue (Million), by Country 2025 & 2033
- Figure 37: Europe Acaricides Industry Revenue Share (%), by Country 2025 & 2033
- Figure 38: Middle East & Africa Acaricides Industry Revenue (Million), by Production Analysis 2025 & 2033
- Figure 39: Middle East & Africa Acaricides Industry Revenue Share (%), by Production Analysis 2025 & 2033
- Figure 40: Middle East & Africa Acaricides Industry Revenue (Million), by Consumption Analysis 2025 & 2033
- Figure 41: Middle East & Africa Acaricides Industry Revenue Share (%), by Consumption Analysis 2025 & 2033
- Figure 42: Middle East & Africa Acaricides Industry Revenue (Million), by Import Market Analysis (Value & Volume) 2025 & 2033
- Figure 43: Middle East & Africa Acaricides Industry Revenue Share (%), by Import Market Analysis (Value & Volume) 2025 & 2033
- Figure 44: Middle East & Africa Acaricides Industry Revenue (Million), by Export Market Analysis (Value & Volume) 2025 & 2033
- Figure 45: Middle East & Africa Acaricides Industry Revenue Share (%), by Export Market Analysis (Value & Volume) 2025 & 2033
- Figure 46: Middle East & Africa Acaricides Industry Revenue (Million), by Price Trend Analysis 2025 & 2033
- Figure 47: Middle East & Africa Acaricides Industry Revenue Share (%), by Price Trend Analysis 2025 & 2033
- Figure 48: Middle East & Africa Acaricides Industry Revenue (Million), by Country 2025 & 2033
- Figure 49: Middle East & Africa Acaricides Industry Revenue Share (%), by Country 2025 & 2033
- Figure 50: Asia Pacific Acaricides Industry Revenue (Million), by Production Analysis 2025 & 2033
- Figure 51: Asia Pacific Acaricides Industry Revenue Share (%), by Production Analysis 2025 & 2033
- Figure 52: Asia Pacific Acaricides Industry Revenue (Million), by Consumption Analysis 2025 & 2033
- Figure 53: Asia Pacific Acaricides Industry Revenue Share (%), by Consumption Analysis 2025 & 2033
- Figure 54: Asia Pacific Acaricides Industry Revenue (Million), by Import Market Analysis (Value & Volume) 2025 & 2033
- Figure 55: Asia Pacific Acaricides Industry Revenue Share (%), by Import Market Analysis (Value & Volume) 2025 & 2033
- Figure 56: Asia Pacific Acaricides Industry Revenue (Million), by Export Market Analysis (Value & Volume) 2025 & 2033
- Figure 57: Asia Pacific Acaricides Industry Revenue Share (%), by Export Market Analysis (Value & Volume) 2025 & 2033
- Figure 58: Asia Pacific Acaricides Industry Revenue (Million), by Price Trend Analysis 2025 & 2033
- Figure 59: Asia Pacific Acaricides Industry Revenue Share (%), by Price Trend Analysis 2025 & 2033
- Figure 60: Asia Pacific Acaricides Industry Revenue (Million), by Country 2025 & 2033
- Figure 61: Asia Pacific Acaricides Industry Revenue Share (%), by Country 2025 & 2033
List of Tables
- Table 1: Global Acaricides Industry Revenue Million Forecast, by Production Analysis 2020 & 2033
- Table 2: Global Acaricides Industry Revenue Million Forecast, by Consumption Analysis 2020 & 2033
- Table 3: Global Acaricides Industry Revenue Million Forecast, by Import Market Analysis (Value & Volume) 2020 & 2033
- Table 4: Global Acaricides Industry Revenue Million Forecast, by Export Market Analysis (Value & Volume) 2020 & 2033
- Table 5: Global Acaricides Industry Revenue Million Forecast, by Price Trend Analysis 2020 & 2033
- Table 6: Global Acaricides Industry Revenue Million Forecast, by Region 2020 & 2033
- Table 7: Global Acaricides Industry Revenue Million Forecast, by Production Analysis 2020 & 2033
- Table 8: Global Acaricides Industry Revenue Million Forecast, by Consumption Analysis 2020 & 2033
- Table 9: Global Acaricides Industry Revenue Million Forecast, by Import Market Analysis (Value & Volume) 2020 & 2033
- Table 10: Global Acaricides Industry Revenue Million Forecast, by Export Market Analysis (Value & Volume) 2020 & 2033
- Table 11: Global Acaricides Industry Revenue Million Forecast, by Price Trend Analysis 2020 & 2033
- Table 12: Global Acaricides Industry Revenue Million Forecast, by Country 2020 & 2033
- Table 13: United States Acaricides Industry Revenue (Million) Forecast, by Application 2020 & 2033
- Table 14: Canada Acaricides Industry Revenue (Million) Forecast, by Application 2020 & 2033
- Table 15: Mexico Acaricides Industry Revenue (Million) Forecast, by Application 2020 & 2033
- Table 16: Global Acaricides Industry Revenue Million Forecast, by Production Analysis 2020 & 2033
- Table 17: Global Acaricides Industry Revenue Million Forecast, by Consumption Analysis 2020 & 2033
- Table 18: Global Acaricides Industry Revenue Million Forecast, by Import Market Analysis (Value & Volume) 2020 & 2033
- Table 19: Global Acaricides Industry Revenue Million Forecast, by Export Market Analysis (Value & Volume) 2020 & 2033
- Table 20: Global Acaricides Industry Revenue Million Forecast, by Price Trend Analysis 2020 & 2033
- Table 21: Global Acaricides Industry Revenue Million Forecast, by Country 2020 & 2033
- Table 22: Brazil Acaricides Industry Revenue (Million) Forecast, by Application 2020 & 2033
- Table 23: Argentina Acaricides Industry Revenue (Million) Forecast, by Application 2020 & 2033
- Table 24: Rest of South America Acaricides Industry Revenue (Million) Forecast, by Application 2020 & 2033
- Table 25: Global Acaricides Industry Revenue Million Forecast, by Production Analysis 2020 & 2033
- Table 26: Global Acaricides Industry Revenue Million Forecast, by Consumption Analysis 2020 & 2033
- Table 27: Global Acaricides Industry Revenue Million Forecast, by Import Market Analysis (Value & Volume) 2020 & 2033
- Table 28: Global Acaricides Industry Revenue Million Forecast, by Export Market Analysis (Value & Volume) 2020 & 2033
- Table 29: Global Acaricides Industry Revenue Million Forecast, by Price Trend Analysis 2020 & 2033
- Table 30: Global Acaricides Industry Revenue Million Forecast, by Country 2020 & 2033
- Table 31: United Kingdom Acaricides Industry Revenue (Million) Forecast, by Application 2020 & 2033
- Table 32: Germany Acaricides Industry Revenue (Million) Forecast, by Application 2020 & 2033
- Table 33: France Acaricides Industry Revenue (Million) Forecast, by Application 2020 & 2033
- Table 34: Italy Acaricides Industry Revenue (Million) Forecast, by Application 2020 & 2033
- Table 35: Spain Acaricides Industry Revenue (Million) Forecast, by Application 2020 & 2033
- Table 36: Russia Acaricides Industry Revenue (Million) Forecast, by Application 2020 & 2033
- Table 37: Benelux Acaricides Industry Revenue (Million) Forecast, by Application 2020 & 2033
- Table 38: Nordics Acaricides Industry Revenue (Million) Forecast, by Application 2020 & 2033
- Table 39: Rest of Europe Acaricides Industry Revenue (Million) Forecast, by Application 2020 & 2033
- Table 40: Global Acaricides Industry Revenue Million Forecast, by Production Analysis 2020 & 2033
- Table 41: Global Acaricides Industry Revenue Million Forecast, by Consumption Analysis 2020 & 2033
- Table 42: Global Acaricides Industry Revenue Million Forecast, by Import Market Analysis (Value & Volume) 2020 & 2033
- Table 43: Global Acaricides Industry Revenue Million Forecast, by Export Market Analysis (Value & Volume) 2020 & 2033
- Table 44: Global Acaricides Industry Revenue Million Forecast, by Price Trend Analysis 2020 & 2033
- Table 45: Global Acaricides Industry Revenue Million Forecast, by Country 2020 & 2033
- Table 46: Turkey Acaricides Industry Revenue (Million) Forecast, by Application 2020 & 2033
- Table 47: Israel Acaricides Industry Revenue (Million) Forecast, by Application 2020 & 2033
- Table 48: GCC Acaricides Industry Revenue (Million) Forecast, by Application 2020 & 2033
- Table 49: North Africa Acaricides Industry Revenue (Million) Forecast, by Application 2020 & 2033
- Table 50: South Africa Acaricides Industry Revenue (Million) Forecast, by Application 2020 & 2033
- Table 51: Rest of Middle East & Africa Acaricides Industry Revenue (Million) Forecast, by Application 2020 & 2033
- Table 52: Global Acaricides Industry Revenue Million Forecast, by Production Analysis 2020 & 2033
- Table 53: Global Acaricides Industry Revenue Million Forecast, by Consumption Analysis 2020 & 2033
- Table 54: Global Acaricides Industry Revenue Million Forecast, by Import Market Analysis (Value & Volume) 2020 & 2033
- Table 55: Global Acaricides Industry Revenue Million Forecast, by Export Market Analysis (Value & Volume) 2020 & 2033
- Table 56: Global Acaricides Industry Revenue Million Forecast, by Price Trend Analysis 2020 & 2033
- Table 57: Global Acaricides Industry Revenue Million Forecast, by Country 2020 & 2033
- Table 58: China Acaricides Industry Revenue (Million) Forecast, by Application 2020 & 2033
- Table 59: India Acaricides Industry Revenue (Million) Forecast, by Application 2020 & 2033
- Table 60: Japan Acaricides Industry Revenue (Million) Forecast, by Application 2020 & 2033
- Table 61: South Korea Acaricides Industry Revenue (Million) Forecast, by Application 2020 & 2033
- Table 62: ASEAN Acaricides Industry Revenue (Million) Forecast, by Application 2020 & 2033
- Table 63: Oceania Acaricides Industry Revenue (Million) Forecast, by Application 2020 & 2033
- Table 64: Rest of Asia Pacific Acaricides Industry Revenue (Million) Forecast, by Application 2020 & 2033
Frequently Asked Questions
1. What is the projected Compound Annual Growth Rate (CAGR) of the Acaricides Industry?
The projected CAGR is approximately 5.00%.
2. Which companies are prominent players in the Acaricides Industry?
Key companies in the market include FMC Corporation, Nissan Chemical Industries Ltd, Syngenta International AG, UPL Limite, Bayer CropScience, Corteva Agriscience, BASF SE.
3. What are the main segments of the Acaricides Industry?
The market segments include Production Analysis, Consumption Analysis, Import Market Analysis (Value & Volume), Export Market Analysis (Value & Volume), Price Trend Analysis.
4. Can you provide details about the market size?
The market size is estimated to be USD 369.34 Million as of 2022.
5. What are some drivers contributing to market growth?
Shortage of Skilled Labor; Government Support to Enhance Farm Mechanization.
6. What are the notable trends driving market growth?
Increasing Demand for Natural Products.
7. Are there any restraints impacting market growth?
Heavy Initial Procurement Cost and High Expenditure on Maintenance.
8. Can you provide examples of recent developments in the market?
N/A
9. What pricing options are available for accessing the report?
Pricing options include single-user, multi-user, and enterprise licenses priced at USD 4750, USD 5250, and USD 8750 respectively.
10. Is the market size provided in terms of value or volume?
The market size is provided in terms of value, measured in Million.
11. Are there any specific market keywords associated with the report?
Yes, the market keyword associated with the report is "Acaricides Industry," which aids in identifying and referencing the specific market segment covered.
12. How do I determine which pricing option suits my needs best?
The pricing options vary based on user requirements and access needs. Individual users may opt for single-user licenses, while businesses requiring broader access may choose multi-user or enterprise licenses for cost-effective access to the report.
13. Are there any additional resources or data provided in the Acaricides Industry report?
While the report offers comprehensive insights, it's advisable to review the specific contents or supplementary materials provided to ascertain if additional resources or data are available.
14. How can I stay updated on further developments or reports in the Acaricides Industry?
To stay informed about further developments, trends, and reports in the Acaricides Industry, consider subscribing to industry newsletters, following relevant companies and organizations, or regularly checking reputable industry news sources and publications.
Methodology
Step 1 - Identification of Relevant Samples Size from Population Database


Step 2 - Approaches for Defining Global Market Size (Value, Volume* & Price*)

Note*: In applicable scenarios
Step 3 - Data Sources
Primary Research
- Web Analytics
- Survey Reports
- Research Institute
- Latest Research Reports
- Opinion Leaders
Secondary Research
- Annual Reports
- White Paper
- Latest Press Release
- Industry Association
- Paid Database
- Investor Presentations

Step 4 - Data Triangulation
Involves using different sources of information in order to increase the validity of a study
These sources are likely to be stakeholders in a program - participants, other researchers, program staff, other community members, and so on.
Then we put all data in single framework & apply various statistical tools to find out the dynamic on the market.
During the analysis stage, feedback from the stakeholder groups would be compared to determine areas of agreement as well as areas of divergence