

Key Insights
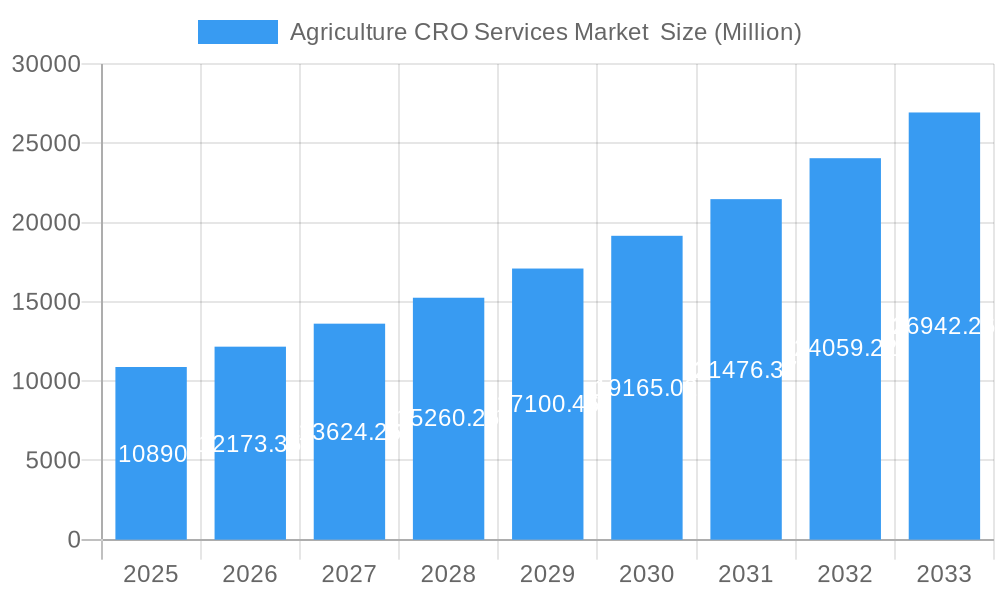
The global Agriculture CRO Services market, valued at $10.89 billion in 2025, is projected to experience robust growth, driven by several key factors. The increasing demand for higher crop yields to meet the food security needs of a growing global population is a primary driver. Furthermore, the rising adoption of advanced agricultural technologies, such as precision agriculture and biotechnology, necessitates specialized testing and research services provided by Contract Research Organizations (CROs). Stringent regulatory requirements for agricultural products are also pushing companies to outsource their testing and regulatory compliance processes to experienced CROs, boosting market growth. The market is segmented by service type (field services, laboratory services, regulatory services, and other services) and sector (crop protection chemicals, fertilizers, and seeds). Field services represent a significant portion of the market, given the need for on-site trials and data collection. Laboratory services are crucial for chemical analysis, while regulatory services address the increasing complexities of compliance. North America and Europe currently hold dominant market shares, owing to established agricultural practices and the presence of major CRO players. However, the Asia-Pacific region is expected to witness significant growth due to the rapid expansion of the agricultural sector in countries like China and India. This growth will be fueled by increasing investments in agricultural research and development, coupled with a growing demand for improved crop productivity.
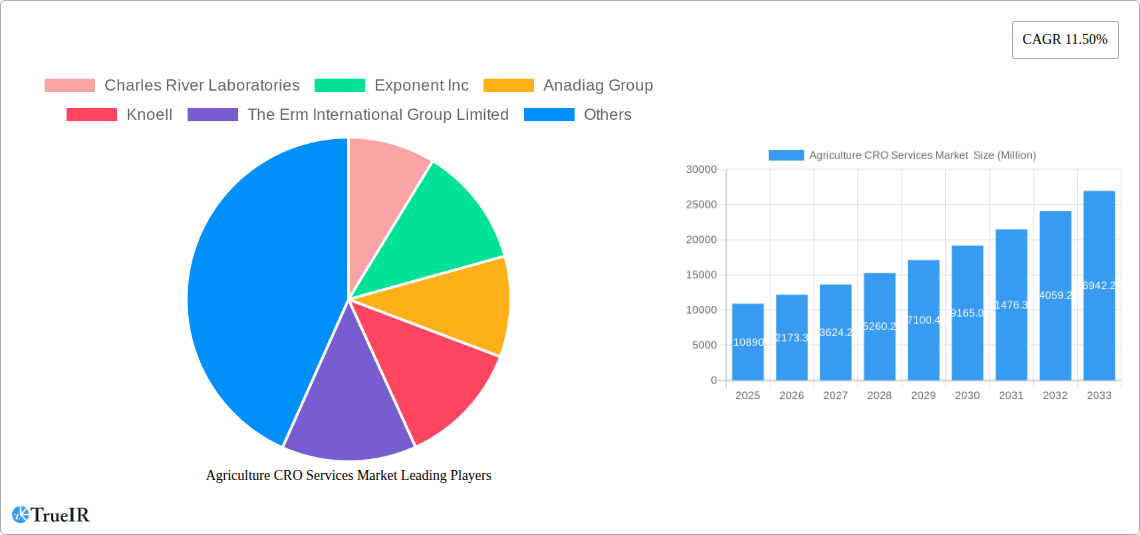
Agriculture CRO Services Market Market Size (In Billion)
The market's Compound Annual Growth Rate (CAGR) of 11.50% from 2025 to 2033 indicates substantial future growth potential. However, certain restraints such as high costs associated with CRO services and the availability of skilled personnel could temper this growth. Nevertheless, ongoing technological advancements, including the adoption of AI and big data analytics in agricultural research, are likely to create new opportunities within the market. The competitive landscape is fragmented, with numerous large and small CROs vying for market share. Companies like Charles River Laboratories, Eurofins Scientific, and others play significant roles, providing a wide spectrum of services across different agricultural sectors and geographies. The market's future trajectory is promising, driven by the critical need for efficient and effective agricultural practices to ensure global food security in the face of climate change and population growth.
Agriculture CRO Services Market Company Market Share
Agriculture CRO Services Market: A Comprehensive Report (2019-2033)
This dynamic report provides a detailed analysis of the Agriculture CRO Services Market, offering invaluable insights for stakeholders seeking to navigate this rapidly evolving landscape. The study period spans 2019-2033, with 2025 serving as the base and estimated year. The forecast period is 2025-2033, and the historical period covers 2019-2024. We project significant growth within the market, fueled by technological advancements, increasing regulatory scrutiny, and the growing demand for efficient and effective agricultural practices.
Agriculture CRO Services Market Structure & Competitive Landscape
The Agriculture CRO Services market exhibits a moderately concentrated structure, with a handful of large players and numerous smaller niche operators. Market concentration ratios (e.g., CR4, CR8) are currently estimated to be around xx%, indicating room for both consolidation and diversification. Innovation is a key driver, with companies continuously investing in advanced technologies like AI-powered data analytics and precision agriculture solutions. Regulatory impacts vary significantly across different regions and sectors, influencing service demand and compliance costs. Product substitutes are limited, mainly restricted to in-house R&D capabilities of large agricultural corporations.
End-user segmentation comprises crop protection chemical companies, fertilizer manufacturers, seed producers, and other agricultural businesses. M&A activity has been noticeable, with approximately xx deals recorded between 2019 and 2024, valued at an estimated $xx Million. These mergers and acquisitions are primarily driven by the desire to expand service offerings, geographic reach, and technological capabilities. The increasing complexity of regulations and the need for specialized expertise are further contributing factors.
- Market Concentration: xx% (estimated)
- Innovation Drivers: AI, precision agriculture, automation
- Regulatory Impacts: Vary significantly by region and sector
- M&A Activity: Approximately xx deals (2019-2024), valued at ~$xx Million
Agriculture CRO Services Market Market Trends & Opportunities
The global Agriculture CRO Services market is poised for robust growth, exhibiting a projected CAGR of xx% during the forecast period (2025-2033). Market size is estimated at $xx Million in 2025, expected to reach $xx Million by 2033. This growth trajectory is fueled by several key factors. Technological advancements, including the adoption of precision agriculture techniques and data analytics, are enabling more efficient and targeted crop management. Consumer preferences for sustainably produced food are driving demand for innovative and eco-friendly agricultural practices, increasing the need for CRO services. The competitive landscape is dynamic, characterized by both organic growth and strategic acquisitions, as companies strive to expand their market share and service offerings. Market penetration rates are expected to increase significantly in emerging economies, where agricultural production is rapidly expanding. Overall, the market presents a compelling opportunity for companies with the ability to adapt to these trends and innovate effectively.
Dominant Markets & Segments in Agriculture CRO Services Market
The North American region currently holds a dominant position in the Agriculture CRO Services market, largely due to its well-established agricultural infrastructure and high R&D spending. However, Asia-Pacific is exhibiting rapid growth, driven by increasing agricultural production and government investments in the sector. Within service types, Field Services represents the largest segment, capturing xx% of the market in 2025, followed by Laboratory Services and Regulatory Services. In terms of sectors, Crop Protection Chemicals accounts for the largest share, reflecting the stringent regulatory requirements and extensive testing protocols in this segment.
- Key Growth Drivers (North America): Advanced agricultural infrastructure, high R&D investments, stringent regulations
- Key Growth Drivers (Asia-Pacific): Increasing agricultural production, government investments, adoption of modern farming techniques
- Dominant Service Type: Field Services (xx% market share in 2025)
- Dominant Sector: Crop Protection Chemicals
Agriculture CRO Services Market Product Analysis
The Agriculture CRO Services market is witnessing the introduction of innovative products and services, encompassing advanced analytical tools, AI-powered data analysis platforms, and drone-based crop monitoring systems. These advancements significantly enhance the efficiency, accuracy, and cost-effectiveness of agricultural research and development. The key competitive advantages stem from the ability to provide comprehensive, integrated solutions, incorporating a wide range of services and technologies to address the diverse needs of clients across various agricultural sectors. The market fit for these products is excellent due to the ever-increasing need for data-driven decision-making and cost optimization within the agricultural sector.
Key Drivers, Barriers & Challenges in Agriculture CRO Services Market
Key Drivers:
The Agriculture CRO Services market is experiencing robust growth propelled by several key drivers. Technological advancements, including the widespread adoption of Artificial Intelligence (AI) for data analysis and predictive modeling, the implementation of precision agriculture techniques for optimized resource management, and the integration of automation in field trials, are significantly enhancing operational efficiency and reducing costs for agricultural enterprises. Furthermore, increasing regulatory scrutiny across global markets necessitates specialized expertise and robust data generation, creating a strong demand for CRO services. The growing global demand for sustainable agricultural practices, driven by environmental concerns and consumer preferences, is also a significant impetus, bolstering the demand for CRO services focused on developing and validating eco-friendly solutions, such as biopesticides and biofertilizers, as well as supporting integrated pest management (IPM) strategies.
Key Barriers & Challenges:
Despite the positive growth trajectory, the market faces significant hurdles. Stringent regulatory requirements and the associated compliance costs are a primary challenge, demanding substantial investment in expertise and documentation. Supply chain disruptions, exacerbated by geopolitical events and logistical complexities, can critically impact the availability of essential materials, specialized equipment, and skilled personnel, leading to project delays and increased operational expenses. The intense competition within the market necessitates continuous innovation, strategic differentiation, and a strong focus on cost optimization to maintain a competitive edge.
Market Impact of Supply Chain Issues: The market is estimated to face a substantial impact from ongoing supply chain challenges, with projections indicating a potential disruption of approximately 15-20% due to these issues between 2025 and 2030.
Growth Drivers in the Agriculture CRO Services Market Market
Technological advancements, such as AI-powered analytics and precision agriculture tools, significantly enhance efficiency and accuracy. Stringent regulatory requirements and increasing complexity necessitate specialized expertise and services from CROs. The burgeoning demand for sustainable agricultural practices fuels the need for specialized CRO support.
Challenges Impacting Agriculture CRO Services Market Growth
Several interconnected challenges continue to shape the trajectory of the Agriculture CRO Services market. Regulatory complexities and the escalating costs of compliance represent a significant hurdle for many organizations seeking to bring new agricultural products and technologies to market. Navigating diverse and evolving regulatory frameworks across different regions requires deep specialized knowledge and substantial financial investment. Moreover, persistent supply chain disruptions can lead to considerable project delays, increased costs for raw materials and essential supplies, and difficulties in maintaining the timely execution of field trials and laboratory analyses. The intense competition among established, global CROs and emerging regional players necessitates continuous innovation, the development of unique service offerings, and a clear strategy for differentiation to secure market share and foster sustainable growth.
Key Players Shaping the Agriculture CRO Services Market Market
- Charles River Laboratories
- Exponent Inc
- Anadiag Group
- Knoell
- The ERM International Group Limited
- Technology Sciences Group Consulting Limited
- Eurofins Scientific
- IES Limited (i2l Research Limited)
- Ibacon Gmbh
- Syntech Research Group
Significant Agriculture CRO Services Market Industry Milestones
- December 2023: Eurofins Scientific's strategic acquisition of SGS's Crop Science operations across 14 countries marked a significant expansion of its service portfolio and enhanced its global market presence in the agricultural testing and research sector.
- October 2023: The strategic partnership formed between SAI Global and ERM International Group Limited established a potent ecosystem for driving innovation and delivering comprehensive Environmental, Health, and Safety (EHS) solutions within the agricultural industry.
- January 2023: SynTech Research Group achieved a pivotal accreditation from the Colombian Institute of Agriculture, substantially broadening its operational scope and service reach within the Colombian market and reinforcing its commitment to quality research.
Future Outlook for Agriculture CRO Services Market Market
The Agriculture CRO Services market is poised for continued growth, driven by technological innovation, evolving regulatory landscapes, and the increasing demand for sustainable and efficient agricultural practices. Strategic opportunities abound for companies that can leverage advanced technologies, adapt to shifting regulatory requirements, and offer comprehensive solutions tailored to the specific needs of their clients. The market’s projected growth presents substantial potential for both established players and new entrants.
Agriculture CRO Services Market Segmentation
- 1. Production Analysis
- 2. Consumption Analysis
- 3. Import Market Analysis (Value & Volume)
- 4. Export Market Analysis (Value & Volume)
- 5. Price Trend Analysis
Agriculture CRO Services Market Segmentation By Geography
-
1. North America
- 1.1. United States
- 1.2. Canada
- 1.3. Mexico
-
2. South America
- 2.1. Brazil
- 2.2. Argentina
- 2.3. Rest of South America
-
3. Europe
- 3.1. United Kingdom
- 3.2. Germany
- 3.3. France
- 3.4. Italy
- 3.5. Spain
- 3.6. Russia
- 3.7. Benelux
- 3.8. Nordics
- 3.9. Rest of Europe
-
4. Middle East & Africa
- 4.1. Turkey
- 4.2. Israel
- 4.3. GCC
- 4.4. North Africa
- 4.5. South Africa
- 4.6. Rest of Middle East & Africa
-
5. Asia Pacific
- 5.1. China
- 5.2. India
- 5.3. Japan
- 5.4. South Korea
- 5.5. ASEAN
- 5.6. Oceania
- 5.7. Rest of Asia Pacific
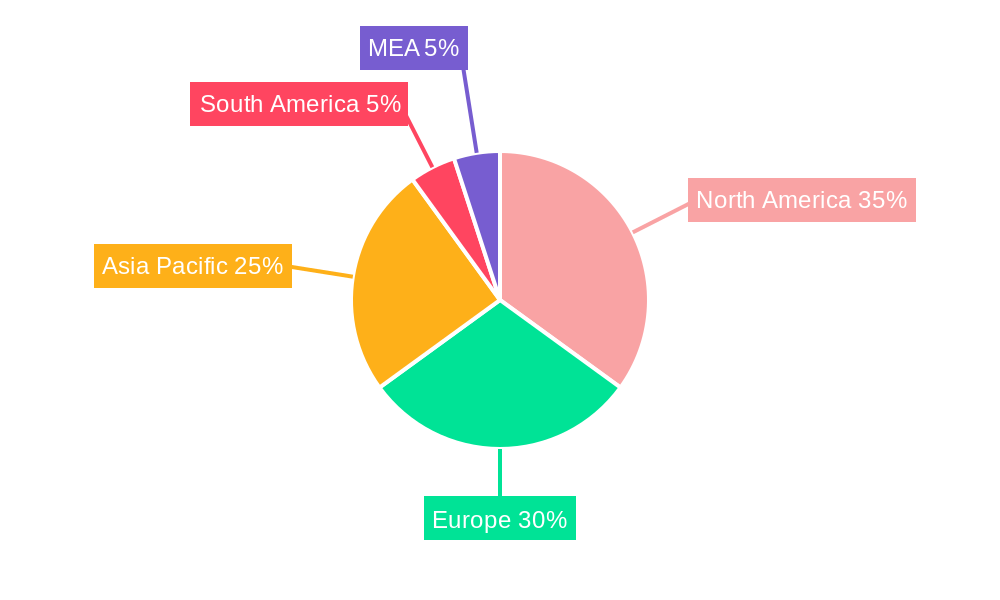
Agriculture CRO Services Market Regional Market Share
Geographic Coverage of Agriculture CRO Services Market
Agriculture CRO Services Market REPORT HIGHLIGHTS
| Aspects | Details |
|---|---|
| Study Period | 2020-2034 |
| Base Year | 2025 |
| Estimated Year | 2026 |
| Forecast Period | 2026-2034 |
| Historical Period | 2020-2025 |
| Growth Rate | CAGR of 11.50% from 2020-2034 |
| Segmentation |
|
Table of Contents
- 1. Introduction
- 1.1. Research Scope
- 1.2. Market Segmentation
- 1.3. Research Methodology
- 1.4. Definitions and Assumptions
- 2. Executive Summary
- 2.1. Introduction
- 3. Market Dynamics
- 3.1. Introduction
- 3.2. Market Drivers
- 3.2.1. Need for Custom Product Development; Use of CROs for Regulatory Services
- 3.3. Market Restrains
- 3.3.1. Data and Cyber Security Concerns; Lack of Experts and Professionals in this Industry
- 3.4. Market Trends
- 3.4.1. Fertilizer is the Biggest Sector for CRO Services
- 4. Market Factor Analysis
- 4.1. Porters Five Forces
- 4.2. Supply/Value Chain
- 4.3. PESTEL analysis
- 4.4. Market Entropy
- 4.5. Patent/Trademark Analysis
- 5. Global Agriculture CRO Services Market Analysis, Insights and Forecast, 2020-2032
- 5.1. Market Analysis, Insights and Forecast - by Production Analysis
- 5.2. Market Analysis, Insights and Forecast - by Consumption Analysis
- 5.3. Market Analysis, Insights and Forecast - by Import Market Analysis (Value & Volume)
- 5.4. Market Analysis, Insights and Forecast - by Export Market Analysis (Value & Volume)
- 5.5. Market Analysis, Insights and Forecast - by Price Trend Analysis
- 5.6. Market Analysis, Insights and Forecast - by Region
- 5.6.1. North America
- 5.6.2. South America
- 5.6.3. Europe
- 5.6.4. Middle East & Africa
- 5.6.5. Asia Pacific
- 5.1. Market Analysis, Insights and Forecast - by Production Analysis
- 6. North America Agriculture CRO Services Market Analysis, Insights and Forecast, 2020-2032
- 6.1. Market Analysis, Insights and Forecast - by Production Analysis
- 6.2. Market Analysis, Insights and Forecast - by Consumption Analysis
- 6.3. Market Analysis, Insights and Forecast - by Import Market Analysis (Value & Volume)
- 6.4. Market Analysis, Insights and Forecast - by Export Market Analysis (Value & Volume)
- 6.5. Market Analysis, Insights and Forecast - by Price Trend Analysis
- 6.1. Market Analysis, Insights and Forecast - by Production Analysis
- 7. South America Agriculture CRO Services Market Analysis, Insights and Forecast, 2020-2032
- 7.1. Market Analysis, Insights and Forecast - by Production Analysis
- 7.2. Market Analysis, Insights and Forecast - by Consumption Analysis
- 7.3. Market Analysis, Insights and Forecast - by Import Market Analysis (Value & Volume)
- 7.4. Market Analysis, Insights and Forecast - by Export Market Analysis (Value & Volume)
- 7.5. Market Analysis, Insights and Forecast - by Price Trend Analysis
- 7.1. Market Analysis, Insights and Forecast - by Production Analysis
- 8. Europe Agriculture CRO Services Market Analysis, Insights and Forecast, 2020-2032
- 8.1. Market Analysis, Insights and Forecast - by Production Analysis
- 8.2. Market Analysis, Insights and Forecast - by Consumption Analysis
- 8.3. Market Analysis, Insights and Forecast - by Import Market Analysis (Value & Volume)
- 8.4. Market Analysis, Insights and Forecast - by Export Market Analysis (Value & Volume)
- 8.5. Market Analysis, Insights and Forecast - by Price Trend Analysis
- 8.1. Market Analysis, Insights and Forecast - by Production Analysis
- 9. Middle East & Africa Agriculture CRO Services Market Analysis, Insights and Forecast, 2020-2032
- 9.1. Market Analysis, Insights and Forecast - by Production Analysis
- 9.2. Market Analysis, Insights and Forecast - by Consumption Analysis
- 9.3. Market Analysis, Insights and Forecast - by Import Market Analysis (Value & Volume)
- 9.4. Market Analysis, Insights and Forecast - by Export Market Analysis (Value & Volume)
- 9.5. Market Analysis, Insights and Forecast - by Price Trend Analysis
- 9.1. Market Analysis, Insights and Forecast - by Production Analysis
- 10. Asia Pacific Agriculture CRO Services Market Analysis, Insights and Forecast, 2020-2032
- 10.1. Market Analysis, Insights and Forecast - by Production Analysis
- 10.2. Market Analysis, Insights and Forecast - by Consumption Analysis
- 10.3. Market Analysis, Insights and Forecast - by Import Market Analysis (Value & Volume)
- 10.4. Market Analysis, Insights and Forecast - by Export Market Analysis (Value & Volume)
- 10.5. Market Analysis, Insights and Forecast - by Price Trend Analysis
- 10.1. Market Analysis, Insights and Forecast - by Production Analysis
- 11. Competitive Analysis
- 11.1. Global Market Share Analysis 2025
- 11.2. Company Profiles
- 11.2.1 Charles River Laboratories
- 11.2.1.1. Overview
- 11.2.1.2. Products
- 11.2.1.3. SWOT Analysis
- 11.2.1.4. Recent Developments
- 11.2.1.5. Financials (Based on Availability)
- 11.2.2 Exponent Inc
- 11.2.2.1. Overview
- 11.2.2.2. Products
- 11.2.2.3. SWOT Analysis
- 11.2.2.4. Recent Developments
- 11.2.2.5. Financials (Based on Availability)
- 11.2.3 Anadiag Group
- 11.2.3.1. Overview
- 11.2.3.2. Products
- 11.2.3.3. SWOT Analysis
- 11.2.3.4. Recent Developments
- 11.2.3.5. Financials (Based on Availability)
- 11.2.4 Knoell
- 11.2.4.1. Overview
- 11.2.4.2. Products
- 11.2.4.3. SWOT Analysis
- 11.2.4.4. Recent Developments
- 11.2.4.5. Financials (Based on Availability)
- 11.2.5 The Erm International Group Limited
- 11.2.5.1. Overview
- 11.2.5.2. Products
- 11.2.5.3. SWOT Analysis
- 11.2.5.4. Recent Developments
- 11.2.5.5. Financials (Based on Availability)
- 11.2.6 Technology Sciences Group Consulting Limited
- 11.2.6.1. Overview
- 11.2.6.2. Products
- 11.2.6.3. SWOT Analysis
- 11.2.6.4. Recent Developments
- 11.2.6.5. Financials (Based on Availability)
- 11.2.7 Eurofins Scientific
- 11.2.7.1. Overview
- 11.2.7.2. Products
- 11.2.7.3. SWOT Analysis
- 11.2.7.4. Recent Developments
- 11.2.7.5. Financials (Based on Availability)
- 11.2.8 Ies Limited (i2l Research Limited)
- 11.2.8.1. Overview
- 11.2.8.2. Products
- 11.2.8.3. SWOT Analysis
- 11.2.8.4. Recent Developments
- 11.2.8.5. Financials (Based on Availability)
- 11.2.9 Ibacon Gmbh*List Not Exhaustive
- 11.2.9.1. Overview
- 11.2.9.2. Products
- 11.2.9.3. SWOT Analysis
- 11.2.9.4. Recent Developments
- 11.2.9.5. Financials (Based on Availability)
- 11.2.10 Syntech Research Group
- 11.2.10.1. Overview
- 11.2.10.2. Products
- 11.2.10.3. SWOT Analysis
- 11.2.10.4. Recent Developments
- 11.2.10.5. Financials (Based on Availability)
- 11.2.1 Charles River Laboratories
List of Figures
- Figure 1: Global Agriculture CRO Services Market Revenue Breakdown (Million, %) by Region 2025 & 2033
- Figure 2: North America Agriculture CRO Services Market Revenue (Million), by Production Analysis 2025 & 2033
- Figure 3: North America Agriculture CRO Services Market Revenue Share (%), by Production Analysis 2025 & 2033
- Figure 4: North America Agriculture CRO Services Market Revenue (Million), by Consumption Analysis 2025 & 2033
- Figure 5: North America Agriculture CRO Services Market Revenue Share (%), by Consumption Analysis 2025 & 2033
- Figure 6: North America Agriculture CRO Services Market Revenue (Million), by Import Market Analysis (Value & Volume) 2025 & 2033
- Figure 7: North America Agriculture CRO Services Market Revenue Share (%), by Import Market Analysis (Value & Volume) 2025 & 2033
- Figure 8: North America Agriculture CRO Services Market Revenue (Million), by Export Market Analysis (Value & Volume) 2025 & 2033
- Figure 9: North America Agriculture CRO Services Market Revenue Share (%), by Export Market Analysis (Value & Volume) 2025 & 2033
- Figure 10: North America Agriculture CRO Services Market Revenue (Million), by Price Trend Analysis 2025 & 2033
- Figure 11: North America Agriculture CRO Services Market Revenue Share (%), by Price Trend Analysis 2025 & 2033
- Figure 12: North America Agriculture CRO Services Market Revenue (Million), by Country 2025 & 2033
- Figure 13: North America Agriculture CRO Services Market Revenue Share (%), by Country 2025 & 2033
- Figure 14: South America Agriculture CRO Services Market Revenue (Million), by Production Analysis 2025 & 2033
- Figure 15: South America Agriculture CRO Services Market Revenue Share (%), by Production Analysis 2025 & 2033
- Figure 16: South America Agriculture CRO Services Market Revenue (Million), by Consumption Analysis 2025 & 2033
- Figure 17: South America Agriculture CRO Services Market Revenue Share (%), by Consumption Analysis 2025 & 2033
- Figure 18: South America Agriculture CRO Services Market Revenue (Million), by Import Market Analysis (Value & Volume) 2025 & 2033
- Figure 19: South America Agriculture CRO Services Market Revenue Share (%), by Import Market Analysis (Value & Volume) 2025 & 2033
- Figure 20: South America Agriculture CRO Services Market Revenue (Million), by Export Market Analysis (Value & Volume) 2025 & 2033
- Figure 21: South America Agriculture CRO Services Market Revenue Share (%), by Export Market Analysis (Value & Volume) 2025 & 2033
- Figure 22: South America Agriculture CRO Services Market Revenue (Million), by Price Trend Analysis 2025 & 2033
- Figure 23: South America Agriculture CRO Services Market Revenue Share (%), by Price Trend Analysis 2025 & 2033
- Figure 24: South America Agriculture CRO Services Market Revenue (Million), by Country 2025 & 2033
- Figure 25: South America Agriculture CRO Services Market Revenue Share (%), by Country 2025 & 2033
- Figure 26: Europe Agriculture CRO Services Market Revenue (Million), by Production Analysis 2025 & 2033
- Figure 27: Europe Agriculture CRO Services Market Revenue Share (%), by Production Analysis 2025 & 2033
- Figure 28: Europe Agriculture CRO Services Market Revenue (Million), by Consumption Analysis 2025 & 2033
- Figure 29: Europe Agriculture CRO Services Market Revenue Share (%), by Consumption Analysis 2025 & 2033
- Figure 30: Europe Agriculture CRO Services Market Revenue (Million), by Import Market Analysis (Value & Volume) 2025 & 2033
- Figure 31: Europe Agriculture CRO Services Market Revenue Share (%), by Import Market Analysis (Value & Volume) 2025 & 2033
- Figure 32: Europe Agriculture CRO Services Market Revenue (Million), by Export Market Analysis (Value & Volume) 2025 & 2033
- Figure 33: Europe Agriculture CRO Services Market Revenue Share (%), by Export Market Analysis (Value & Volume) 2025 & 2033
- Figure 34: Europe Agriculture CRO Services Market Revenue (Million), by Price Trend Analysis 2025 & 2033
- Figure 35: Europe Agriculture CRO Services Market Revenue Share (%), by Price Trend Analysis 2025 & 2033
- Figure 36: Europe Agriculture CRO Services Market Revenue (Million), by Country 2025 & 2033
- Figure 37: Europe Agriculture CRO Services Market Revenue Share (%), by Country 2025 & 2033
- Figure 38: Middle East & Africa Agriculture CRO Services Market Revenue (Million), by Production Analysis 2025 & 2033
- Figure 39: Middle East & Africa Agriculture CRO Services Market Revenue Share (%), by Production Analysis 2025 & 2033
- Figure 40: Middle East & Africa Agriculture CRO Services Market Revenue (Million), by Consumption Analysis 2025 & 2033
- Figure 41: Middle East & Africa Agriculture CRO Services Market Revenue Share (%), by Consumption Analysis 2025 & 2033
- Figure 42: Middle East & Africa Agriculture CRO Services Market Revenue (Million), by Import Market Analysis (Value & Volume) 2025 & 2033
- Figure 43: Middle East & Africa Agriculture CRO Services Market Revenue Share (%), by Import Market Analysis (Value & Volume) 2025 & 2033
- Figure 44: Middle East & Africa Agriculture CRO Services Market Revenue (Million), by Export Market Analysis (Value & Volume) 2025 & 2033
- Figure 45: Middle East & Africa Agriculture CRO Services Market Revenue Share (%), by Export Market Analysis (Value & Volume) 2025 & 2033
- Figure 46: Middle East & Africa Agriculture CRO Services Market Revenue (Million), by Price Trend Analysis 2025 & 2033
- Figure 47: Middle East & Africa Agriculture CRO Services Market Revenue Share (%), by Price Trend Analysis 2025 & 2033
- Figure 48: Middle East & Africa Agriculture CRO Services Market Revenue (Million), by Country 2025 & 2033
- Figure 49: Middle East & Africa Agriculture CRO Services Market Revenue Share (%), by Country 2025 & 2033
- Figure 50: Asia Pacific Agriculture CRO Services Market Revenue (Million), by Production Analysis 2025 & 2033
- Figure 51: Asia Pacific Agriculture CRO Services Market Revenue Share (%), by Production Analysis 2025 & 2033
- Figure 52: Asia Pacific Agriculture CRO Services Market Revenue (Million), by Consumption Analysis 2025 & 2033
- Figure 53: Asia Pacific Agriculture CRO Services Market Revenue Share (%), by Consumption Analysis 2025 & 2033
- Figure 54: Asia Pacific Agriculture CRO Services Market Revenue (Million), by Import Market Analysis (Value & Volume) 2025 & 2033
- Figure 55: Asia Pacific Agriculture CRO Services Market Revenue Share (%), by Import Market Analysis (Value & Volume) 2025 & 2033
- Figure 56: Asia Pacific Agriculture CRO Services Market Revenue (Million), by Export Market Analysis (Value & Volume) 2025 & 2033
- Figure 57: Asia Pacific Agriculture CRO Services Market Revenue Share (%), by Export Market Analysis (Value & Volume) 2025 & 2033
- Figure 58: Asia Pacific Agriculture CRO Services Market Revenue (Million), by Price Trend Analysis 2025 & 2033
- Figure 59: Asia Pacific Agriculture CRO Services Market Revenue Share (%), by Price Trend Analysis 2025 & 2033
- Figure 60: Asia Pacific Agriculture CRO Services Market Revenue (Million), by Country 2025 & 2033
- Figure 61: Asia Pacific Agriculture CRO Services Market Revenue Share (%), by Country 2025 & 2033
List of Tables
- Table 1: Global Agriculture CRO Services Market Revenue Million Forecast, by Production Analysis 2020 & 2033
- Table 2: Global Agriculture CRO Services Market Revenue Million Forecast, by Consumption Analysis 2020 & 2033
- Table 3: Global Agriculture CRO Services Market Revenue Million Forecast, by Import Market Analysis (Value & Volume) 2020 & 2033
- Table 4: Global Agriculture CRO Services Market Revenue Million Forecast, by Export Market Analysis (Value & Volume) 2020 & 2033
- Table 5: Global Agriculture CRO Services Market Revenue Million Forecast, by Price Trend Analysis 2020 & 2033
- Table 6: Global Agriculture CRO Services Market Revenue Million Forecast, by Region 2020 & 2033
- Table 7: Global Agriculture CRO Services Market Revenue Million Forecast, by Production Analysis 2020 & 2033
- Table 8: Global Agriculture CRO Services Market Revenue Million Forecast, by Consumption Analysis 2020 & 2033
- Table 9: Global Agriculture CRO Services Market Revenue Million Forecast, by Import Market Analysis (Value & Volume) 2020 & 2033
- Table 10: Global Agriculture CRO Services Market Revenue Million Forecast, by Export Market Analysis (Value & Volume) 2020 & 2033
- Table 11: Global Agriculture CRO Services Market Revenue Million Forecast, by Price Trend Analysis 2020 & 2033
- Table 12: Global Agriculture CRO Services Market Revenue Million Forecast, by Country 2020 & 2033
- Table 13: United States Agriculture CRO Services Market Revenue (Million) Forecast, by Application 2020 & 2033
- Table 14: Canada Agriculture CRO Services Market Revenue (Million) Forecast, by Application 2020 & 2033
- Table 15: Mexico Agriculture CRO Services Market Revenue (Million) Forecast, by Application 2020 & 2033
- Table 16: Global Agriculture CRO Services Market Revenue Million Forecast, by Production Analysis 2020 & 2033
- Table 17: Global Agriculture CRO Services Market Revenue Million Forecast, by Consumption Analysis 2020 & 2033
- Table 18: Global Agriculture CRO Services Market Revenue Million Forecast, by Import Market Analysis (Value & Volume) 2020 & 2033
- Table 19: Global Agriculture CRO Services Market Revenue Million Forecast, by Export Market Analysis (Value & Volume) 2020 & 2033
- Table 20: Global Agriculture CRO Services Market Revenue Million Forecast, by Price Trend Analysis 2020 & 2033
- Table 21: Global Agriculture CRO Services Market Revenue Million Forecast, by Country 2020 & 2033
- Table 22: Brazil Agriculture CRO Services Market Revenue (Million) Forecast, by Application 2020 & 2033
- Table 23: Argentina Agriculture CRO Services Market Revenue (Million) Forecast, by Application 2020 & 2033
- Table 24: Rest of South America Agriculture CRO Services Market Revenue (Million) Forecast, by Application 2020 & 2033
- Table 25: Global Agriculture CRO Services Market Revenue Million Forecast, by Production Analysis 2020 & 2033
- Table 26: Global Agriculture CRO Services Market Revenue Million Forecast, by Consumption Analysis 2020 & 2033
- Table 27: Global Agriculture CRO Services Market Revenue Million Forecast, by Import Market Analysis (Value & Volume) 2020 & 2033
- Table 28: Global Agriculture CRO Services Market Revenue Million Forecast, by Export Market Analysis (Value & Volume) 2020 & 2033
- Table 29: Global Agriculture CRO Services Market Revenue Million Forecast, by Price Trend Analysis 2020 & 2033
- Table 30: Global Agriculture CRO Services Market Revenue Million Forecast, by Country 2020 & 2033
- Table 31: United Kingdom Agriculture CRO Services Market Revenue (Million) Forecast, by Application 2020 & 2033
- Table 32: Germany Agriculture CRO Services Market Revenue (Million) Forecast, by Application 2020 & 2033
- Table 33: France Agriculture CRO Services Market Revenue (Million) Forecast, by Application 2020 & 2033
- Table 34: Italy Agriculture CRO Services Market Revenue (Million) Forecast, by Application 2020 & 2033
- Table 35: Spain Agriculture CRO Services Market Revenue (Million) Forecast, by Application 2020 & 2033
- Table 36: Russia Agriculture CRO Services Market Revenue (Million) Forecast, by Application 2020 & 2033
- Table 37: Benelux Agriculture CRO Services Market Revenue (Million) Forecast, by Application 2020 & 2033
- Table 38: Nordics Agriculture CRO Services Market Revenue (Million) Forecast, by Application 2020 & 2033
- Table 39: Rest of Europe Agriculture CRO Services Market Revenue (Million) Forecast, by Application 2020 & 2033
- Table 40: Global Agriculture CRO Services Market Revenue Million Forecast, by Production Analysis 2020 & 2033
- Table 41: Global Agriculture CRO Services Market Revenue Million Forecast, by Consumption Analysis 2020 & 2033
- Table 42: Global Agriculture CRO Services Market Revenue Million Forecast, by Import Market Analysis (Value & Volume) 2020 & 2033
- Table 43: Global Agriculture CRO Services Market Revenue Million Forecast, by Export Market Analysis (Value & Volume) 2020 & 2033
- Table 44: Global Agriculture CRO Services Market Revenue Million Forecast, by Price Trend Analysis 2020 & 2033
- Table 45: Global Agriculture CRO Services Market Revenue Million Forecast, by Country 2020 & 2033
- Table 46: Turkey Agriculture CRO Services Market Revenue (Million) Forecast, by Application 2020 & 2033
- Table 47: Israel Agriculture CRO Services Market Revenue (Million) Forecast, by Application 2020 & 2033
- Table 48: GCC Agriculture CRO Services Market Revenue (Million) Forecast, by Application 2020 & 2033
- Table 49: North Africa Agriculture CRO Services Market Revenue (Million) Forecast, by Application 2020 & 2033
- Table 50: South Africa Agriculture CRO Services Market Revenue (Million) Forecast, by Application 2020 & 2033
- Table 51: Rest of Middle East & Africa Agriculture CRO Services Market Revenue (Million) Forecast, by Application 2020 & 2033
- Table 52: Global Agriculture CRO Services Market Revenue Million Forecast, by Production Analysis 2020 & 2033
- Table 53: Global Agriculture CRO Services Market Revenue Million Forecast, by Consumption Analysis 2020 & 2033
- Table 54: Global Agriculture CRO Services Market Revenue Million Forecast, by Import Market Analysis (Value & Volume) 2020 & 2033
- Table 55: Global Agriculture CRO Services Market Revenue Million Forecast, by Export Market Analysis (Value & Volume) 2020 & 2033
- Table 56: Global Agriculture CRO Services Market Revenue Million Forecast, by Price Trend Analysis 2020 & 2033
- Table 57: Global Agriculture CRO Services Market Revenue Million Forecast, by Country 2020 & 2033
- Table 58: China Agriculture CRO Services Market Revenue (Million) Forecast, by Application 2020 & 2033
- Table 59: India Agriculture CRO Services Market Revenue (Million) Forecast, by Application 2020 & 2033
- Table 60: Japan Agriculture CRO Services Market Revenue (Million) Forecast, by Application 2020 & 2033
- Table 61: South Korea Agriculture CRO Services Market Revenue (Million) Forecast, by Application 2020 & 2033
- Table 62: ASEAN Agriculture CRO Services Market Revenue (Million) Forecast, by Application 2020 & 2033
- Table 63: Oceania Agriculture CRO Services Market Revenue (Million) Forecast, by Application 2020 & 2033
- Table 64: Rest of Asia Pacific Agriculture CRO Services Market Revenue (Million) Forecast, by Application 2020 & 2033
Frequently Asked Questions
1. What is the projected Compound Annual Growth Rate (CAGR) of the Agriculture CRO Services Market ?
The projected CAGR is approximately 11.50%.
2. Which companies are prominent players in the Agriculture CRO Services Market ?
Key companies in the market include Charles River Laboratories, Exponent Inc, Anadiag Group, Knoell, The Erm International Group Limited, Technology Sciences Group Consulting Limited, Eurofins Scientific, Ies Limited (i2l Research Limited), Ibacon Gmbh*List Not Exhaustive, Syntech Research Group.
3. What are the main segments of the Agriculture CRO Services Market ?
The market segments include Production Analysis, Consumption Analysis, Import Market Analysis (Value & Volume), Export Market Analysis (Value & Volume), Price Trend Analysis.
4. Can you provide details about the market size?
The market size is estimated to be USD 10.89 Million as of 2022.
5. What are some drivers contributing to market growth?
Need for Custom Product Development; Use of CROs for Regulatory Services.
6. What are the notable trends driving market growth?
Fertilizer is the Biggest Sector for CRO Services.
7. Are there any restraints impacting market growth?
Data and Cyber Security Concerns; Lack of Experts and Professionals in this Industry.
8. Can you provide examples of recent developments in the market?
December 2023: Eurofins signed an agreement to acquire the operations of SGS Crop Science in 14 countries. The acquisition further reinforced service offerings in agriscience contract research services and agro testing and its commitment to providing its clients with the best scientific and regulatory support standards.
9. What pricing options are available for accessing the report?
Pricing options include single-user, multi-user, and enterprise licenses priced at USD 4750, USD 5250, and USD 8750 respectively.
10. Is the market size provided in terms of value or volume?
The market size is provided in terms of value, measured in Million.
11. Are there any specific market keywords associated with the report?
Yes, the market keyword associated with the report is "Agriculture CRO Services Market ," which aids in identifying and referencing the specific market segment covered.
12. How do I determine which pricing option suits my needs best?
The pricing options vary based on user requirements and access needs. Individual users may opt for single-user licenses, while businesses requiring broader access may choose multi-user or enterprise licenses for cost-effective access to the report.
13. Are there any additional resources or data provided in the Agriculture CRO Services Market report?
While the report offers comprehensive insights, it's advisable to review the specific contents or supplementary materials provided to ascertain if additional resources or data are available.
14. How can I stay updated on further developments or reports in the Agriculture CRO Services Market ?
To stay informed about further developments, trends, and reports in the Agriculture CRO Services Market , consider subscribing to industry newsletters, following relevant companies and organizations, or regularly checking reputable industry news sources and publications.
Methodology
Step 1 - Identification of Relevant Samples Size from Population Database


Step 2 - Approaches for Defining Global Market Size (Value, Volume* & Price*)

Note*: In applicable scenarios
Step 3 - Data Sources
Primary Research
- Web Analytics
- Survey Reports
- Research Institute
- Latest Research Reports
- Opinion Leaders
Secondary Research
- Annual Reports
- White Paper
- Latest Press Release
- Industry Association
- Paid Database
- Investor Presentations

Step 4 - Data Triangulation
Involves using different sources of information in order to increase the validity of a study
These sources are likely to be stakeholders in a program - participants, other researchers, program staff, other community members, and so on.
Then we put all data in single framework & apply various statistical tools to find out the dynamic on the market.
During the analysis stage, feedback from the stakeholder groups would be compared to determine areas of agreement as well as areas of divergence